


|
시장보고서
상품코드
1637890
주택용 태양에너지 시장 : 시장 점유율 분석, 산업 동향 및 통계, 성장 예측(2025-2030년)Residential Solar Energy - Market Share Analysis, Industry Trends & Statistics, Growth Forecasts (2025 - 2030) |
||||||
■ 보고서에 따라 최신 정보로 업데이트하여 보내드립니다. 배송일정은 문의해 주시기 바랍니다.
가격
※ 부가세 별도
한글목차
영문목차
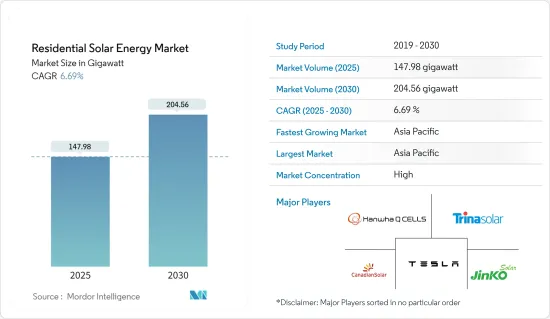
주택용 태양에너지 시장 규모는 2025년에 147.98 기가와트로 추정되고, 예측기간 2025년부터 2030년까지의 CAGR은 6.69%로 전망되며, 2030년에는 204.56 기가와트에 달할 것으로 예측됩니다.

주요 하이라이트
- 중기적으로는 유리한 정부 시책, 향후의 지붕상 태양광 발전 프로젝트에 대한 투자 증가, 태양에너지 도입 증가로 이어지는 태양에너지의 비용 절감 등의 요인이, 예측 기간 중 시장을 견인할 것으로 보입니다.
- 한편, 아프리카 등 지역에서는 자금조달 옵션 부족과 주택용 태양광 발전 시스템의 통합이 어려워 시장 성장을 억제할 것으로 예상됩니다.
- 그러나 에너지 믹스에서 차지하는 신재생 에너지의 비율을 늘리겠다는 야심찬 목표가 제시되고 있습니다. 이들 국가의 정부는 또한 향후 수년간 주거용 태양광 발전 시스템을 도입하여 신재생 에너지의 비율을 늘릴 계획입니다. 이것은 예측 기간 동안 주택용 태양광 발전의 제조업체와 공급업체에게 좋은 기회가 될 것으로 기대됩니다.
- 아시아태평양은 에너지 수요 증가로 예측 기간 동안 가장 빠르게 성장하는 시장이 될 것으로 예상됩니다. 이 성장은 인도, 중국, 호주를 포함한 아시아태평양 국가의 투자 증가와 정부의 지원 조치로 인한 것입니다.
주택용 태양에너지 시장 동향
옥상 태양광 설치 증가로 시장 견인
- 주거 부문에서의 태양광 발전 시스템 도입 증가는 주로 전기 요금 절감, 대체 전력원의 필요성, 기후 변화 위험 감소에 대한 기대 때문입니다.
- 예측기간 동안 태양광 발전 비용 저하, 주택용 태양광 발전에 대한 정부의 지원 시책, FIT 프로그램과 인센티브, 다양한 태양광 에너지 목표에 따라 옥상용 태양광 발전 수요가 증가할 것으로 예상됩니다.
- 주택용 지붕상 태양광 발전의 전력 비용은 최근 급속히 떨어지고 있습니다. 가격 하락은 세계 주택용 태양광 발전 용량의 상당한 증가를 가져오고 있으며, 많은 국가들이 주택용 지붕상 태양광 발전의 목표를 늘리고 있습니다.
- 태양 에너지 산업협회(SEIA) 통계에 따르면 2023년 미국 주택용 태양광 발전의 누적 설치 용량은 약 3,626만 8,000kW에 달할 전망입니다. 총 설치 용량은 전년 대비 23% 증가했습니다. 용량 증가는 주로 가정 전기 요금의 상승과 정전으로 인한 것입니다.
- 유럽 공동연구센터의 분석에 따르면 EU의 지붕상 태양광 발전은 연간 680TWh의 태양광 발전이 가능합니다.
- 2024년 4월 독일 의회는 국내 태양광 발전 개발을 지원하는 일련의 새로운 조치를 승인했습니다. 40kW의 옥상 태양광 발전 설비는 고정 가격 임베디드 제도의 대상이 되어 현행 가격 수준보다 1.5c/kWh 높아집니다. 또한 신규법은 대규모 설치 입찰에서 지상 설치형 태양광 발전 프로젝트의 상한을 20MW에서 50MW로 끌어올립니다. 마지막으로 일반 가정에서도 PV 발코니 시스템과 스마트 에너지 커뮤니티의 도입이 용이해집니다.
- 이러한 모든 요인은 예측 기간 동안 주택용 태양광 발전에 대한 수요를 촉진할 것으로 예상됩니다.
아시아태평양이 시장을 독점
- 아시아태평양은 세계의 주택용 태양광 발전 시장의 30% 이상을 차지하고 있습니다. 예측 기간 동안에도 그 우위성은 계속될 것으로 보입니다.
- 인도의 태양광 발전 설비 용량은 2022년 63.048GW에서 2023년에는 72.767GW로 크게 증가하고 있으며, 전력 수요는 앞으로 더욱 증가할 것으로 예상됩니다.
- 증가하는 전력 수요에 대응하고 2030년까지 500GW라는 신재생 에너지 목표를 달성하기 위해 인도 정부는 2026년까지 주택 부문의 옥상 태양광 발전 설치 용량을 약 4GW까지 늘릴 계획입니다. 따라서 정부는 목표를 달성하기 위해 주택 부문이 태양에너지를 도입하기 위한 다양한 조치를 시작했습니다.
- 신재생 에너지 발전부(MNRE)의 계통연계 지붕상 태양광 발전 프로그램은 지붕상 시스템의 최초 발전 용량 3kW에 대해 40%, 상한 10kW까지 20%의 보조금을 제공하는 것을 목적으로 하고 있습니다.
- 제도와는 별도로 인도에서는 전기 요금이 상승하고 있기 때문에 주택 부문의 옥상 태양광 발전 시장은 매력적이라고 생각됩니다. 인도의 평균 전기 요금은 단위당 6-9루피 정도이며, 전력 수요 증가에 따라 상승할 가능성이 높습니다. 2023년 상반기에는 아삼주, 카르나타카주, 마할라슈트라주, 타밀 나두주 등 인도 각 주가 주택용 전력요금 인상을 실시했습니다. 따라서 사람들은 전기 요금을 줄이거나 0으로 만들기 위해 집에 옥상 태양광 발전 시스템을 도입할 가능성이 높습니다.
- 중국 정부는 2023년 말 정당과 정부 기관 건물의 옥상 50%, 학교와 병원 등 공공시설의 40%, 공업 및 상업지역의 30%, 농촌 가정의 20%를 태양전지판으로 커버할 것을 제안하고 있습니다. 31성 676현이 이 계획에 등록하고 있습니다.
- 이러한 요인으로 인해 주택용 태양에너지 수요는 예측기간 동안 아시아태평양에서 증가할 것으로 예상됩니다.
주택용 태양에너지 산업 개요
주택용 태양에너지 시장은 세분화되어 있습니다. 이 시장의 주요 기업(순부동)에는 Trina Solar, Canadian Solar Inc., JinkoSolar Holding, Hanwha Q Cells, Tesla Inc. 등이 있습니다.
기타 혜택
- 엑셀 형식 시장 예측(ME) 시트
- 3개월간의 애널리스트 서포트
목차
제1장 서론
- 조사 범위
- 시장의 정의
- 조사의 전제
제2장 주요 요약
제3장 조사 방법
제4장 시장 개요
- 서문
- 세계의 신재생 에너지 믹스(2023년)
- 주택용 태양에너지의 설치 용량 및 예측(-2029년)
- 최근 동향 및 개발
- 정부의 규제 및 시책
- 시장 역학
- 성장 촉진요인
- 유리한 정부 시책
- 태양에너지 시스템의 비용 절감
- 억제요인
- 아프리카와 같은 지역에서의 주택용 태양광 발전 시스템의 통합의 어려움과 결부된 대출 옵션의 부족
- 성장 촉진요인
- 공급망 분석
- Porter's Five Forces 분석
- 공급기업의 협상력
- 소비자의 협상력
- 신규 진입업자의 위협
- 대체품의 위협
- 경쟁 기업간 경쟁 관계의 강도
제5장 시장 세분화 : 지역별
- 북미
- 미국
- 캐나다
- 기타 북미
- 유럽
- 독일
- 프랑스
- 영국
- 이탈리아
- 스페인
- 러시아
- 노르딕
- 터키
- 기타 유럽
- 아시아태평양
- 중국
- 인도
- 일본
- 호주
- 말레이시아
- 태국
- 인도네시아
- 베트남
- 기타 아시아태평양
- 남미
- 브라질
- 아르헨티나
- 칠레
- 콜롬비아
- 기타 남미
- 중동 및 아프리카
- 사우디아라비아
- 아랍에미리트(UAE)
- 남아프리카
- 카타르
- 나이지리아
- 이집트
- 기타 중동 및 아프리카
제6장 경쟁 구도
- M&A, 합작사업, 제휴 및 협정
- 주요 기업의 전략
- 기업 프로파일
- Trina Solar Co. Ltd
- Yingli Green Energy Holding Company Limited
- Canadian Solar Inc.
- JinkoSolar Holding Co. Ltd
- JA Solar Holdings Co. Ltd
- Sharp Corporation
- ReneSola Ltd
- Hanwha Q Cells Co. Ltd
- SunPower Corporation
- Tesla Inc.
- List of Other Prominent Players
- 시장 랭킹 및 공유(%) 분석
제7장 시장 기회 및 향후 동향
- 세계의 총 에너지 믹스에서 신재생 에너지 비율을 높이기 위한 야심적 목표
The Residential Solar Energy Market size is estimated at 147.98 gigawatt in 2025, and is expected to reach 204.56 gigawatt by 2030, at a CAGR of 6.69% during the forecast period (2025-2030).
Key Highlights
- Over the medium term, factors such as favorable government policies, increasing investments in upcoming rooftop solar projects, and the reduced cost of solar energy, which has led to increased adoption of solar energy, are expected to drive the market during the forecast period.
- On the other hand, the lack of financing options and the difficulties in integrating residential solar PV systems in regions like Africa are expected to restrain the market's growth.
- However, ambitious targets are being undertaken to increase the renewable share in their energy mix. Governments across these nations also plan to increase the renewable energy share by deploying residential solar PV systems in the coming years. This factor, in turn, is expected to act as an opportunity for residential solar energy manufacturers and suppliers during the forecast period.
- Asia-Pacific is expected to be the fastest-growing market during the forecast period due to the rising energy demand. This growth is attributed to increasing investments and supportive government policies in Asia-Pacific countries, including India, China, and Australia.
Residential Solar Energy Market Trends
Increasing Rooftop Solar Installations to Drive the Market
- The increasing adoption of solar PV systems in the residential sector is primarily driven by expected savings in electricity costs, the need for an alternative source of electricity, and the desire to mitigate climate change risk.
- During the forecast period, the demand for rooftop solar PV is expected to increase due to decreasing solar PV costs, supportive government policies for residential solar PV, FIT programs and incentives, and various solar energy targets.
- The cost of electricity for residential rooftop solar PV applications has rapidly declined in recent years. The falling price has resulted in a massive increase in the global residential PV capacity, and many countries are increasing their residential rooftop targets.
- The Solar Energy Industry Association (SEIA) statistics show that, in 2023, the cumulative residential solar PV installed capacity in the United States accounted for about 36.268 GW. The total installed capacity grew by 23% compared to the previous year. The hike in capacity is mainly due to high household electricity bills and power outages.
- A European Joint Research Centre analysis shows that EU rooftop PV could produce 680 TWh of solar electricity annually.
- In April 2024, the German parliament approved a new series of measures to support solar PV development in the country. Rooftop solar PV installations of 40 kW are made eligible for feed-in tariffs that will be EUR 1.5c/kWh higher than current tariff levels. In addition, the new law increases the limit for ground-mounted solar projects from 20 MW to 50 MW in tenders for large-scale installations. Finally, it will become easier for households to deploy PV balcony systems and smart energy communities.
- All such factors are expected to drive the demand for residential solar energy over the forecast period.
Asia-Pacific to Dominate the Market
- Asia-Pacific accounted for more than 30% of the global residential solar PV market. It is expected to continue its dominance during the forecast period.
- India's solar PV installed capacity increased significantly from 63.048 GW in 2022 to 72.767 GW in 2023, and the demand for power is expected to increase further in the coming years.
- To cater to the rising power demand and meet its renewable energy target of 500 GW by 2030, the Indian government plans to increase the installed capacity of rooftop solar energy in the residential sector to around 4 GW by 2026. Thus, the government has initiated various policies for the residential sector to adopt solar energy to achieve the target.
- The Ministry of New and Renewable Energy (MNRE)'s grid-connected rooftop solar program aims to offer a 40% subsidy for the first 3 kW of generation capacity in rooftop systems and a 20% subsidy up to a 10 kW ceiling.
- Apart from schemes, the rooftop solar energy market for the residential sector seems appealing in India due to its increasing electricity tariff. On average, the electricity tariff in India is around INR 6-9 per unit, which is likely to increase due to a rise in electricity demand. In H1 2023, Indian states like Assam, Karnataka, Maharashtra, and Tamil Nadu raised their tariff for residential users. Hence, people are likely to adopt rooftop solar PV systems in their homes to reduce or make zero electricity bills.
- At the end of 2023, the Chinese government proposed to cover 50% of rooftop space with solar panels on party and government buildings, 40% of schools, hospitals, and other public facilities, 30% of industrial and commercial areas, and 20% of rural households. A total of 676 counties from 31 provinces have registered for the scheme.
- Owing to such factors, the demand for residential solar energy is expected to increase in Asia-Pacific over the forecast period.
Residential Solar Energy Industry Overview
The residential solar energy market is fragmented. Some of the major players in the market (in no particular order) include Trina Solar Co. Ltd, Canadian Solar Inc., JinkoSolar Holding Co. Ltd, Hanwha Q Cells Co. Ltd, and Tesla Inc.
Additional Benefits:
- The market estimate (ME) sheet in Excel format
- 3 months of analyst support
TABLE OF CONTENTS
1 INTRODUCTION
- 1.1 Scope of the Study
- 1.2 Market Definition
- 1.3 Study Assumptions
2 EXECUTIVE SUMMARY
3 RESEARCH METHODOLOGY
4 MARKET OVERVIEW
- 4.1 Introduction
- 4.2 Renewable Energy Mix, Global, 2023
- 4.3 Residential Solar Energy Installed Capacity and Forecast, till 2029
- 4.4 Recent Trends and Developments
- 4.5 Government Policies and Regulations
- 4.6 Market Dynamics
- 4.6.1 Drivers
- 4.6.1.1 Favorable Government Policies
- 4.6.1.2 Reduced Cost of Solar Energy Systems
- 4.6.2 Restraints
- 4.6.2.1 Lack of Financing Options Coupled with Difficulties in Integrating Residential Solar PV Systems in Regions like Africa
- 4.6.1 Drivers
- 4.7 Supply Chain Analysis
- 4.8 Porter's Five Forces Analysis
- 4.8.1 Bargaining Power of Suppliers
- 4.8.2 Bargaining Power of Consumers
- 4.8.3 Threat of New Entrants
- 4.8.4 Threat of Substitutes Products and Services
- 4.8.5 Intensity of Competitive Rivalry
5 MARKET SEGMENTATION - By Geography
- 5.1 North America
- 5.1.1 United States
- 5.1.2 Canada
- 5.1.3 Rest of North America
- 5.2 Europe
- 5.2.1 Germany
- 5.2.2 France
- 5.2.3 United Kingdom
- 5.2.4 Italy
- 5.2.5 Spain
- 5.2.6 Russia
- 5.2.7 NORDIC
- 5.2.8 Turkey
- 5.2.9 Rest of Europe
- 5.3 Asia-Pacific
- 5.3.1 China
- 5.3.2 India
- 5.3.3 Japan
- 5.3.4 Australia
- 5.3.5 Malaysia
- 5.3.6 Thailand
- 5.3.7 Indonesia
- 5.3.8 Vietnam
- 5.3.9 Rest of Asia-Pacific
- 5.4 South America
- 5.4.1 Brazil
- 5.4.2 Argentina
- 5.4.3 Chile
- 5.4.4 Colombia
- 5.4.5 Rest of South America
- 5.5 Middle East and Africa
- 5.5.1 Saudi Arabia
- 5.5.2 United Arab Emirates
- 5.5.3 South Africa
- 5.5.4 Qatar
- 5.5.5 Nigeria
- 5.5.6 Egypt
- 5.5.7 Rest of Middle East and Africa
6 COMPETITIVE LANDSCAPE
- 6.1 Mergers and Acquisitions, Joint Ventures, Collaborations, and Agreements
- 6.2 Strategies Adopted by Leading Players
- 6.3 Company Profiles
- 6.3.1 Trina Solar Co. Ltd
- 6.3.2 Yingli Green Energy Holding Company Limited
- 6.3.3 Canadian Solar Inc.
- 6.3.4 JinkoSolar Holding Co. Ltd
- 6.3.5 JA Solar Holdings Co. Ltd
- 6.3.6 Sharp Corporation
- 6.3.7 ReneSola Ltd
- 6.3.8 Hanwha Q Cells Co. Ltd
- 6.3.9 SunPower Corporation
- 6.3.10 Tesla Inc.
- 6.4 List of Other Prominent Players
- 6.5 Market Ranking/Share (%) Analysis
7 MARKET OPPORTUNITIES AND FUTURE TRENDS
- 7.1 Ambitious Targets to Increase the Renewable Share in Total Energy Mix Worldwide
