|
시장보고서
상품코드
1639456
통신 애널리틱스 - 시장 점유율 분석, 산업 동향 및 통계, 성장 예측(2025-2030년)Telecom Analytics - Market Share Analysis, Industry Trends & Statistics, Growth Forecasts (2025 - 2030) |
||||||
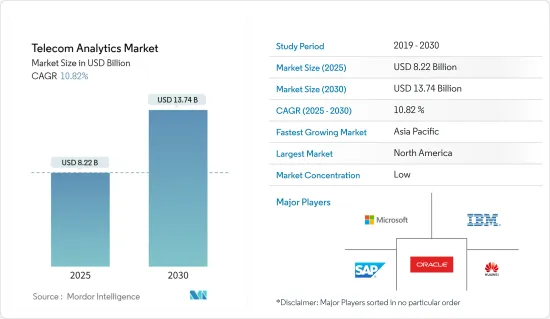
통신 애널리틱스 시장 규모는 2025년에 82억 2,000만 달러로 추정됩니다. 예측 기간(2025-2030년)의 CAGR은 10.82%로, 2030년에는 137억 4,000만 달러에 달할 것으로 예상됩니다.

일반적으로 기존 사업자보다 저렴하고 유리한 계약을 제공하는 신규 진입사업자의 출현으로 경쟁이 격화되고 있기 때문에 해약을 줄일 필요성은 그 어느 때보다 높아지고 있습니다. 게다가 비구조화된 데이터와 구조화된 데이터의 양이 증가함에 따라 고객의 행동과 선호도에 대한 깊은 인사이트를 얻기 위한 효과적인 분석이 필요합니다. 실시간 서비스 이용 패턴이 이러한 기업이 분석을 도입하는 동기가 되고 있습니다.
주요 하이라이트
- 전기통신 분석 시장은 통신 산업의 복잡한 요구를 충족하는 다양한 정교한 비즈니스 인텔리전스(BI) 기술을 결합합니다. 여기에는 판매 개발, 해지 및 위장 감소, 리스크 관리 강화, 운영 비용 절감 등이 포함됩니다. 따라서 통신 사업자는 관련 데이터만 보다 빠르고 간편하게 처리할 수 있는 고급 분석 주도형 데이터 솔루션을 채택하고 데이터 마이닝 및 예측 분석과 같은 네트워크 분석을 사용하여 적시에 정확한 인사이트를 받을 수 있도록 지원합니다.
- 또한 통신산업은 새로운 시대를 맞이해 소비자가 아니라 기업이라는 새로운 고객 포커스, 5G나 클라우드의 신기술, 분석과 데이터 과학을 활용한 민첩하고 신속한 서비스를 제공하기 위한 근본적으로 새로운 일하는 방법에 대한 요구가 높아지고 있습니다. 2023년 1월 현재 GSA 보고서에 따르면 전 세계적으로 243개의 상용 5G가 전개되고 있으며, 112개 사업자가 독립형 5G에 투자하고 있습니다. 이 상용화는 새로운 B2B 및 B2B2X 용도으로 이어집니다. 이때 통신 사업자는 단순히 용량을 확장하고 서비스 수준과 리소스를 유연하게 변경할 뿐만 아니라 이러한 고객에게 서비스를 확실히 제공할 수 있어야 합니다.
- 예를 들어, 2023년 2월 Oracle Corporation은 Network Analytics 포트폴리오의 두 번째 애플리케이션인 Oracle Network Analytics Data Director를 출시한다고 발표했습니다. 이 애플리케이션을 통해 오퍼레이터는 Oracle이 제공하지 않는 네트워크 기능에 대해서도 5G 코어를 기존 운영 툴에 유연하게 통합할 수 있습니다. Oracle Communications Network Analytics Data Director는 기본적으로 SCP(Service Communication Proxy) 및 NRF(Network Repository Function)와 같은 Oracle 5G 네트워크 기능을 포함한 다양한 소스에서 트래픽을 수집하여 가입자 용도에 전달합니다.
- 전 세계적으로 모바일 사용자가 많기 때문에 통신 애널리틱스 서비스는 클라우드에서 호스팅될 것으로 예상됩니다. 따라서 클라우드 호스팅은 소비자 기반의 지속적인 증가로 더욱 확대될 것으로 보입니다. 따라서 통신 서비스 제공업체(CSP)에 의한 이 기술의 채용은 현저하게 증가하고 있습니다.
- 통신 애널리틱스는 통신 서비스 제공업체(CSP)의 생산성 향상, 고객 만족도 향상, 수익 확대에 기여하고 있습니다. 예를 들어, 노키아의 노키아 AVA 분석과 인사이트는 많은 주요 통신 기업 시장 측정 제품을 재구성하는 데 도움이 되었습니다. Tier 1 서비스 제공업체인 POST Luxembourg는 Nokia AVA를 사용하여 가입자에게 영향을 미치기 전에 네트워크 문제의 97%를 사전에 확인하고 해결했습니다. 또한 Hutchison 3 Indonesia는 네트워크의 스펙트럼 효율을 17% 향상시켰습니다. 또한 Vodafone은 이상을 감지하고 근본 원인 분석을 자동화하는 데 도움이되는 벨 랩의 머신러닝 알고리즘을 사용하여 네트워크 문제를 최대 30% 신속하게 해결합니다.
- 데이터 인프라를 개선하면 통신 산업에서 분석을 이용할 수 있게 되고, 데이터가 풍부한 통신 사업자는 비즈니스를 변화시키기 위한 의미 있는 인텔리전스를 얻을 수 있습니다. 통신 애널리틱스를 사용하면 지출 및 계획과 관련된 고객 데이터와 인터넷 사용 및 네트워크 활동 시간과 같은 행동 데이터를 통합하고 분석할 수 있습니다.
- 스마트 디바이스의 보급과 IP 네트워크의 이용 증가에 따라 통신 산업에서는 통신 사기가 재연되고 있습니다. 공격은 어디서나 오기 때문에 사기는 통신 시장에서 가장 골치 아픈 문제로 부상하고 있습니다. 이 때문에 당국은 통신 분야의 안전을 위해 규제를 시작하고 있습니다. 인도에서는 Telecom Regulatory Authority of India(인도통신규제국)가 음성 품질 기준을 충족하지 못하는 경우 엄격한 규칙과 처벌을 마련하고 있습니다. 이에 따라 이 나라에서는 네트워크 분석 솔루션 수요가 높아질 것으로 예상됩니다.
- COVID-19 팬데믹이 유행하는 동안 통신 분석의 이용은 전반적으로 확대되었습니다. 재택 근무가 가능해지면서 광대역에의 압력 증가, 온라인 스트리밍 플랫폼의 상승, 내부 프로세스의 가시성 향상, 통신 애널리틱스에 의한 필수적인 운영 등의 요인에 의해 통신 애널리틱스 수요는 봉쇄 기간 동안 확대되었습니다.
통신 애널리틱스 시장 동향
해지 감축 요구의 급증
- 통신 부문에서 취소는 미리 정해진 기간 내에 서비스 제공업체를 변경하는 가입자의 비율로 정의할 수 있습니다. 이 비율이 해마다 증가하면 기업 브랜드가 손상되기 때문에 기업은 해지율의 저하에 주력하고 있습니다. 이것은 기업의 미래 판매 및 비즈니스에 나쁜 영향을 미칩니다. krtrimaiq에 따르면 미국에서 가장 높은 해약률은 뉴저지와 캘리포니아입니다.
- 통신 애널리틱스를 사용하여 해지율을 15% 줄였습니다. 통신 서비스 제공업체는 수익 손실을 방지하고 고객 서비스를 강화하고 마케팅 및 판매 비용을 절약하기 위해 고객 해지 분석 솔루션을 요구합니다. 가입자 분석 솔루션을 도입함으로써 가입자는 가입자의 이용 데이터로부터 폭넓게 배울 수 있으며, 가입자의 행동 패턴을 파악하고 고객 경험을 향상시킬 수 있습니다. 또한, 통신 사업자는 교차 셀과 업셀을 수행할 수 있습니다.
- 통신 애널리틱스는 텔레콤 기업에 고객 개요를 제공하고 가장 수익성이 높은 고객, 가장 수익성이 낮은 고객 등을 파악할 수 있기 때문에 매우 중요합니다. 동시에 고객 관계(구매, 업데이트, 문제)의 진화를 추적하고 각 고객이 고객 여정의 어느 단계에 있는지 확인할 수 있습니다.
- 또한 통신 애널리틱스의 장점 중 하나는 고객 관리에서 모든 고객 데이터가 하나의 시스템에 안전하게 저장되고 언제든지 액세스할 수 있다는 것입니다. 나중에 분석을 위해 각 소비자의 세부 사항을 수집하는 일관된 방법을 갖는 것이 중요하기 때문입니다.
- 또한 Bharti Airtel, Reliance Jio, Vodafone 등의 휴대전화 회사는 인공지능을 사용하여 고객 서비스 터치포인트의 콜센터와 네트워크 제공을 통해 고객 경험을 향상시키고 가입자 정착률을 향상시키고 취소를 줄이는 방법을 찾으려고 합니다.
- 또한, 이 시장의 각 회사는 태도를 이해하기 위한 머신러닝을 통합한 통신 분석 솔루션을 제공하고 있으며, 통신 사업자가 위험한 가입자와 현재와 미래의 해지의 원인을 확인할 수 있도록 하고 있습니다. 그 결과, 사업자는 이반을 줄이기 위한 마케팅과 고객 서비스 시책을 전개하고 있습니다. 또한 데이터 플랜을 업그레이드할 준비가 된 가입자와 새로운 서비스 잠재 고객을 찾을 수 있습니다. 통신 부문에서는 해석 분석을 통해 고객이 이동통신사 및 서비스 제공업체를 변경할 시기를 예측할 수 있습니다.
- 통신 부문의 고객은 다양한 서비스 제공업체 중에서 선택할 수 있으며 운영자 간에 적극적으로 환승할 수 있습니다. 이러한 경쟁이 심한 시장에서 전기통신 섹터의 연간 평균 해약률은 15-25%입니다. 기존 고객을 유지하는 것보다 신규 고객을 획득하는 것이 5-10배나 비용이 들기 때문에 고객 유지의 중요성은 이제 고객 획득을 웃돌고 있습니다. 수익성이 높은 소비자를 유지하는 것은 많은 기존 사업자에게 가장 큰 사업 목표입니다. 이동통신사는 고객의 이탈을 줄이기 위해 가장 이탈할 가능성이 높은 소비자를 식별해야 합니다.
- Vodafone의 2021/2022 회계 연도의 1분기에서 독일 선불 해지율은 11.3%였습니다. Vodafone의 선불 고객의 해지율이 가장 높은 것은 영국(영국)이며 해지율은 91.9%입니다. 이러한 지역에서는 해약률이 높기 때문에 해약률 삭감의 요구가 크게 높아지고 있습니다.
북미가 가장 큰 시장 점유율을 차지
- 북미는 주로 비즈니스 인텔리전스 솔루션에 대한 지출이 많기 때문에 통신 분석 시장에서 큰 시장 점유율을 차지할 것으로 예상됩니다. 또한 이 지역의 통신은 고도로 발달하고 있어 통신사업자 간의 경쟁도 치열하기 때문에 이 지역의 통신 분석 시장은 더욱 활성화될 것으로 예상됩니다.
- 고객 지원에 사용되는 IT 인프라 및 기술의 지속적인 발전, 수많은 시장 공급업체의 존재, 최신 고객 경험 및 헬프데스크 소프트웨어 관리를 위한 숙련된 기술 전문 지식의 활용성이 이 지역에서의 통신 애널리틱스 시장의 성장에 기여하고 있습니다. 또한, 북미 기업은 전략적 M&A를 적극적으로 실시했습니다. 예를 들어, 미국의 기술 선도적인 IBM은 클라우드 서비스를 강화하기 위해 Sanovi Technologies를 인수했습니다. Sanovi는 기업 데이터센터와 클라우드 인프라를 위한 클라우드 마이그레이션, 비즈니스 지속성, 하이브리드 클라우드 복구 소프트웨어를 제공합니다.
- 게다가 BYOD 시책은 아마도 미국에서 태블릿과 스마트폰의 인기가 높아지는 것에 힘쓰고 있습니다. 예를 들어 미국 인구조사국과 소비자기술협회는 2022년 1월 미국에서 스마트폰 매출이 2021년 730억 달러에서 2022년 747억 달러로 증가할 것으로 예측했습니다. 이는 수많은 부서나 기업에서 IoT가 빠르게 채택됨에 따라 더욱 증가할 것으로 예상됩니다. 따라서 스마트폰 사용자 증가에 따라 사기와 사기의 확률도 증가하고 있으며, 이로써 이 통신 분석 시장의 성장을 비약적으로 촉진하고 있습니다.
- 북미에는 세계 최대의 휴대전화 서비스 제공업체가 몇 개 있으며 소비자의 피드백에 크게 의존하고 있습니다. 따라서 이 지역의 CSP는 통신 애널리틱스를 선택하여 고품질의 서비스를 고효율로 제공할 수 있습니다. 예를 들어, 미국 통신 제공업체인 Verizon은 사내에 다양한 분석 솔루션과 AI 그룹을 배포합니다. 한편, 데이터 과학 및 인지 인텔리전스 그룹은 Verizon의 고객 대응에 분석 및 인지 기술을 도입하는 데 주력하고 있습니다. 다른 공급업체들도 비슷한 노력을 기울이고 있으며, 이 지역의 통신 분석 솔루션에 대한 수요를 높일 것으로 예상됩니다.
- 또한, 이 나라에서의 인터넷 보급을 지원하기 위한 정부의 이니셔티브와 투자 증가는 통신 분석 시장 수요를 높일 것으로 예상됩니다. 예를 들어, 미국 농무부(USDA)는 2022년 7월 11개 기업과 3만 1,000명의 농촌 주민들에게 고속 인터넷 접속을 제공하기 위해 4억 100만 달러를 투자한다고 발표했습니다. 이것은 저렴한 고속 인터넷과 지방 인프라 투자에 대한 미국 정부의 헌신의 일환입니다.
- Stormforge가 2021년 4월에 발표한 조사 결과에서는 북미 응답자의 18%가 자사의 클라우드 컴퓨팅에 매월 10만 달러에서 25만 달러를 소비하고 있다고 응답하고 있습니다. 또한 응답자의 32%는 향후 12개월 동안 자사의 클라우드 지출이 크게 확대될 것으로 예측하고 있으며, 44%는 동기간에 클라우드 지출이 약간 증가할 것으로 예측했습니다. 게다가 2022년에 실시된 Statista Global Consumer Survey의 조사에 따르면 응답자의 44%가 파일과 이미지에 온라인 스토리지를 사용하고 응답자의 40%가 오피스 문서 작성에 온라인 용도을 사용 있다는 것이 밝혀졌습니다. 이러한 클라우드 서비스에 대한 고액 지출의 동향은 이 지역의 통신 분석 시장의 성장을 가속할 것으로 예상됩니다.
통신 애널리틱스 산업 개요
통신 애널리틱스 시장은 매우 경쟁이 치열하고 현재 많은 진출 기업으로 구성되어 있기 때문에 세분화된 단계로 전환하고 있습니다. 세계의 통신 애널리틱스 시장의 주요 기업 몇사는 제품의 진보를 가져오기 위해 끊임없는 노력을 계속하고 있습니다. 저명한 기업 몇사는 시장에서의 지위를 굳히기 위해 제휴를 맺거나 신흥국 시장에서의 거점을 확대하고 있습니다. 주요 기업은 Huawei Technologies, SAP SE, Oracle Corp.입니다.
- 2023년 3월 IBM Corporation은 Telecom Egypt(TE)에 지능형 자동화 소프트웨어를 제공하고 모바일, 고정 및 코어 네트워크에 있는 모든 운영 지원 시스템(OSS)을 포괄하는 솔루션을 도입할 것이라고 발표했습니다. Telecom Egypt은 RedHat OpenShift에 배포된 IBM Cloud Pak for Watson AIOps를 채택하여 IBM Robotic Process Automation(RPA) 솔루션을 구현합니다. 이 솔루션을 통해 TE는 전체 IT 환경을 조감할 수 있어 기술 혁신을 가속화하고 운영 비용을 절감하며 네트워크 관련 인시던트 문제를 해결하고 해결하는 데 걸리는 시간을 최소화할 수 있습니다.
- 2023년 2월 Bharti Airtel은 NVIDIA와 협력하여 AI 기반 솔루션을 구축할 것이라고 발표했습니다. 이 회사는 컨택 센터에 걸려오는 전화의 84%에 자동 음성 인식 알고리즘을 적용하고 있습니다. 이를 통해 회사는 소비자와 상호 작용할 때 상담원의 개선 사항을 파악하고 더 나은 고객 경험을 제공할 수 있습니다. 이 회사는 NVIDIANeMo 대화 AI 툴킷을 활용하여 이 특수 음성 용도과 NVIDIA AI 기업 소프트웨어 제품군을 개발했습니다.
기타 혜택
- 엑셀 형식 시장 예측(ME) 시트
- 3개월간의 애널리스트 서포트
목차
제1장 서론
- 조사의 전제조건과 시장 정의
- 조사 범위
제2장 조사 방법
제3장 주요 요약
제4장 시장 인사이트
- 시장 개요
- 밸류체인 분석
- 산업의 매력 - Porter's Five Forces 분석
- 신규 진입업자의 위협
- 구매자의 협상력
- 공급기업의 협상력
- 대체품의 위협
- 경쟁 기업 간 경쟁 관계의 강도
- COVID-19가 시장에 미치는 영향
- 시장 역학
- 해지 감소에 대한 필요성 급증
- 사기 활동에 대한 취약성 증대
- 시장 성장 억제요인
- 통신 사업자의 인식 부족
제5장 시장 세분화
- 용도별
- 고객분석
- 네트워크 분석
- 시장 분석
- 가격 분석
- 서비스 분석
- 기타
- 배포 모드별
- 클라우드
- 온프레미스
- 지역별
- 북미
- 미국
- 캐나다
- 유럽
- 영국
- 독일
- 프랑스
- 기타 유럽
- 아시아태평양
- 중국
- 인도
- 일본
- 기타 아시아태평양
- 기타
- 라틴아메리카
- 중동 및 아프리카
- 북미
제6장 경쟁 구도
- 기업 프로파일
- Dell Inc.
- Oracle Corporation
- IBM Corporation
- SAP SE
- Microsoft Corporation
- InfoFaces Inc.
- Accenture PLC
- Huawei Technologies Co. Ltd
- Teradata Corporation
- Wipro Limited
- Nokia Corporation
제7장 투자 분석
제8장 시장 기회와 앞으로의 동향
KTH 25.02.07The Telecom Analytics Market size is estimated at USD 8.22 billion in 2025, and is expected to reach USD 13.74 billion by 2030, at a CAGR of 10.82% during the forecast period (2025-2030).
The need for reducing churn is more important than ever, as the competition is increasing with the incidence of new entrants, who provide lucrative deals that are generally inexpensive than the incumbents. In addition, the increasing amount of unstructured and structured data requires effective analysis to get more profound insights into customer behavior and preferences. Real-time service usage patterns motivate these companies to adopt analytics.
Key Highlights
- The telecom analytics market combines various sophisticated business intelligence (BI) technologies that satisfy the complex demands of the telecom industry. These include developing sales, reducing churn and deception, enhancing risk management, and decreasing operational costs. Hence, telecom organizations are adopting advanced analytics-driven data solutions for faster and simpler processing of only relevant data, helping them achieve timely and accurate insights using network analytics such as data mining and predictive analytics.
- Moreover, the telecommunications industry is entering a new era and increasing need for a new customer focus - enterprises instead of consumers, new technologies in 5G and the cloud, and fundamentally new ways of working to deliver agile, faster services using analytics and data science. As of January 2023, the GSA reports that there are 243 commercial 5G deployments worldwide, with 112 operators investing in standalone 5G. This commercialization will lead to new B2B and B2B2X applications. In doing so, operators need to ensure that they can serve these customers beyond simply expanding capacity or flexibly changing service levels and resources.
- For instance, in February 2023, Oracle Corporation announced to release the second application in our Network Analytics portfolio, the Oracle Network Analytics Data Director which enables operators to flexibly integrate their 5G core into their existing operational tools, even for network functions that are not provided by Oracle. Oracle Communications Network Analytics Data Director basically ingests traffic from various sources such as Oracle 5G network functions such as Service Communication Proxy (SCP) and Network Repository Function (NRF) and distributes it to subscriber applications.Both incoming and outgoing data are encrypted, allowing users to guarantee end-to-end data transfer.
- Telecom analytics service is expected to be hosted on the cloud because of the large number of mobile users worldwide. Hence, cloud hosting is also set to expand further due to the continuous rise in the consumer base. Thus, the adoption of this technology by communications service providers (CSPs) is growing significantly.
- Telecom analytics has been helping communications service providers (CSPs) to boost productivity, enhance customer satisfaction, and grow revenues. For instance, Nokia Corporation's Nokia AVA analytics and insights helped many leading telecom companies re-engineer their market measurement products. POST Luxembourg, a Tier-1 service provider, used Nokia AVA to proactively identify and solve 97% of network issues before they could affect subscribers. Moreover, Hutchison 3 Indonesia improved the spectral efficiency of its network by 17%. Additionally, Vodafone solves network issues up to 30% faster by using Bell Labs machine learning algorithms that detect anomalies and help automate root cause analysis.
- The improvements in data infrastructure have enabled the use of analytics in the telecom industry, owing to which data-rich carriers can yield meaningful intelligence to transform their businesses. Telecom analytics allows pages to merge and analyze customer data related to spending and plans and behaviour data like internet usage or duration of networking activities.
- Due to the proliferation of smart devices and the increasing use of IP networks, the telecom industry is experiencing a resurgence of communications fraud. As attacks can come from any source, scam has emerged as the most troublesome problem for the telecom market. Due to this, authorities are initiating regulations for the telecoms sector safety. In India, the Telecom Regulatory Authority of India has issued stringent rules and penalties for failing to meet the voice quality benchmark. It is expected to increase the demand for network analytics solutions in the country.
- During the COVID-19 pandemic outbreak, the overall utilization of telecom analytics has expanded. Due to the factors like the increased pressure on broadband caused by the ability to work from home, the rise in online streaming platforms, improved visibility of internal processes, and essential operations by telecom analytics, the demand for telecom analytics has grown during the active lockdown period.
Telecom Analytics Market Trends
The surge in need for churn reduction
- In the context of the telecom sector, churn can be defined as the percentage of subscribers who switch service providers within a predetermined time frame. Companies are putting a lot of effort into lowering churn since if the percentage increases year over year, it damages the company's brand. This badly impacts future sales and business for the corporation. According to krtrimaiq, New Jersey and California have the highest churn percentage in the US.
- By using telecom analytics, it cut churn by 15%. Telecom service providers demand customer churn analytics solutions to prevent revenue loss, enhance customer service, and save marketing and sales expenses. By implementing telecom analytics solutions, carriers can learn extensively from subscriber usage data to identify subscriber behavior patterns and enhance customer experiences. Additionally, it gives telecom providers the ability to cross-sell and up-sell.
- Telecom analytics is very important as it gives telecom companies an overview of their customers and allows them to identify the most profitable, least profitable, etc. At the same time, it also allows tracking the evolution of customer relationships (purchases, renewals, issues) and seeing where each customer is in the customer journey.
- Furthermore, one of the benefits of telecom analytics is in customer management all customer data is securely stored in one system and can be accessed at any time. As it's important to have a consistent way to collect details about each consumer for later analysis.
- Moreover, mobile phone companies such as Bharti Airtel, Reliance Jio, and Vodafone are using artificial intelligence to enhance customer experience through their customer service touchpoints call centers, and network offerings and try to find ways to improve subscriber stickiness and reduce churn.
- Additionally, companies in the market are providing telecom analytics solutions laced with machine learning to understand attitudes, enabling carriers to identify at-risk subscribers or the causes of current and prospective churn. As a result, businesses are developing marketing or customer service initiatives to reduce turnover. Additionally, it can spot subscribers ready for data plan upgrades and prospective customers for new services. In the telecom sector, churn analytics also makes it possible to predict when customers will likely transfer carriers or service providers.
- Customers in the telecom sector have a variety of service providers to select from, and they can actively switch between operators. The telecoms sector has an average annual churn rate of 15 to 25 percent in this fiercely competitive market. Customer retention has now surpassed customer acquisition in importance since it is 5-10 times more expensive to gain new customers than to keep existing ones. Retaining highly profitable consumers is the top business objective for many established operators. Telecom businesses must identify the consumers who are most likely to leave to reduce customer turnover.
- In the first quarter of Vodafone's financial year 2021/2022, the prepaid churn rate in Germany was 11.3 percent. Vodafone has the highest churn rate among its prepaying customers in the United Kingdom (UK), where the churn rate is 91.9 percent. Since the churn rate is higher in these regions, the need for churn reduction is growing significantly.
North America to Hold the Largest Market Share
- North America is anticipated to occupy a significant market share in the telecom analytics market, primarily owing to the region's high expenditure on business intelligence solutions. Besides, telecommunications in the region is highly developed with intense competition among the communication providers, which is expected further to boost the region's telecom analytics market.
- The continuous advancements in IT infrastructure and technology used for customer support, the presence of a large number of market vendors, and the accessibility of proficient technical expertise in managing the modern customer experience and helpdesk software contribute to the telecom analytics market growth in the region. Furthermore, North American companies actively make strategic mergers and acquisitions. For instance, American technology giant IBM acquired Sanovi Technologies to bolster its cloud offerings. Sanovi provides cloud migration, business continuity, and hybrid cloud recovery software for enterprise data centres and cloud infrastructure.
- Moreover, the BYOD policy is probably driven by the growing popularity of tablets and smartphones in the US. For instance, the US Census Bureau and Consumer Technology Association predicted in January 2022 that sales of smartphones in the US would rise from USD 73 billion in 2021 to USD 74.7 billion in 2022. This is anticipated to increase further with the quick adoption of IoT across numerous sectors and companies. Hence, with the rise of smartphone users, the probability of fraud or scams is also increasing, which in turn is fueling the growth of this telecom analytics market exponentially.
- North America has a few of the world's largest cellular service providers, who rely enormously on consumer feedback. Thus, by opting for telecom analytics, CSPs in the region can offer better quality service at high efficiency. For instance, Verizon, a telecommunications provider in the United States, has deployed various analytic solutions and AI groups around the company. On the other hand, the Data Science and Cognitive Intelligence group focus on implementing analytics and cognitive technology in Verizon's customer interactions. The increased focus of other vendors in order to follow the same would boost the demand for telecom analytics solutions in the region.
- Furthermore, the rising government initiative and investment to support the internet penetration in the country will increase the demand for telecom analytics market. For instance, in July 2022, the United States Department of Agriculture (USDA) has announced a USD 401 million investment to bring high-speed Internet access to businesses and 31,000 rural residents in 11 states. This is part of the US government's commitment to investing in affordable high-speed internet and rural infrastructure.
- In a research study released by Stormforge in April 2021, 18% of respondents from North America claim that their firm spends between $100,000 and $250,000 per month on cloud computing. In addition, 32% of respondents predict that their organization's cloud spending will expand significantly over the following 12 months, while 44% predict a slight increase in cloud spending over the same period. Additionally, as per the research study by Statista Global Consumer Survey conducted in the United States in 2022, it has been found that 44 percent of respondents use online storage for files and pictures, while 40 percent of respondents use online applications to create office documents. This trend of high spending on cloud services will drive the growth of the telecom analytics market in the region.
Telecom Analytics Industry Overview
The Telecom Analytics Market is very competitive and moving towards the fragmented stage as the market currently consists of many players. Several key players in the global telecom analytics market are in constant efforts to bring product advancements. A few prominent companies are entering into collaborations and expanding their footprints in developing regions to consolidate their positions in the market. The major players are Huawei Technologies, SAP SE, and Oracle Corp.
- March 2023- IBM Corporation announced to provide intelligent automation software to Telecom Egypt (TE) to implement an umbrella solution for all its operations support systems (OSS) on mobile, fixed, and core networks. Telecom Egypt will adopt IBM Cloud Pak for Watson AIOps deployed on RedHat OpenShift to implement an IBM Robotic Process Automation (RPA) solution. The solution provides TE with a holistic view of its entire IT environment to help them innovate faster, reduce operating costs, and minimize the time to troubleshoot and resolve network-related incidents.
- February 2023- Bharti Airtel announced to build an AI-based solution by collaborating with NVIDIA to improve the overall customer experience for all inbound calls to its contact center. The company runs an automated speech recognition algorithm on 84% of its calls coming into its contact centers. This will help the company identify improvement areas for the agent when interacting with the consumers, leading to a better customer experience. The company has leveraged the NVIDIANeMo conversational AI toolkit to develop this specialized speech application and NVIDIA AI enterprise software suite.
Additional Benefits:
- The market estimate (ME) sheet in Excel format
- 3 months of analyst support
TABLE OF CONTENTS
1 INTRODUCTION
- 1.1 Study Assumptions and Market Definition
- 1.2 Scope of the Study
2 RESEARCH METHODOLOGY
3 EXECUTIVE SUMMARY
4 Market Insights
- 4.1 Market Overview
- 4.2 Value Chain Analysis
- 4.3 Industry Attractiveness - Porter's Five Forces Analysis
- 4.3.1 Threat of New Entrants
- 4.3.2 Bargaining Power of Buyers
- 4.3.3 Bargaining Power of Suppliers
- 4.3.4 Threat of Substitute Products
- 4.3.5 Intensity of Competitive Rivalry
- 4.4 Impact of Covid-19 on the Market
- 4.5 Market Dynamics
- 4.5.1 The surge in need for churn reduction
- 4.5.2 Increasing Vulnerability to Fraudulent Activities
- 4.6 Market Restraints
- 4.6.1 Lack of Awareness Among Telecom Operators
5 MARKET SEGMENTATION
- 5.1 By Application
- 5.1.1 Customer Analytics
- 5.1.2 Network Analytics
- 5.1.3 Market Analytics
- 5.1.4 Price Analytics
- 5.1.5 Service Analytics
- 5.1.6 Other Applications
- 5.2 By Deployment
- 5.2.1 Cloud
- 5.2.2 On-premise
- 5.3 By Geography
- 5.3.1 North America
- 5.3.1.1 United States
- 5.3.1.2 Canada
- 5.3.2 Europe
- 5.3.2.1 United Kingdom
- 5.3.2.2 Germany
- 5.3.2.3 France
- 5.3.2.4 Rest of Europe
- 5.3.3 Asia Pacific
- 5.3.3.1 China
- 5.3.3.2 India
- 5.3.3.3 Japan
- 5.3.3.4 Rest of Asia Pacific
- 5.3.4 Rest of the World
- 5.3.4.1 Latin America
- 5.3.4.2 Middle East and Africa
- 5.3.1 North America
6 COMPETITIVE LANDSCAPE
- 6.1 Company Profiles
- 6.1.1 Dell Inc.
- 6.1.2 Oracle Corporation
- 6.1.3 IBM Corporation
- 6.1.4 SAP SE
- 6.1.5 Microsoft Corporation
- 6.1.6 InfoFaces Inc.
- 6.1.7 Accenture PLC
- 6.1.8 Huawei Technologies Co. Ltd
- 6.1.9 Teradata Corporation
- 6.1.10 Wipro Limited
- 6.1.11 Nokia Corporation