|
시장보고서
상품코드
1640602
미국의 WtE(Waste to Energy) 시장 전망 : 시장 점유율 분석, 산업 동향, 성장 예측(2025-2030년)United States Waste to Energy - Market Share Analysis, Industry Trends & Statistics, Growth Forecasts (2025 - 2030) |
||||||
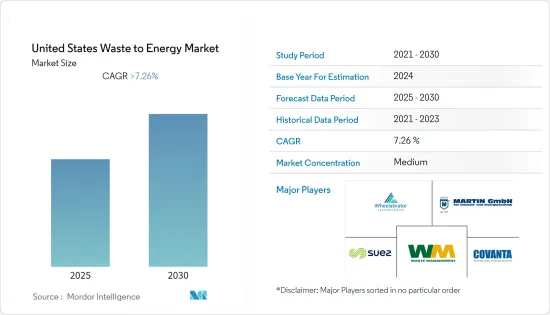
미국의 WtE(Waste to Energy) 시장은 예측 기간 동안 7.26% 이상의 연평균 성장율(CAGR)로 추이할 전망입니다.

코로나19는 2020년에 시장에 부정적인 영향을 미쳤습니다. 현재 시장은 팬데믹 이전 수준에 도달할 가능성이 높습니다.
주요 하이라이트
- 장기적으로 폐기물 발생량 증가, 지속 가능한 도시 생활의 필요성을 충족시키기위한 폐기물 관리에 대한 관심 증가, 비 화석 연료 에너지원에 대한 관심 증가는 폐기물 에너지 시장에 대한 수요를 주도하고 있습니다.
- 반면에 국가는 여전히 WtE에 관한 보다 적합한 정책과 규정이 필요하며 높은 자본 투자, 폐기물 재활용률 증가 및 기타 여러 요인이 WtE 시장의 성장을 억제하고 있습니다.
- WtE(Waste to Energy) 부문의 기술 발전은 가까운 장래에 플랜트 운영자에게 상당한 기회를 창출 할 것으로 예상됩니다.
미국의 WtE(Waste to Energy) 변환 시장 동향
열 기반 WtE(Waste to Energy) 변환이 시장을 독점
- 열 기술은 전 세계적으로 폐기물 소각 시설의 개발이 증가함에 따라 예측 기간 동안 전 세계 폐기물 에너지화 시장에서 가장 높은 시장 점유율을 차지할 것으로 예상됩니다.
- 열병합 발전(난방 및 냉방)과 전기 생산을 함께 활용하는 발전소는 80%의 최적 효율을 달성할 수 있을 것으로 추정됩니다.
- 현재 시나리오에서 소각은 도시 고형 폐기물(MSW) 처리를 위한 가장 잘 알려진 폐기물 에너지화 기술입니다. 그러나 폐기물 에너지화 기술, 특히 소각은 오염을 유발하고 잠재적인 건강 안전 위험을 수반합니다. 미립자 및 가스상 배출을 줄이기 위해 소각장 소유주들은 연도 가스 흐름을 청소하는 일련의 공정 장치를 도입했으며, 이는 결과적으로 환경 지속 가능성을 크게 개선하는 결과를 가져왔습니다.
- 2021년에 미국에서 폐기물에서 파생된 에너지의 약 431조 영국 열 단위가 소비되었습니다. 미립자 및 가스상 배출을 줄이기 위해 소각장 소유주들은 연도 가스 흐름을 정화하기 위한 일련의 공정 장치를 채택했으며, 이는 결과적으로 환경 지속 가능성 측면에서 상당한 개선을 가져왔습니다.
- 2022년 5월, 뉴저지에 본사를 둔 폐기물 관리 회사인 코반타 홀딩 코퍼레이션은 열 기반 기술을 통해 아메리칸 항공, 퀘스트 진단, 써니 딜라이트, 스바루에서 수거한 폐기물로 18,000가구에 전기를 공급할 수 있는 충분한 전력을 생산하고 있다고 발표했습니다.
- 위와 같은 점으로 인해 미국의 폐기물 재활용률 증가는 예측 기간 동안 미국의 폐기물 에너지화 시장의 성장을 제한 할 것으로 예상됩니다.
미국의 폐기물 재활용률 증가로 시장 성장 억제
- 최근 미국의 폐기물 재활용률은 인구 증가와 전국적인 폐기물 증가로 인해 증가하고 있습니다. 미국 환경 보호국에 따르면 1960년 7% 미만이었던 재활용률은 현재 32%까지 증가했습니다.
- 폐기물 재활용은 대기 및 수질 오염을 줄임으로써 다양한 환경적 이점을 제공합니다. 2021년에 미국은 4억 7,110만 톤의 탄소 배출량을 기록했는데, 이는 2019년에 발생한 4억 9,809만 톤의 이산화탄소 배출량보다 상대적으로 낮은 수치입니다.
- 2021년에 미국의 64개 발전소는 약 2,800만 톤의 가연성 MSW를 연소하여 약 136억 kw/h의 전기를 생산했습니다. 바이오매스 재료는 가연성 MSW 무게의 약 61%, 발전량의 약 45%를 차지했습니다.
- 또한, 2021년 한 해 동안 미국 가정에서 발생한 플라스틱 폐기물의 5%만이 재활용되었습니다. 미국인들은 5,100만 톤의 포장지, 병, 가방을 버렸고, 1인당 약 309파운드의 플라스틱을 버렸는데, 이 중 거의 95%가 매립지나 바다에 버려지거나 작은 독성 입자가 되어 대기 중에 흩어졌습니다.
- 새로운 정부 정책은 높은 탄소 배출을 제한하는 것을 목표로 하고 있습니다. 이러한 요인이 소각 공정의 성장을 저해하고 있습니다. 또한 2035년까지 도시 고형 폐기물의 재활용률을 60%까지 끌어올린다는 계획은 소각 시장에도 영향을 미칠 것으로 예상됩니다.
- 위와 같은 점으로 인해 미국의 폐기물 재활용률 증가는 예측 기간 동안 미국의 폐기물 에너지화 시장의 성장을 제한 할 것으로 예상됩니다.
미국의 WtE(Waste to Energy) 산업 개요
미국의 WtE(Waste to Energy) 시장은 보다 결속력을 높여야 합니다. 이 시장의 주요 기업(특정한 순서 없음)에는 Covanta Holding Corp, Waste Management, Inc., Suez SA, Martin GmbH, Wheelabrator Technologies Inc. 등이 있습니다.
기타 혜택
- 엑셀 형식 시장 예측(ME) 시트
- 3개월간의 애널리스트 지원
목차
제1장 서론
- 조사 범위
- 시장의 정의
- 조사의 전제
제2장 조사 방법
제3장 주요 요약
제4장 시장 개요
- 소개
- 2021년까지 시장 규모와 수요 예측(단위 : 10억 달러)
- 최근 동향과 개발
- 정부의 규제와 시책
- 시장 역학
- 성장 촉진요인
- 억제요인
- 공급망 분석
- PESTLE 분석
제5장 시장 세분화
- 기술
- 물리적
- 열적
- 생물적
제6장 경쟁 구도
- M&A, 합작사업, 제휴, 협정
- 주요 기업의 전략
- 기업 프로파일
- Wheelabrator Technologies Inc.
- Suez SA
- Waste Management Inc.
- Martin GmbH
- Covanta Holding Corp.
제7장 시장 기회와 앞으로의 동향
HBR 25.02.13The United States Waste to Energy Market is expected to register a CAGR of greater than 7.26% during the forecast period.
COVID-19 negatively impacted the market in 2020. Presently the market is likely to reach pre-pandemic levels.
Key Highlights
- Over the long term, the increasing amount of waste generation, growing concern for waste management to meet the need for sustainable urban living, and increasing focus on non-fossil fuel sources of energy are driving the demand for the waste-to-energy market.
- On the other hand, the country still needs more suitable policies and regulations concerning WTE, and factors such as high capital investment, increasing the recycling rate of waste, and several other factors have been restraining the growth of the WTE market.
- Technological advancements in the waste-to-energy sector are expected to create significant opportunities for plant operators in the near future.
US Waste To Energy Market Trends
Thermal Based Waste to Energy Conversion to Dominate the Market
- Thermal technology is expected to account for the highest market share in the worldwide waste-to-energy market during the forecast period, owing to the increasing development of waste incineration facilities worldwide.
- It is estimated that plants, which utilize cogeneration of thermal power (heating and cooling), together with electricity generation, can reach optimum efficiencies of 80%.
- In the present scenario, incineration is the most well-known waste-to-energy technology for Municipal Solid Waste (MSW) processing. However, waste-to-energy technologies, particularly incineration, produce pollution and carry potential health safety risks. To reduce particulate and gas-phase emissions, incineration plant owners have adopted a series of process units for cleaning the flue gas stream, which has, in turn, led to a significant improvement in environmental sustainability.
- In 2021, nearly 431 trillion British thermal units of energy derived from waste were consumed in the United States. To reduce particulate and gas-phase emissions, the owners of incineration plants have adopted a series of process units for cleaning the flue gas stream, which has, in turn, led to a significant improvement in terms of environmental sustainability.
- In May 2022, New Jersey-based waste management company Covanta Holding Corporation announced that it is making enough electricity to power 18,000 homes from the waste collected from American Airlines, Quest Diagnostics, Sunny Delight, and Subaru through thermal-based technology.
- Hence, owing to the above points and the recent developments, thermal-based waste-to-energy is expected to dominate the United States Waste-to-Energy Market during the forecast period.
Increasing Recycling Rate of Waste in the United States to Restrain the Growth of the Market
- The waste recycling rate in the United States has been growing in recent days due to the increase in population and growing waste across the country. According to the United States Environmental Protection Agency, the recycling rate has increased from less than seven percent in 1960 to the current rate of 32 percent.
- The recycling of waste offers various environmental benefits by reducing air and water pollution. In the year 2021, the country witnessed 4701.1 million tonnes of carbon emissions, which is comparatively lower than 4980.9 million tonnes of Co2 emissions generated in 2019.
- In 2021, 64 U.S. power plants generated about 13.6 billion kilowatt-hours of electricity from burning about 28 million tonnes of combustible MSW for electricity generation. Biomass materials accounted for about 61% of the weight of the combustible MSW and for about 45% of the electricity generated.
- Also, in the year 2021, only 5% of the plastic waste generated by United States households was recycled. The Americans discarded 51 million tons of wrappers, bottles, and bags, and about 309 lb of plastic per person, of which almost 95 percent ended up in landfills, and oceans or scattered in the atmosphere in tiny toxic particles.
- The new government policies are aimed at restricting high carbon emissions. This factor is hindering the growth of the incineration process. In addition, the increase in recycling of municipal solid waste to 60% by 2035 is expected to affect the market for incineration as well.
- Owing to the above points, the increasing recyling rate of waste in the United States is expected to restrain the growth of the country's waste-to-energy market during the forecast period.
US Waste To Energy Industry Overview
The US waste-to-energy market needs to be more cohesive. Some of the major players in the market (not in particular order) include Covanta Holding Corp, Waste Management, Inc., Suez SA, Martin GmbH, and Wheelabrator Technologies Inc.
Additional Benefits:
- The market estimate (ME) sheet in Excel format
- 3 months of analyst support
TABLE OF CONTENTS
1 INTRODUCTION
- 1.1 Scope of the Study
- 1.2 Market Definition
- 1.3 Study Assumptions
2 RESEARCH METHODOLOGY
3 EXECUTIVE SUMMARY
4 MARKET OVERVIEW
- 4.1 Introduction
- 4.2 Market Size and Demand Forecast in USD billion, till 2021
- 4.3 Recent Trends and Developments
- 4.4 Government Policies and Regulations
- 4.5 Market Dynamics
- 4.5.1 Drivers
- 4.5.2 Restraints
- 4.6 Supply Chain Analysis
- 4.7 PESTLE Analysis
5 MARKET SEGMENTATION
- 5.1 Technology
- 5.1.1 Physical
- 5.1.2 Thermal
- 5.1.3 Biological
6 COMPETITIVE LANDSCAPE
- 6.1 Mergers and Acquisitions, Joint Ventures, Collaborations, and Agreements
- 6.2 Strategies Adopted by Leading Players
- 6.3 Company Profiles
- 6.3.1 Wheelabrator Technologies Inc.
- 6.3.2 Suez SA
- 6.3.3 Waste Management Inc.
- 6.3.4 Martin GmbH
- 6.3.5 Covanta Holding Corp.