


|
시장보고서
상품코드
1683170
민간항공기 객실 인테리어 시장 : 시장 점유율 분석, 산업 동향 및 통계, 성장 예측(2025-2030년)Commercial Aircraft Cabin Interior - Market Share Analysis, Industry Trends & Statistics, Growth Forecasts (2025 - 2030) |
||||||
민간항공기 객실 인테리어 시장 규모는 2025년에 64억 4,000만 달러로 추정되고, 2030년에는 88억 3,000만 달러에 이를 것으로 예측되며, 예측 기간 2025년부터 2030년까지 CAGR은 6.50%로 성장할 전망입니다.
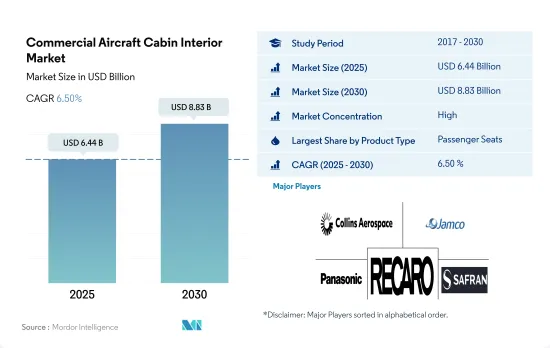
최대 시장 점유율인 31억 달러의 승객 좌석 부문은 다른 제품 유형보다 높은 성장이 예상됩니다.
- 세계의 민간항공기 객실 인테리어 시장은 제품 유형별로 시트, 객실 조명, 기내 엔터테인먼트 시스템, 창, 갤리, 화장실 및 기타 제품 유형으로 구분됩니다. 전 지역 항공사는 승객의 전반적인 편안함과 경험을 향상시키면서 이러한 제품의 실용성을 높이는 데 중점을 둡니다.
- 비즈니스 클래스 이용자의 기호가 높아지고 있기 때문에 이코노미 클래스의 좌석보다 개발 공간이 넓은 좌석 구조의 강화가 필수적입니다. 일부 주요 항공사들은 장비를 표준화하기 위한 현대화 계획을 추진하고 있습니다. 그 중에는 메인 캐빈 인테리어의 이코노미 시트를 제거하고 더 넓고 발밑이 넓은 프리미엄 이코노미 시트로 대체하는 것도 포함되어 있습니다.
- 항공사는 효율성, 신뢰성, 내구성 및 무게 측면에서 기존의 실내 조명의 다양한 단점을 해결하는 데 도움이 되므로 고급 LED 조명으로 전환하고 있습니다. 따라서 다양한 OEM에 의한 LED 조명의 발전은 기존 항공기 객실 조명보다 시장 성장을 가속할 것으로 예상됩니다. 또한 대기업은 기내 엔터테인먼트 스크린에 4K 기술을 채택하여 승객의 경험을 향상시키려고 합니다. 항공사에 의한 장거리 노선에 대한 협폭동체의 채용이 증가하고, 좁은 몸기로의 IFE 시스템의 도입을 뒷받침하고 있습니다.
- 2023년부터 2030년까지 약 1만 3,000대의 항공기가 납입될 전망입니다. 항공기 조달 수의 급증과 기체 확대 계획은 2023년부터 2030년까지 세계의 민간항공기 객실 인테리어 수요를 적극적으로 끌어올릴 것으로 예상됩니다.
항공기 갱신 계획의 일환으로 세계적으로 다양한 항공사의 방대한 항공기 발주가 증가하고 있으며, 항공사가 승객의 여행 체험 향상에 주력하고 있는 것이 객실 인테리어 시장 수요를 견인하고 있습니다.
- 항공사의 경우 고객 경험은 항상 최우선 과제입니다. 승객은 여행할 때마다 긍정적인 경험을 해야 합니다. 최상의 경험을 제공하기 위해 항공사는 새로운 현대화된 객실 인테리어 제공에 주력하고 있습니다. 객실 인테리어는 항공기의 중요한 요소이며 여객에게 안전하고 편안한, 더 아름다운 환경을 여행하는 동안 설명합니다.
- 항공기 객실 인테리어에 대한 수요는 세계적으로 다양한 항공사가 주문하는 다양한 항공기에 의해 견인되고 있습니다. 2022년 12월 Boeing은 United Airlines가 787-9ss를 100대 주문했다고 발표했습니다. 이 거래는 Boeing 역사상 가장 큰 787 드림 라이너의 주문입니다. 또한 United Airlines는 737 MAX를 100대 구입할 예정입니다. 2023년 6월, Indigo는 Airbus와 A320neo 제트기 500대의 거액 계약을 맺었습니다. 항공기는 2030-2035년 사이에 인도될 예정입니다. 마찬가지로 2023년 2월 Air India는 B737 Max 190대, A320neo 140대, A321neo 70대, A350 34대, 777X 10대, 787-9 20대의 총 464대를 주문했습니다. 게다가 막대한 보유수가 시장 성장을 더욱 촉진할 것으로 예상됩니다. 2023년 8월 말까지 Airbus는 7,967대의 수주잔량을 계상했고, 그 중 85%는 A320ceo/neo 패밀리의 내로우 바디기였습니다. Boeing은 5,579대의 수주잔량을 계상했는데, 그 중 78%가 737 MAX의 내로우 바디기였습니다.
- 또한 2023년부터 2030년까지 약 1만 3,812대가 납입될 예정입니다. 다양한 세계 항공사의 항공기 증비 계획은 여객기 조달을 도와주므로 2022년 42억에 비해 2030년에는 88억 민간항공기 객실 인테리어 시장의 성장을 가속할 것으로 예상됩니다.
세계의 민간항공기 객실 인테리어 시장 동향
COVID-19 팬데믹 이후 국제 여객 수송량 증가가 시장 수요 견인
- COVID-19 팬데믹 이후 2022년 국경을 넘은 여행이 점차 회복됨에 따라 아시아태평양 항공사는 사람들의 여행 욕망과 2년간의 격리 기간에 축적된 저축을 현금화하는 것에 자극을 받으며 폭주하는 수요에 부응하기 위해 증편을 서두르고 있습니다. 그 결과, 2022년에, 이 지역의 항공 여객 수송량은 다른 지역보다 빠르게 팬데믹으로부터 회복되었습니다. 예를 들어, 2022년 아시아태평양 전체의 항공 여객 수는 19억 명을 기록했으며, 2021년 대비 6%, 2020년 대비 151% 증가했습니다. 이 지역의 항공사는 주요 국가에서 항공 여객 수송량 증가에 대응하기 위해 장비 확대 계획을 실시했습니다. 중국, 인도, 일본, 인도네시아는 이 지역의 항공 여객 수송량 전체의 70%를 차지하고 있으며, 기타 아시아태평양 국가들과 비교하여 신조 항공기에 대한 높은 수요를 창출하고 있습니다.
- 아시아태평양 항공사는 또한 세계적으로 경제 상황이 엄격해지고 있음에도 불구하고 여행 수요가 계속 성장하고 있기 때문에 국제 항공 여객 시장의 순조로운 회복을 목격했습니다. 예를 들어, 2022년 8월 국제선 여객수는 1,310만 명을 기록했으며, 140만 명이었던 2021년 8월과 비교하면 836%의 성장세를 보였습니다. 연초 8개월간의 국제선 여객 수의 건전한 성장은 비즈니스와 레저 소비자로부터의 강한 여행 수요를 나타냅니다. 이 지역의 항공 여객 수송량의 급증은 향후 항공 수송 산업을 견인할 것으로 기대됩니다.
제조업과 건설업 등 주요 산업 수요가 GDP를 밀어 올립니다.
- 아시아태평양의 2022년 GDP는 약 36조 달러였습니다. 전체 GDP 중 중국 항공 운송 산업은 연간 약 800억 달러의 기여를 하고 있습니다. 인도와 한국에서는 항공산업이 각각 약 130억 달러와 300억 달러의 GDP에 기여하고 있습니다. 이 지역의 1인당 GDP에서는 중국이 2017년부터 2022년까지 61%의 최고 성장률을 기록했습니다. 대조적으로 인도와 한국과 같은 다른 주요 국가는 각각 27%, 11%였습니다.
- COVID-19 팬데믹은 지역국가의 1인당 GDP에 심각한 영향을 주었으며, 주요 경제국에서는 제조업과 건설업 등 주요 산업 수요감퇴를 보여 많은 고용상실로 이어졌습니다. 2020년 아시아태평양 전체의 1인당 GDP는 1% 감소했습니다. 아시아태평양 국가들이 팬데믹의 영향을 줄이는 데 도움이 된 것은 국내 재화 서비스 공급이었습니다.
- 국가별로 일본 1인당 GDP는 2020년 1.3% 감소했고 인도 GDP는 6% 감소했습니다. 2022년에는 이들 국가의 상품과 서비스에 대한 수요가 급증하고 경제활동이 회복된 것이 이 지역의 1인당 GDP에 반영되어 2021년에 비해 7% 이상 증가했습니다. 항공 여행의 보급률은 1인당 GDP와 상관관계에 있습니다. 1인당 GDP가 높은 국가일수록 항공 여객 수가 많은 경향이 있습니다. 아시아태평양의 1인당 GDP는 2017년부터 2022년까지 약 30% 급증하며, 이는 미래에 여객항공산업 전체를 도울 것으로 예상됩니다.
민간항공기 객실 인테리어 산업 개요
민간항공기 객실 인테리어 시장은 상당히 통합되어 있으며 상위 5개사에서 68.63%를 차지하고 있습니다. 이 시장의 주요 기업은 Collins Aerospace, Jamco Corporation, Panasonic Avionics Corporation, Recaro Group, Safran입니다.
기타 혜택
- 엑셀 형식 시장 예측(ME) 시트
- 3개월의 애널리스트 서포트
목차
제1장 주요 요약 및 주요 조사 결과
제2장 보고서 제안
제3장 서문
- 조사 전제조건 및 시장 정의
- 조사 범위
- 조사 방법
제4장 주요 산업 동향
- 항공 여객 수송량
- 아시아태평양
- 유럽
- 중동
- 북미
- 신규 항공기 납품 수
- 아프리카
- 아시아태평양
- 유럽
- 중동
- 북미
- 남미
- 1인당 GDP(현재 가격)
- 아시아태평양
- 유럽
- 중동
- 북미
- 항공기 제조업체의 수입
- 항공기 수주 잔
- 수주 총액
- 공항 건설 지출(계속 중)
- 항공사의 연료비
- 규제 프레임워크
- 밸류체인 및 유통채널 분석
제5장 시장 세분화(시장 규모(100만 달러), 예측, 성장 전망 분석 포함)(-2030년)
- 제품 유형별
- 객실 인테리어 라이트
- 기내창
- 기내 엔터테인먼트 시스템
- 승객 시트
- 기타
- 항공기 유형별
- 내로우 바디
- 와이드 바디
- 객실 클래스
- 비즈니스 클래스 및 퍼스트 클래스
- 이코노미 클래스 및 프리미엄 이코노미 클래스
- 지역별
- 아시아태평양
- 국가별
- 중국
- 인도
- 인도네시아
- 일본
- 싱가포르
- 한국
- 기타 아시아태평양
- 유럽
- 국가별
- 프랑스
- 독일
- 스페인
- 터키
- 영국
- 기타 유럽
- 중동
- 국가별
- 사우디아라비아
- 아랍에미리트(UAE)
- 기타 중동
- 북미
- 국가별
- 캐나다
- 미국
- 북미의 기타
- 기타
- 아시아태평양
제6장 경쟁 구도
- 주요 전략 동향
- 시장 점유율 분석
- 기업 상황
- 기업 프로파일
- Astronics Corporation
- Collins Aerospace
- Diehl Aerospace GmbH
- Expliseat
- FACC AG
- GKN Aerospace Service Limited
- Jamco Corporation
- Luminator Technology Group
- Panasonic Avionics Corporation
- Recaro Group
- Safran
- SCHOTT Technical Glass Solutions GmbH
- STG Aerospace
- Thales Group
- Thompson Aero Seating
제7장 CEO에 대한 주요 전략적 질문
제8장 부록
- 세계 개요
- 개요
- Porter's Five Forces 분석 프레임워크
- 세계의 밸류체인 분석
- 시장 역학(DROs)
- 정보원 및 참고문헌
- 도표 일람
- 주요 인사이트
- 데이터 팩
- 용어집
The Commercial Aircraft Cabin Interior Market size is estimated at 6.44 billion USD in 2025, and is expected to reach 8.83 billion USD by 2030, growing at a CAGR of 6.50% during the forecast period (2025-2030).

With the largest market share of USD 3.1 billion, the passenger seats segment is expected to register higher growth than other product types
- The global commercial aircraft cabin interior market has been segmented by product type into seats, cabin lighting, in-flight entertainment systems, windows, galleys, lavatories, and other product types. Airline companies across all regions are emphasizing increasing the utility of these products while improving overall passenger comfort and experience.
- An enhanced seating structure with more developed space than economy-class seats is becoming highly essential due to the rising preferences of business-class travelers. Several leading airlines are engaged in modernization plans to standardize their fleets. These include stripping out the main cabin's economy seats and replacing them with premium economy seats that are wider and offer more legroom.
- Airlines are moving toward advanced LED lighting as it helps them eliminate various drawbacks of the existing interior cabin lights in terms of efficiency, reliability, durability, and weight. Therefore, advancements in LED lighting by various OEMs over conventional aircraft cabin lights are expected to drive the market's growth. Moreover, major airlines are adopting 4K technology in their in-flight entertainment screens to enhance passenger experience. The adoption of narrowbody aircraft in longer haul routes by airlines has increased, aiding the deployment of IFE systems in narrowbody aircraft.
- Around 13,000 aircraft are expected to be delivered between 2023 and 2030. The surge in aircraft procurement numbers and fleet expansion plans are expected to boost the global demand for commercial aircraft cabin interiors positively during 2023-2030.
Increasing huge aircraft orders by various airlines globally as part of fleet renewal plans and airlines focusing on enhancing passengers' travel experiences are driving the demand for cabin interiors in the market
- Customer experience is always at the top of the priority list for airlines. Passengers must have a positive experience every time they travel. To provide the best experience, airline companies are focusing on delivering new modernized cabin interiors as the interior is an important aspect of any aircraft, providing passengers with a secure, comfortable, and more aesthetically pleasing environment throughout the journey.
- The demand for aircraft cabin interiors is driven by various aircraft orders that are placed by various airlines globally. In December 2022, Boeing announced that United Airlines had placed an order for 100 787-9ss, with the option to purchase 100 more. The transaction is the largest 787 Dreamliner order in Boeing's history. Also, United Airlines plans to purchase 100 737 MAX. In June 2023, Indigo placed a huge contract with Airbus for 500 A320neo jets. The aircraft will be delivered between 2030 and 2035. Similarly, in February 2023, Air India ordered 464 aircraft that comprised 190 B737 Max, 140 A320neo, 70 A321neo, 34 A350s, 10 777Xs, and 20 787-9s. Additionally, it is expected that the huge aircraft backlog will also further drive market growth. By the end of August 2023, Airbus reported a backlog of 7,967 jets, of which 85% were the A320ceo/neo family of narrowbodies. Boeing reported a backlog of 5,579 aircraft, of which 78% were 737 MAX narrowbody jets.
- Furthermore, around 13,812 aircraft are expected to be delivered between 2023 and 2030. The fleet expansion plans of various global airlines are expected to aid the procurement of passenger aircraft and, thus, drive the growth of the commercial aircraft cabin interior market by 8.8 billion in 2030 compared to 4.2 billion in 2022.
Global Commercial Aircraft Cabin Interior Market Trends
An increase in international passenger traffic post the COVID-19 pandemic is driving market demand
- As cross-border travel was progressively restored in 2022 post the COVID-19 pandemic, the carriers in Asia-Pacific raced to increase their flights to meet runaway demand, stimulated by people's desire to travel and cash in on savings accumulated in the two years of isolation. As a result, in 2022, the air passenger traffic in the region recovered more rapidly from the pandemic than in the other regions. For instance, in 2022, air passenger traffic in the whole of Asia-Pacific was recorded at 1.9 billion, a growth of 6% compared to 2021 and 151% compared to 2020. Airline companies in the region are implementing fleet expansion plans to cater to the growing air passenger traffic in the major countries. China, India, Japan, and Indonesia accounted for 70% of the total air passenger traffic in the region, generating higher demand for new aircraft compared to other Asia-Pacific countries.
- Airlines in Asia-Pacific also witnessed a good recovery in international air passenger markets as travel demand continued to fuel growth despite increasingly challenging global economic conditions. For instance, in August 2022, the region recorded 13.1 million international air passenger traffic, an 836% increase compared to August 2021, when it was recorded at 1.4 million. The healthy growth in international passenger traffic in the first eight months of the year showed strong travel demand from business and leisure consumers. The rapid increase in air passenger traffic in the region is expected to drive the air transport industry in the future.
Demand in major industries, such as manufacturing and construction, boosting the GDP
- The Asia-Pacific region had a GDP of around USD 36 trillion in 2022. Of the total GDP, the air transport industry in China contributes around USD 80 billion annually. In India and South Korea, the aviation industry contributed around USD 13 billion and USD 30 billion, respectively, to the GDP. In terms of GDP per capita in the region, China recorded the highest growth rate of 61% during 2017-2022. In contrast, other major countries, such as India and South Korea, accounted for 27% and 11%, respectively.
- The COVID-19 pandemic severely impacted the GDP per capita of regional countries, with major economies witnessing a decline in demand in major industries, such as manufacturing and construction, leading to many job losses. The GDP per capita income of the overall Asia-Pacific region declined by 1% in 2020. The supply of domestic goods and services supported the Asia-Pacific countries in mitigating the impact of the pandemic.
- By country, Japan's GDP per capita declined by 1.3% in 2020, while India's GDP declined by 6%. In 2022, the recovery in economic activities, with surging demand for goods and services from these countries, was reflected in the region's GDP per capita, which increased by over 7% compared to 2021. The penetration of air travel is correlated with GDP per capita. Countries with higher GDP per capita tend to have higher numbers of air passengers. Asia-Pacific's GDP per capita income surged by around 30% during 2017-2022, which is expected to aid the overall passenger aviation industry in the future.
Commercial Aircraft Cabin Interior Industry Overview
The Commercial Aircraft Cabin Interior Market is fairly consolidated, with the top five companies occupying 68.63%. The major players in this market are Collins Aerospace, Jamco Corporation, Panasonic Avionics Corporation, Recaro Group and Safran (sorted alphabetically).
Additional Benefits:
- The market estimate (ME) sheet in Excel format
- 3 months of analyst support
TABLE OF CONTENTS
1 EXECUTIVE SUMMARY & KEY FINDINGS
2 REPORT OFFERS
3 INTRODUCTION
- 3.1 Study Assumptions & Market Definition
- 3.2 Scope of the Study
- 3.3 Research Methodology
4 KEY INDUSTRY TRENDS
- 4.1 Air Passenger Traffic
- 4.1.1 Asia-Pacific
- 4.1.2 Europe
- 4.1.3 Middle East
- 4.1.4 North America
- 4.2 New Aircraft Deliveries
- 4.2.1 Africa
- 4.2.2 Asia-Pacific
- 4.2.3 Europe
- 4.2.4 Middle East
- 4.2.5 North America
- 4.2.6 South America
- 4.3 GDP Per Capita (current Price)
- 4.3.1 Asia-Pacific
- 4.3.2 Europe
- 4.3.3 Middle East
- 4.3.4 North America
- 4.4 Revenue Of Aircraft Manufacturers
- 4.5 Aircraft Backlog
- 4.6 Gross Orders
- 4.7 Expenditure On Airport Construction Projects (ongoing)
- 4.8 Expenditure Of Airlines On Fuel
- 4.9 Regulatory Framework
- 4.10 Value Chain & Distribution Channel Analysis
5 MARKET SEGMENTATION (includes market size in Value in USD, Forecasts up to 2030 and analysis of growth prospects)
- 5.1 Product Type
- 5.1.1 Cabin Lights
- 5.1.2 Cabin Windows
- 5.1.3 In-Flight Entertainment System
- 5.1.4 Passenger Seats
- 5.1.5 Other Product Types
- 5.2 Aircraft Type
- 5.2.1 Narrowbody
- 5.2.2 Widebody
- 5.3 Cabin Class
- 5.3.1 Business and First Class
- 5.3.2 Economy and Premium Economy Class
- 5.4 Region
- 5.4.1 Asia-Pacific
- 5.4.1.1 By Country
- 5.4.1.1.1 China
- 5.4.1.1.2 India
- 5.4.1.1.3 Indonesia
- 5.4.1.1.4 Japan
- 5.4.1.1.5 Singapore
- 5.4.1.1.6 South Korea
- 5.4.1.1.7 Rest of Asia-Pacific
- 5.4.2 Europe
- 5.4.2.1 By Country
- 5.4.2.1.1 France
- 5.4.2.1.2 Germany
- 5.4.2.1.3 Spain
- 5.4.2.1.4 Turkey
- 5.4.2.1.5 United Kingdom
- 5.4.2.1.6 Rest of Europe
- 5.4.3 Middle East
- 5.4.3.1 By Country
- 5.4.3.1.1 Saudi Arabia
- 5.4.3.1.2 United Arab Emirates
- 5.4.3.1.3 Rest of Middle East
- 5.4.4 North America
- 5.4.4.1 By Country
- 5.4.4.1.1 Canada
- 5.4.4.1.2 United States
- 5.4.4.1.3 Rest of North America
- 5.4.5 Rest of World
- 5.4.1 Asia-Pacific
6 COMPETITIVE LANDSCAPE
- 6.1 Key Strategic Moves
- 6.2 Market Share Analysis
- 6.3 Company Landscape
- 6.4 Company Profiles
- 6.4.1 Astronics Corporation
- 6.4.2 Collins Aerospace
- 6.4.3 Diehl Aerospace GmbH
- 6.4.4 Expliseat
- 6.4.5 FACC AG
- 6.4.6 GKN Aerospace Service Limited
- 6.4.7 Jamco Corporation
- 6.4.8 Luminator Technology Group
- 6.4.9 Panasonic Avionics Corporation
- 6.4.10 Recaro Group
- 6.4.11 Safran
- 6.4.12 SCHOTT Technical Glass Solutions GmbH
- 6.4.13 STG Aerospace
- 6.4.14 Thales Group
- 6.4.15 Thompson Aero Seating
7 KEY STRATEGIC QUESTIONS FOR COMMERCIAL AIRCRAFT CABIN INTERIOR CEOS
8 APPENDIX
- 8.1 Global Overview
- 8.1.1 Overview
- 8.1.2 Porter's Five Forces Framework
- 8.1.3 Global Value Chain Analysis
- 8.1.4 Market Dynamics (DROs)
- 8.2 Sources & References
- 8.3 List of Tables & Figures
- 8.4 Primary Insights
- 8.5 Data Pack
- 8.6 Glossary of Terms
