


|
시장보고서
상품코드
1683507
콜라겐 시장 : 시장 점유율 분석, 산업 동향 및 통계, 성장 예측(2025-2030년)Collagen - Market Share Analysis, Industry Trends & Statistics, Growth Forecasts (2025 - 2030) |
||||||
■ 보고서에 따라 최신 정보로 업데이트하여 보내드립니다. 배송일정은 문의해 주시기 바랍니다.
가격
※ 부가세 별도
한글목차
영문목차
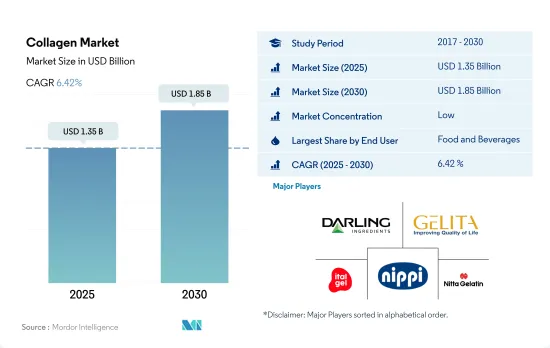
콜라겐 시장 규모는 2025년에 13억 5,000만 달러로 추정되며, 예측 기간(2025-2030년) 동안 6.42%의 CAGR로 성장하여 2030년에는 18억 5,000만 달러에 달할 것으로 예상됩니다.
퍼스널 케어 및 화장품 부문은 콜라겐 기반 미용 제품, 즉 피부에 유익한 제품에 대한 소비자 선호도가 증가함에 따라 예측 기간 동안 더 높은 매출을 올릴 것으로 예상
- 최종 사용자별로는 식음료, 베이커리 및 스낵 하위 부문에서 가장 많은 용도를 보유한 F&B가 가장 큰 부문으로 남아있었습니다. 이 부문은 또한 예측 기간 동안 물량 기준으로 5.99%의 연평균 성장률로 시장을 주도할 것으로 예상됩니다. 이러한 수요는 다기능성과 영양학적 이점에 기인합니다.
- 그러나 예측 기간 동안 퍼스널 케어 및 화장품 부문의 콜라겐 적용은 부피 기준으로 7.02 %의 가장 빠른 CAGR로 다른 부문을 능가 할 것으로 예상됩니다. 이 부문은 피부 자극, 민감성 또는 광독성 징후가 미미하기 때문에 가수 분해 된 형태의 콜라겐을 사용합니다. 단백질 강화는 건강에 대한 관심이 높아지면서 전 세계 소비자들 사이에서 주요 관심사가 되었습니다. 예를 들어, 2021년에 전 세계 소비자의 75%가 단백질 강화 식품 및 음료에 대해 더 높은 가격을 지불했으며, 절반 이상이 10%의 프리미엄을 지불하고 15%의 소비자는 25%의 프리미엄을 지불할 의향이 있는 것으로 나타났습니다.
- 음료 하위 부문은 콜라겐 시장에서 가장 큰 최종 사용자 부문이며 2023년 전체 소비량의 44.2% 이상을 차지할 것으로 예상됩니다. 콜라겐 음료 시장은 개발 초기 단계에 있습니다. 소비자들이 섭취하는 음료의 건강상의 이점에 대해 점점 더 많이 인식함에 따라 콜라겐 음료의 전체 시장이 확대될 것으로 예상됩니다. 콜라겐 기반 음료에는 에너지 공급, 세포 재생 및 신진대사와 관련된 하이드록시프롤린, 아미노산 글리신, 아르기닌, 프롤린이 풍부하게 함유되어 있습니다. 콜라겐은 다양한 뜨거운 음료에 사용할 수 있어 건강에 유익한 혁신적인 제품을 만들 수 있는 기반을 마련합니다. 따라서 커피, 핫초코 등 콜라겐이 강화된 뜨거운 음료의 소비가 빠른 속도로 증가하고 있습니다.
아시아태평양 지역은 다양한 제조 단위의 강력한 존재와 함께 콜라겐 기반 제품의 인기가 높아짐에 따라 2022년에 대부분의 점유율을 차지
- 아시아태평양 콜라겐 시장은 주로 중국과 인도를 중심으로 이 지역의 원료 생산량이 증가함에 따라 가장 큰 규모를 형성하고 있습니다. 중국에서 콜라겐은 피부 미용뿐만 아니라 면역력, 관절 건강, 스포츠 성능 향상에도 도움이 되는 보충제로 사용되고 있습니다. 이 지역의 콜라겐 판매는 인구 고령화와 콜라겐 기반 성분을 제품 라인에 점진적으로 추가하고 있는 기업들에 의해 주도되고 있습니다. 동남아시아의 경우 2017년 60세 이상의 인구 비율은 9.8%였으며, 2030년에는 13.7%로 증가할 것으로 예상됩니다.
- 유럽은 시장에서 두 번째로 큰 지역이며 예측 기간 동안 가치 기준으로 가장 빠른 6.48%의 연평균 성장률을 기록할 것으로 예상되는데, 이는 퍼스널 케어 및 화장품과 같이 잠재력이 높은 최종 사용자 부문을 위한 지속적인 제품 혁신과 같은 차별화된 전략을 채택하여 급증하는 수요에 대응하는 지역 업체들이 증가했기 때문인 것으로 분석됩니다. 독일에서 사노택트(Sanotact), 뷰티해커(BeautyHacker) 뷰티 콜라겐 음료와 같은 콜라겐 펩타이드 기반 음료와 콜라겐 기반 미용 음료의 인기가 높아진 것도 이러한 성장에 기여하고 있습니다.
- 중동 및 아프리카는 또 다른 유망 시장으로, 대부분의 소비자가 이슬람 원칙을 따르기 때문에 이 지역의 시장 참여자들이 할랄 공급원이나 해양 기반 콜라겐을 공급할 수 있는 기회를 창출하고 있으며 종교 기반 정책의 도입 및 시행으로 콜라겐 기반 제품 사용에 대한 유연성을 제공하기 위해 수요가 증가될 것으로 예상됩니다. 중동 및 아프리카 지역의 해양 유래 콜라겐 시장은 예측 기간 동안 각각 7.47%와 8.21%의 연평균 성장률을 기록할 것으로 예상됩니다.
세계의 콜라겐 시장 동향
온라인 플랫폼의 성장과 함께 건강한 스낵 선호도가 시장 성장을 뒷받침
- 세계의 소비자는 건강 지향 증가와 함께 스낵 라이프 스타일을 점점 받아들이고 있습니다. 이러한 변화는 전통적인 스낵보다 영양이 풍부한 대체 스낵을 선호하는 것에서 분명하게 드러납니다. 예를 들어, 2021년 6월 영국의 Z세대(16-24세)의 25%는 '저칼로리'라고 표시된 스낵을 선호했으며, 밀레니얼 세대(25-34세)의 18%는 고단백 스낵을 찾았습니다. 또한 55세 이상의 36%는 '저칼로리' 또는 '무설탕' 스낵을 적극적으로 찾았습니다. 이에 따라 업계를 선도하는 기업들은 다양한 저지방 및 저칼로리 제품을 선보이며 이에 대응하고 있습니다.
- 또한 식품 트렌드와 영감을 얻기 위해 소셜 미디어에 점점 더 의존하는 사용자들이 늘어나면서 Instagram과 YouTube와 같은 플랫폼은 새로운 스낵을 발견하는 중요한 도구로 부상했습니다. 전 세계 소비자, 특히 Z세대와 밀레니얼 세대의 70% 이상이 2022년에 새로운 스낵을 발견한 경로로 소셜 미디어를 꼽았습니다. 온라인 플랫폼의 부상으로 프로세스가 더욱 간소화되면서 소비자는 집에서 편안하게 다양한 스낵을 탐색하고 구매할 수 있게 되었습니다.
- 또한 신선하고 몸에 좋은 기능성 스낵을 강조하는 프리미엄화가 스낵 부문의 혁신을 주도하고 있습니다. 대담하고 매운 맛과 이국적인 재료가 인기를 끌면서 다양한 글로벌 입맛에 어필하고 지역 시장의 성장을 촉진하고 있습니다. 스낵은 단순한 식사 대용을 넘어 현대 문화에 깊이 뿌리내리고 있습니다. 집에서 일하거나 엔터테인먼트를 즐기면서 스낵을 먹는 것은 이제 흔한 일이 되었습니다. 예를 들어, 고드레 유미에즈(Godrej Yummiez)의 2022년 11월 보고서에 따르면 인도 소비자의 45%가 파티나 축하 행사에서 스낵을 선호한다고 답했습니다. 이러한 문화적 변화는 스낵이 개인적인 선택에서 사회적 기대치로 변화하고 있음을 보여줍니다.
육류는 콜라겐 제조업체에서 주로 원료로 사용
- 육류는 전 세계 사람들에게 중요한 영양 공급원입니다. 육류에 대한 전 세계 수요는 지난 50년 동안 증가하여 육류 생산량이 세 배로 증가했습니다. 현재 전 세계 육류 생산량은 매년 3억 5,000만 톤 이상입니다. 지역적으로는 아시아태평양 지역이 전 세계 육류 생산량의 상당 부분을 차지하며 최대 육류 생산국의 자리를 지키고 있습니다. 이는 지난 수십 년과 비교했을 때 큰 변화입니다. 유럽의 육류 생산량도 최근 몇 년 동안 두 배로 증가했습니다. 중국이 전체 육류 생산량 증가의 대부분을 차지할 것으로 예상되며, 미국, 브라질, 인도가 그 뒤를 이을 것으로 전망됩니다.
- 미국은 소고기와 버팔로 고기의 최대 생산국이며, 브라질과 중국이 그 뒤를 잇고 있습니다. 아르헨티나, 호주, 인도도 주목할 만한 기여를 하고 있습니다. 가금류 분야에서는 미국이 선두를 달리고 있으며, 중국과 브라질이 중추적인 역할을 하고 있습니다. 유럽은 전체 가금류 생산량에서 미국과 비슷합니다. 그러나 1인당 육류 소비량이 이미 높은 고소득 국가에서는 수요가 정체되거나 심지어 감소할 것으로 예상됩니다. 이러한 변화는 인구 고령화와 식단 선호도의 변화로 인해 더 다양한 단백질을 강조하는 식습관에 기인합니다.
- 특히 중국에서 목축업이 확대되면서 전 세계 육류 생산량의 상승세를 뒷받침하고 있습니다. 이러한 추세는 특히 저소득 및 중간 소득 국가에서 동물 사육 및 기술의 발전과 함께 생산성을 강화할 것으로 예상됩니다. 특히 가금류 육류가 전 세계 육류 생산의 급증을 주도하고 있습니다.
콜라겐 산업 개요
콜라겐 시장은 단편화되어 상위 5개사에서 11.59%를 차지하고 있습니다. 이 시장 주요 기업은 다음과 같습니다. Darling Ingredients Inc., GELITA AG, Italgelatine SpA, Nippi. Inc. and Nitta Gelatin Inc.(sorted alphabetically).
기타 혜택
- 엑셀 형식 시장 예측(ME) 시트
- 3개월의 애널리스트 지원
목차
제1장 주요 요약과 주요 조사 결과
제2장 소개
- 조사의 전제조건과 시장 정의
- 조사 범위
- 조사 방법
제3장 주요 산업 동향
- 최종 사용자 시장 규모
- 이유식 및 유아용 조제 분유
- 베이커리
- 음료
- 조식용 시리얼
- 조미료 및 소스
- 과자류
- 유제품 및 유제품 대체 제품
- 노인 영양 및 의료 영양
- 고기, 닭고기, 해산물 및 고기 대체 제품
- RTE 및 RTC 식품
- 스낵
- 스포츠 및 퍼포먼스 영양
- 동물 사료
- 퍼스널 케어 및 화장품
- 단백질 소비 동향
- 동물
- 생산 동향
- 동물
- 규제 프레임워크
- 중국
- 프랑스
- 독일
- 인도
- 이탈리아
- 일본
- 영국
- 미국
- 밸류체인과 유통채널 분석
제4장 시장 세분화
- 형태
- 동물 기반
- 해양 기반
- 최종 사용자
- 동물 사료
- 음식
- 하위 최종 사용자별
- 베이커리
- 음료
- 조식용 시리얼
- 스낵
- 퍼스널케어 및 화장품
- 보충제
- 하위 최종사용자별
- 노인 영양 및 의료 영양
- 스포츠 및 퍼포먼스 영양
- 지역별
- 아프리카
- 형태별
- 최종 사용자별
- 국가별
- 나이지리아
- 남아프리카
- 기타 아프리카
- 아시아태평양
- 형태별
- 최종 사용자별
- 국가별
- 호주
- 중국
- 인도
- 인도네시아
- 일본
- 말레이시아
- 뉴질랜드
- 한국
- 태국
- 베트남
- 기타 아시아태평양
- 유럽
- 형태별
- 최종 사용자별
- 국가별
- 벨기에
- 프랑스
- 독일
- 이탈리아
- 네덜란드
- 러시아
- 스페인
- 터키
- 영국
- 기타 유럽
- 중동
- 형태별
- 최종 사용자별
- 국가별
- 이란
- 사우디아라비아
- 아랍에미리트(UAE)
- 기타 중동
- 북미
- 형태별
- 최종 사용자별
- 국가별
- 캐나다
- 멕시코
- 미국
- 기타 북미
- 남미
- 형태별
- 최종 사용자별
- 국가별
- 아르헨티나
- 브라질
- 기타 남미
- 아프리카
제5장 경쟁 구도
- 주요 전략 동향
- 시장 점유율 분석
- 기업 상황
- 기업 프로파일(세계 수준 개요, 시장 수준 개요, 주요 사업 부문, 재무, 직원 수, 주요 정보, 시장 순위, 시장 점유율, 제품 및 서비스, 최근 동향 분석 포함)
- ASAHI GELATINE INDUSTRIAL Co.,Ltd.
- Darling Ingredients Inc.
- Ewald-Gelatine GmbH
- Foodchem International Corporation
- GELITA AG
- Italgelatine SpA
- Jellice Pioneer Private Limited
- Nippi. Inc.
- Nitta Gelatin Inc.
제6장 CEO에 대한 주요 전략적 질문
제7장 부록
- 세계 개요
- 개요
- Five Forces 분석 프레임워크
- 세계의 밸류체인 분석
- 시장 역학(DROs)
- 출처 및 참고문헌
- 도표 목록
- 주요 인사이트
- 데이터 팩
- 용어집
The Collagen Market size is estimated at 1.35 billion USD in 2025, and is expected to reach 1.85 billion USD by 2030, growing at a CAGR of 6.42% during the forecast period (2025-2030).

Personal care and cosmetic segment is expected to gain higher sales in forecast period due to growing consumer preferences for collagen-based beauty products i.e. beneficial for skin
- By end user, F&B remained the largest segment, with the majority of applications in the beverage, bakery, and snacks sub-segments. The segment is also anticipated to drive the market with a CAGR of 5.99%, by volume, in the forecast period. This demand can be attributed to its multi-functionality and nutritional benefits.
- However, in the forecast period, collagen application in the personal care and cosmetics segment is projected to outpace other segments with the fastest CAGR of 7.02% by volume. The segment uses collagen in the hydrolyzed form, owing to its negligible skin irritation, sensitization, or indication of phototoxicity. Protein fortification has become a major interest among global consumers, with a rise in their health concerns. For example, in 2021, 75% of global consumers paid a higher price for protein-fortified food and beverages, while more than half paid a 10% premium, and 15% of consumers would be willing to pay a 25% premium.
- The beverages sub-segment is the largest end-user segment in the collagen market and represents over 44.2% of the total consumption volume in 2023. The collagen drinks market is in its early stages of development. As consumers become increasingly aware of the health benefits of the beverages they consume, it is expected to increase the overall market for collagen drinks. Collagen-based drinks are high in hydroxyproline, amino acids glycine, arginine, and proline, which are associated with energy supply, cell regeneration, and metabolism. Collagen can be used in many hot beverages, which paves the way for innovative products with health benefits. Hence, the consumption of collagen-enhanced hot beverages such as coffee and hot chocolate is increasing at a high pace.
Asia-pacific accounted majority of share in 2022 due to growing popularity of collagen based products coupled with strong presence of various manufacturing units
- The Asia-Pacific collagen market is the largest, owing to the higher production of raw materials in the region, mainly in China and India. In China, collagen application in supplements is not only used for skin beauty but also beneficial for immune, joint health, and sports performance. Collagen sales in the region are being driven by the aging population and companies that are progressively adding collagen-based ingredients to their product lines. In Southeast Asia, the proportion of individuals aged 60 years and older was 9.8% in 2017, which is projected to rise to 13.7% by 2030.
- Europe is the second-largest regional segment for the market and is also projected to record the fastest CAGR of 6.48%, by value, during the forecast period, attributed to a rise in regional players catering to the surging demand by adopting distinct strategies like constant product innovation for highly potential end-user segments, like personal care and cosmetics. The growing popularity of collagen-based beauty drinks and collagen peptide-based beverages like Sanotact and BeautyHacker beauty collagen drinks in Germany contributes to this growth.
- Middle East & Africa is another promising market, as most consumers follow Islamic principles, thus creating opportunities for market players in the region to supply collagen sourced from halal sources or marine-based collagen/ With the introduction and implementation of religion-based policies, the demand is anticipated to increase, primarily to render flexibility for using collagen-based products. The marine-sourced collagen market in the Middle East and African regions is projected to record a CAGR of 7.47% and 8.21%, respectively, during the forecast period.
Global Collagen Market Trends
Healthy snacking preferences with growth in online platforms are supporting market growth
- Consumers worldwide increasingly embrace a snacking lifestyle with a heightened focus on health. This shift is evident in their preference for nutritious alternatives over traditional snacks. For instance, in June 2021, 25% of Gen Zs (16 to 24 years old) in the United Kingdom favored snacks labeled "low in calories," while 18% of millennials (25 to 34 years old) sought out high-protein options. Additionally, 36% of those over 55 actively sought snacks with "low" or "no sugar" content. Consequently, leading industry players have responded by introducing a variety of low-fat and low-calorie offerings.
- Furthermore, with users increasingly relying on social media for food trends and inspiration, platforms like Instagram and YouTube have emerged as crucial tools for discovering new snacks. Over 70% of global consumers, particularly Gen Zs and millennials, attributed their discovery of new snacks in 2022 to social media. The rise of online platforms has further streamlined the process, allowing consumers to explore and purchase a diverse range of snacks from the comfort of their homes.
- Also, premiumization is driving innovation innovation in the snacks segment, emphasizing fresh, better-for-you, and functional snacks. Bold, spicy flavors and exotic ingredients are gaining traction, appealing to a diverse global palate and fueling growth in regional markets. Snacking has transcended mere sustenance, becoming deeply ingrained in modern culture. It has become common to snack while working or enjoying entertainment at home. For example, a November 2022 report from Godrej Yummiez highlighted that 45% of Indian consumers favored snacking during parties and celebrations. This cultural shift highlights the transformation of snacking from a personal choice to a societal expectation.
Meat is majorly used as a raw material by collagen manufacturers
- Meat is an important source of nutrition for people around the world. Global demand for meat has grown over the past 50 years, with meat production tripling. Global produce presently stands at more than 350 million tonnes each year. Regionally, Asia-Pacific holds the position of being the largest meat producer, contributing a substantial portion of the total global meat production. This represents a significant shift from previous decades. Europe's meat output has also doubled in recent years. China is projected to account for most of the total increase in meat production, followed by the United States, Brazil, and India.
- The United States takes the crown as the top producer of beef and buffalo meat, with Brazil and China following suit. Noteworthy contributions also come from Argentina, Australia, and India. In the poultry realm, the United States leads the pack, with China and Brazil playing pivotal roles. As a collective, Europe matches the United States in its substantial poultry output. However, in high-income nations, where per capita meat consumption is already high, a plateau or even a decline in demand is foreseen. This shift is attributed to aging populations and evolving dietary preferences, emphasizing a broader protein palette.
- Expanding herds and flocks, especially in China, are underpinning global meat production's upward trajectory. This trend is set to bolster productivity, coupled with advancements in animal breeding and technology, particularly in low and middle-income nations. Poultry meat, in particular, is driving this surge in global meat production.
Collagen Industry Overview
The Collagen Market is fragmented, with the top five companies occupying 11.59%. The major players in this market are Darling Ingredients Inc., GELITA AG, Italgelatine SpA, Nippi. Inc. and Nitta Gelatin Inc. (sorted alphabetically).
Additional Benefits:
- The market estimate (ME) sheet in Excel format
- 3 months of analyst support
TABLE OF CONTENTS
1 EXECUTIVE SUMMARY & KEY FINDINGS
2 INTRODUCTION
- 2.1 Study Assumptions & Market Definition
- 2.2 Scope of the Study
- 2.3 Research Methodology
3 KEY INDUSTRY TRENDS
- 3.1 End User Market Volume
- 3.1.1 Baby Food and Infant Formula
- 3.1.2 Bakery
- 3.1.3 Beverages
- 3.1.4 Breakfast Cereals
- 3.1.5 Condiments/Sauces
- 3.1.6 Confectionery
- 3.1.7 Dairy and Dairy Alternative Products
- 3.1.8 Elderly Nutrition and Medical Nutrition
- 3.1.9 Meat/Poultry/Seafood and Meat Alternative Products
- 3.1.10 RTE/RTC Food Products
- 3.1.11 Snacks
- 3.1.12 Sport/Performance Nutrition
- 3.1.13 Animal Feed
- 3.1.14 Personal Care and Cosmetics
- 3.2 Protein Consumption Trends
- 3.2.1 Animal
- 3.3 Production Trends
- 3.3.1 Animal
- 3.4 Regulatory Framework
- 3.4.1 China
- 3.4.2 France
- 3.4.3 Germany
- 3.4.4 India
- 3.4.5 Italy
- 3.4.6 Japan
- 3.4.7 United Kingdom
- 3.4.8 United States
- 3.5 Value Chain & Distribution Channel Analysis
4 MARKET SEGMENTATION (includes market size in Value in USD and Volume, Forecasts up to 2030 and analysis of growth prospects)
- 4.1 Form
- 4.1.1 Animal Based
- 4.1.2 Marine Based
- 4.2 End User
- 4.2.1 Animal Feed
- 4.2.2 Food and Beverages
- 4.2.2.1 By Sub End User
- 4.2.2.1.1 Bakery
- 4.2.2.1.2 Beverages
- 4.2.2.1.3 Breakfast Cereals
- 4.2.2.1.4 Snacks
- 4.2.3 Personal Care and Cosmetics
- 4.2.4 Supplements
- 4.2.4.1 By Sub End User
- 4.2.4.1.1 Elderly Nutrition and Medical Nutrition
- 4.2.4.1.2 Sport/Performance Nutrition
- 4.3 Region
- 4.3.1 Africa
- 4.3.1.1 By Form
- 4.3.1.2 By End User
- 4.3.1.3 By Country
- 4.3.1.3.1 Nigeria
- 4.3.1.3.2 South Africa
- 4.3.1.3.3 Rest of Africa
- 4.3.2 Asia-Pacific
- 4.3.2.1 By Form
- 4.3.2.2 By End User
- 4.3.2.3 By Country
- 4.3.2.3.1 Australia
- 4.3.2.3.2 China
- 4.3.2.3.3 India
- 4.3.2.3.4 Indonesia
- 4.3.2.3.5 Japan
- 4.3.2.3.6 Malaysia
- 4.3.2.3.7 New Zealand
- 4.3.2.3.8 South Korea
- 4.3.2.3.9 Thailand
- 4.3.2.3.10 Vietnam
- 4.3.2.3.11 Rest of Asia-Pacific
- 4.3.3 Europe
- 4.3.3.1 By Form
- 4.3.3.2 By End User
- 4.3.3.3 By Country
- 4.3.3.3.1 Belgium
- 4.3.3.3.2 France
- 4.3.3.3.3 Germany
- 4.3.3.3.4 Italy
- 4.3.3.3.5 Netherlands
- 4.3.3.3.6 Russia
- 4.3.3.3.7 Spain
- 4.3.3.3.8 Turkey
- 4.3.3.3.9 United Kingdom
- 4.3.3.3.10 Rest of Europe
- 4.3.4 Middle East
- 4.3.4.1 By Form
- 4.3.4.2 By End User
- 4.3.4.3 By Country
- 4.3.4.3.1 Iran
- 4.3.4.3.2 Saudi Arabia
- 4.3.4.3.3 United Arab Emirates
- 4.3.4.3.4 Rest of Middle East
- 4.3.5 North America
- 4.3.5.1 By Form
- 4.3.5.2 By End User
- 4.3.5.3 By Country
- 4.3.5.3.1 Canada
- 4.3.5.3.2 Mexico
- 4.3.5.3.3 United States
- 4.3.5.3.4 Rest of North America
- 4.3.6 South America
- 4.3.6.1 By Form
- 4.3.6.2 By End User
- 4.3.6.3 By Country
- 4.3.6.3.1 Argentina
- 4.3.6.3.2 Brazil
- 4.3.6.3.3 Rest of South America
- 4.3.1 Africa
5 COMPETITIVE LANDSCAPE
- 5.1 Key Strategic Moves
- 5.2 Market Share Analysis
- 5.3 Company Landscape
- 5.4 Company Profiles (includes Global Level Overview, Market Level Overview, Core Business Segments, Financials, Headcount, Key Information, Market Rank, Market Share, Products and Services, and Analysis of Recent Developments).
- 5.4.1 ASAHI GELATINE INDUSTRIAL Co.,Ltd.
- 5.4.2 Darling Ingredients Inc.
- 5.4.3 Ewald-Gelatine GmbH
- 5.4.4 Foodchem International Corporation
- 5.4.5 GELITA AG
- 5.4.6 Italgelatine SpA
- 5.4.7 Jellice Pioneer Private Limited
- 5.4.8 Nippi. Inc.
- 5.4.9 Nitta Gelatin Inc.
6 KEY STRATEGIC QUESTIONS FOR PROTEIN INGREDIENTS INDUSTRY CEOS
7 APPENDIX
- 7.1 Global Overview
- 7.1.1 Overview
- 7.1.2 Porter's Five Forces Framework
- 7.1.3 Global Value Chain Analysis
- 7.1.4 Market Dynamics (DROs)
- 7.2 Sources & References
- 7.3 List of Tables & Figures
- 7.4 Primary Insights
- 7.5 Data Pack
- 7.6 Glossary of Terms
