


|
시장보고서
상품코드
1683777
아시아태평양의 앵커 및 그라우트 : 시장 점유율 분석, 산업 동향과 통계, 성장 예측(2025-2030년)Asia-Pacific Anchors and Grouts - Market Share Analysis, Industry Trends & Statistics, Growth Forecasts (2025 - 2030) |
||||||
■ 보고서에 따라 최신 정보로 업데이트하여 보내드립니다. 배송일정은 문의해 주시기 바랍니다.
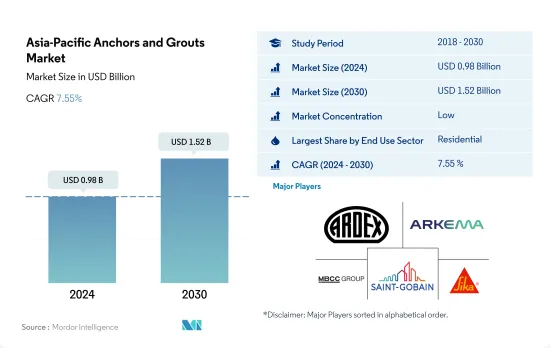
아시아태평양의 앵커 및 그라우트 시장 규모는 2024년에 9억 8,000만 달러에 달했고, 2030년에는 15억 2,000만 달러에 이를 것으로 예측되며, 예측 기간 중(2024년-2030년)의 CAGR은 7.55%를 보일 전망입니다.
예측 기간 동안 더 빠른 속도로 성장할 산업 및 기관 부문
- 2022년 연구 대상 시장은 주로 최종 사용자 부문의 건설 활동 감소로 인해 수요가 1.5% 감소했습니다. 그러나 2023년에는 건설 물량이 반등하여 2022년에 비해 앵커 및 그라우트 수요가 5.1% 급증할 것으로 예상됩니다.
- 아시아태평양의 앵커 및 그라우트 시장은 인구가 많은 주거 부문이 전 세계 전체의 절반 이상을 차지할 정도로 압도적인 비중을 차지하고 있습니다. 특히 중국은 2022년 이 지역 수요의 67%를 차지할 것으로 예상됩니다. 이러한 수요는 조인트 충진, 콘크리트 균열 보수, 구조물 보강 등 다양한 용도로 활용되면서 더욱 커지고 있습니다.
- 2022년에는 인프라 부문은 앵커와 그라우트의 두 번째로 큰 소비처로 부상했습니다. 이 지역 정부는 경제를 활성화하고 외국인 투자를 유치하기 위해 인프라 개발에 우선순위를 두고 있습니다. 예를 들어 인도의 2022년 인프라 지출은 전년 대비 3.1% 증가했으며, 2019년부터 2023년까지 약 1조 4,000억 달러를 인프라 프로젝트에 투자할 계획과 일치했습니다.
- 예측 기간(2023-2030년) 동안 산업 및 기관 부문은 8.82%의 연평균 성장률을 기록하며 시장 가치에서 가장 높은 성장을 보일 것으로 예상됩니다. 이러한 급증은 제조 공장, 교육 기관 및 의료 센터와 같은 시설의 건설이 확대되고 있기 때문일 수 있습니다. 이러한 추세는 도시 인구의 증가와 상대적으로 저렴한 인건비 및 토지 비용의 매력에 의해 촉진되고 있습니다. 예를 들어, 2023년에 중국 자동차 제조업체인 BYD는 베트남에서 전기 자동차 제조 및 조립에 대한 투자를 발표했습니다.
앵커 및 그라우트는 일본에서 수요가 높을 것으로 예상
- 앵앵커와 그라우트와 같은 건설용 화학 제품은 건물, 교량, 댐과 같은 구조물의 안정성, 강도, 수명을 향상시키는 데 중요한 역할을 합니다. 2022년 아시아태평양 앵커 및 그라우트 시장은 2021년에 비해 1.54% 감소했습니다. 중국이 가장 급격한 침체를 경험했고 앵커 및 그라우트 시장 가치는 2021-2022년에 걸쳐 4.94% 급락했습니다. 이러한 하락세는 정부의 엄격한 코로나19 제로 정책으로 인해 봉쇄령이 내려지고 건설 활동이 중단된 데 기인한 것으로 보입니다. 대조적으로 호주는 눈부신 상승을 보였으며 2021-2022년까지 18.40%의 성장률을 기록했습니다.
- 2022년에는 중국이 이 지역의 앵커 및 그라우트 시장을 석권하고 금액 기준으로 65%의 큰 시장 점유율을 차지했습니다. 인프라 투자의 급증은 특히 다양한 지역의 건설 벤처에서 앵커 및 그라우트 수요를 부추겼습니다. 중국의 교통 인프라에 대한 공공 투자는 2021년 1,576억 달러에서 2022년에는 1,656억 달러로 증가했습니다. 인프라 건설 부문은 2021-2022년에 걸쳐 5.60%의 플러스 성장하는 유일한 최종 용도 부문으로 부상했습니다.
- 일본의 앵커 및 그라우트 시장은 예측 기간 동안 8.09%라는 최고의 CAGR을 나타낼 것으로 예측되고 있습니다. 이 성장은 CAGR 9.23%로 예측되는 일본의 산업 및 기관 건설 섹터에 의한 것입니다. 2022-2030년간 산업 및 기관 건설을 위한 신규 바닥 면적은 1억 4,000만 평방피트 증가할 것으로 추정되며, 기업이 제조 시설을 일본으로 이전하는 동향도 함께 이러한 수요가 증가할 것으로 예상됩니다. 이러한 요인들은 특히 새로운 생산 유닛 건설에서 앵커와 그라우트에 대한 수요를 견인할 것으로 예상됩니다.
아시아태평양의 앵커 및 그라우트 시장 동향
인도와 같은 국가에서 소매 및 오피스 공간의 증가로 아시아태평양의 상업용 건축 부문에 활기
- 22022년 아시아태평양 지역의 상업용 신규 연면적은 전년 대비 3.23% 감소했습니다. 이러한 감소세는 규제 압박, 인플레이션 상승, 모기지 금리 급등과 같은 요인에 기인합니다. 2023년에는 이 지역이 회복되었고 상업시설의 신설 바닥 면적은 약 1억 4,600만 평방피트 증가했습니다. 이 급증은 주로 외국 직접투자(FDI) 증가로 인한 것으로, 새로운 오피스, 창고, 소매점, 기타 시설 수요에 박차를 가했습니다. 특히 베트남 건설 부문은 2023년 7,144만 달러의 FDI 자본을 유치했습니다.
- 2020년 아시아태평양 지역의 상업용 신축 면적은 2019년에 비해 21.92% 감소하며 큰 폭의 하락세를 보였습니다. 이러한 감소는 주로 정부의 광범위한 봉쇄 조치로 인해 프로젝트 작업이 중단되고 공급망, 장비, 노동력에 심각한 영향을 미쳤기 때문입니다. 그러나 규제가 완화됨에 따라 이 지역은 눈부신 회복을 보였으며 2021년 상업시설의 신설 바닥 면적은 20.98% 급증하여 약 5억 2,600만 평방피트의 바닥 면적에 이르렀습니다.
- 아시아태평양 지역의 상업용 신규 연면적은 크게 성장할 것으로 예상되며, 2023년에 비해 2030년에는 14억 1,000만 평방피트 증가할 것으로 추정됩니다. 이러한 급증은 쇼핑몰, 오피스 스페이스, 소매점 등에 대한 수요 증가에 힘입어지고 있습니다. 아시아태평양은 세계 소매 대국으로 부상하고 있으며 세계 소매 성장의 4분의 3에 기여하고 있습니다. 예를 들어, 인도의 학년 A 오피스 시장은 상위 7개 도시에서 2026년까지 10억 평방피트, 2030년까지 12억 평방피트로 확장될 수 있습니다. 전반적으로 아시아태평양 지역의 상업용 신규 면적은 예측 기간 동안 5.16%의 연평균 성장률을 보일 것으로 예상됩니다.
2030년까지 2,500만 가구에 달할 것으로 예상되는 인도와 같은 저렴한 주택의 증가는 이 지역의 주거용 건축을 증가시킬 것
- 2022년 아시아태평양 지역의 주거용 신축 면적은 전년 대비 약 5.39% 감소했습니다. 이러한 감소세는 코로나19 팬데믹 기간 동안 급증했던 건축 활동이 정상화되면서 나타난 결과입니다. 이 지역의 주거 부문은 인구 증가, 부의 증가, 급속한 도시화에 의해 주도되고 있습니다. 이 지역의 주거용 신규 연면적은 2023년에는 2022년 대비 4억 1,000만 평방피트 증가할 것으로 예상되었습니다.
- 2020년 아시아태평양 지역의 주거용 신규 면적은 2019년에 비해 약 5.06% 감소했습니다. 이는 주로 정부의 봉쇄 조치, 공급망 중단, 노동력 부족, 건설 생산성 저하, 외국인 투자 감소의 영향이 컸습니다. 그러나 제한이 완화되면서 이 지역은 2021년 신규 주거용 주택의 증가에 힘입어 주거용 신축 면적이 약 14억 평방피트 급증했습니다. 예를 들어, 2021년에만 인도의 주택 부동산 시장은 상위 7개 도시에서 약 16만 3,000개의 신축 주택을 도입합니다.
- 아시아태평양 지역의 주거용 신규 연면적은 예측 기간 동안 3.98%의 연평균 성장률을 보일 것으로 예상됩니다. 이러한 성장은 주택에 대한 수요, 투자 증가, 우호적인 정부 정책에 기인한 것으로 볼 수 있습니다. 보다 저렴한 주택 건설에 초점을 맞추면 이 지역의 주택 건설 부문이 활기를 되찾고 회복에 도움이 될 것으로 예상됩니다. 2030년까지는 인도 인구의 40% 이상이 도시에 거주할 것으로 예상되며, 2,500만 호의 저렴한 주택 수요가 예상됩니다. 이 수요가 급증함에 따라 인도의 주택 부동산 시장은 2030년까지 150만 호에 달할 것으로 예상됩니다.
아시아태평양의 앵커 및 그라우트 산업 개요
아시아태평양의 앵커 및 그라우트 시장은 세분화되어 상위 5개사에서 21.81%를 차지하고 있습니다. 이 시장 주요 기업은 다음과 같습니다. Ardex Group, Arkema, MBCC Group, Saint-Gobain and Sika AG(알파벳 순).
기타 혜택
- 엑셀 형식 시장 예측(ME) 시트
- 3개월의 애널리스트 지원
목차
제1장 주요 요약과 주요 조사 결과
제2장 보고서 제안
제3장 소개
- 조사의 전제조건과 시장 정의
- 조사 범위
- 조사 방법
제4장 주요 산업 동향
- 최종 용도 분야의 동향
- 상업
- 산업 및 기관
- 인프라
- 주거용
- 주요 인프라 프로젝트
- 규제 프레임워크
- 밸류체인과 유통채널 분석
제5장 시장 세분화 : 시장 규모, 성장 전망 분석(-2030년)
- 최종 용도 섹터
- 상업
- 산업 및 기관
- 인프라
- 주거용
- 하위 제품
- 시멘트 고정
- 수지 고정
- 기술별
- 에폭시 그라우트
- 폴리우레탄(PU) 그라우트
- 기타 유형
- 국가명
- 호주
- 중국
- 인도
- 인도네시아
- 일본
- 말레이시아
- 한국
- 태국
- 베트남
- 기타 아시아태평양
제6장 경쟁 구도
- 주요 전략 동향
- 시장 점유율 분석
- 기업 상황
- 기업 프로파일
- Ardex Group
- Arkema
- Cemkrete Inter Co., Ltd
- Fosroc, Inc.
- LATICRETE International, Inc.
- MAPEI SpA
- MBCC Group
- RPM International Inc.
- Saint-Gobain
- Sika AG
제7장 CEO에 대한 주요 전략적 질문 CEO에 대한 주요 전략적 질문
제8장 부록
- 세계 개요
- 개요
- Five Forces 분석 프레임워크(산업 매력도 분석)
- 세계의 밸류 체인 분석
- 시장 역학(DROs)
- 출처 및 참고문헌
- 도표 일람
- 주요 인사이트
- 데이터 팩
- 용어집
The Asia-Pacific Anchors and Grouts Market size is estimated at 0.98 billion USD in 2024, and is expected to reach 1.52 billion USD by 2030, growing at a CAGR of 7.55% during the forecast period (2024-2030).

Industrial and institutional sector to grow at a faster rate during the forecast period
- In 2022, the market studied witnessed a 1.5% decline in demand, primarily driven by a dip in construction activities across end-user sectors. However, the construction volume was projected to rebound in 2023, leading to a 5.1% surge in demand for anchors and grouts compared to 2022.
- The residential sector dominates the anchors and grouts market in Asia-Pacific, given its substantial population, accounting for over half of the global total. Notably, China alone represented 67% of the region's demand in 2022. The demand is fueled by various applications of these products, including joint filling, concrete crack repairs, and structural enhancements.
- In 2022, the infrastructure sector emerged as the second-largest consumer of anchors and grouts. Governments in the region prioritized infrastructure development to stimulate their economies and attract foreign investments. For instance, India's infrastructure spending in 2022 rose by 3.1% from the previous year, aligning with its plan to invest approximately USD 1.4 trillion in infrastructure projects between 2019 and 2023.
- During the forecast period (2023-2030), the industrial and institutional sector is projected to witness the highest growth in market value, boasting a CAGR of 8.82%. This surge can be attributed to the escalating construction of facilities like manufacturing plants, educational institutions, and healthcare centers. This trend is propelled by the expanding urban population and the appeal of relatively affordable labor and land costs. For instance, in 2023, Chinese automaker BYD Co. announced its investment in electric vehicle manufacturing and assembly in Vietnam.
High demand is forecasted for anchors and grouts in Japan as companies bring production units back home
- Construction chemicals like anchors and grouts play a crucial role in enhancing the stability, strength, and longevity of structures such as buildings, bridges, and dams. In 2022, the value of the anchors and grouts market in Asia-Pacific witnessed a slight decline of 1.54% compared to 2021. China experienced the sharpest downturn, with its anchors and grouts market value plummeting by 4.94% from 2021 to 2022. This decline can be attributed to the government's stringent zero-COVID policy, which led to lockdowns and halted construction activities. In contrast, Australia saw a remarkable upswing, registering a growth rate of 18.40% in value from 2021 to 2022.
- In 2022, China dominated the anchors and grouts market in the region, commanding a significant market share of 65% by value. The surge in infrastructure investments fueled the demand for anchors and grouts, especially in various regional construction ventures. China's public spending on transport infrastructure rose to USD 165.6 billion in 2022, up from USD 157.6 billion in 2021. The infrastructure construction segment emerged as the sole end-use sector in the country to witness a positive growth of 5.60% from 2021 to 2022.
- Japan's anchors and grouts market is projected to witness the highest CAGR of 8.09% during the forecast period. This growth can be attributed to the country's industrial and institutional construction sector, which is anticipated to witness a robust CAGR of 9.23%. There is an estimated surge of 140 million square feet in new floor area for I&I construction from 2022 to 2030, coupled with a trend of companies relocating their manufacturing facilities to Japan. These factors are expected to drive the demand for anchors and grouts, particularly in the construction of new production units.
Asia-Pacific Anchors and Grouts Market Trends
Rising retail and office spaces in countries such as India to boost the Asia-Pacific commercial construction sector
- In 2022, Asia-Pacific witnessed a 3.23% decline in its commercial new floor area compared to the previous year. This setback was attributed to factors such as regulatory pressures, higher inflation, and a surge in mortgage rates. In 2023, the region rebounded, with commercial construction new floor area increasing by approximately 146 million sq. ft. This surge was primarily driven by a rise in foreign direct investment (FDI), which spurred the demand for new offices, warehouses, retail outlets, and other facilities. Notably, the Vietnamese construction sector attracted an FDI capital of USD 71.44 million in 2023.
- In 2020, the Asia-Pacific region experienced a significant setback in commercial new floor area, with a volume decline of 21.92% compared to 2019. This decline was primarily due to widespread government lockdowns, which disrupted project work and severely impacted supply chains, equipment, and labor. However, as restrictions eased, the region witnessed a remarkable rebound, with its commercial new floor area surging by 20.98% in 2021, reaching a volume of approximately 526 million sq. ft.
- Asia-Pacific's commercial new floor area is projected to witness substantial growth, with an estimated increase of 1.41 billion sq. ft by 2030 compared to 2023. This surge is fueled by a rising demand for shopping malls, office spaces, retail outlets, and more. The Asia-Pacific region is emerging as a global retail powerhouse, contributing to nearly three-quarters of the worldwide retail growth. For instance, the Indian Grade A office market in its top seven cities may to expand to 1 billion sq. ft by 2026 and further to 1.2 billion sq. ft. by 2030. Overall, the commercial new floor area in Asia-Pacific is projected to witness a volume CAGR of 5.16% during the forecast period.
Rising affordable housing units, such as India's likely to reach 25 million by 2030, to augment the residential constructions in the region
- In 2022, the residential new floor area in the Asia-Pacific region saw a volume decline of approximately 5.39% from the previous year. This dip was a result of the sector normalizing after a surge in building activity during the COVID-19 pandemic. The region's residential sector is driven by a growing population, increasing wealth, and rapid urbanization. The residential new floor area in the region was expected to rise by 410 million sq. ft in 2023 compared to 2022.
- In 2020, the residential new floor area in Asia-Pacific declined in volume by around 5.06% compared to 2019. This was primarily due to government-imposed lockdowns, disruptions in the supply chain, labor shortages, reduced construction productivity, and low foreign investments. However, as restrictions eased, the region saw a significant rebound, with the residential new floor area surging by about 1.4 billion sq. ft in 2021, driven by the addition of new residential housing units. For instance, in 2021 alone, the Indian residential real estate market introduced approximately 163 thousand new residential units across its top seven cities.
- The residential new floor area in the Asia-Pacific region is projected to witness a CAGR of 3.98% during the forecast period. This growth can be attributed to the demand for housing, increased investments, and favorable government policies. The focus on constructing more affordable housing units is expected to rejuvenate the residential construction sector in the region, aiding its recovery. By 2030, it is estimated that over 40% of India's population will reside in urban areas, leading to a demand for an additional 25 million affordable housing units. This surge in demand is expected to push the Indian residential real estate market to reach 1.5 million units by 2030.
Asia-Pacific Anchors and Grouts Industry Overview
The Asia-Pacific Anchors and Grouts Market is fragmented, with the top five companies occupying 21.81%. The major players in this market are Ardex Group, Arkema, MBCC Group, Saint-Gobain and Sika AG (sorted alphabetically).
Additional Benefits:
- The market estimate (ME) sheet in Excel format
- 3 months of analyst support
TABLE OF CONTENTS
1 EXECUTIVE SUMMARY & KEY FINDINGS
2 REPORT OFFERS
3 INTRODUCTION
- 3.1 Study Assumptions & Market Definition
- 3.2 Scope of the Study
- 3.3 Research Methodology
4 KEY INDUSTRY TRENDS
- 4.1 End Use Sector Trends
- 4.1.1 Commercial
- 4.1.2 Industrial and Institutional
- 4.1.3 Infrastructure
- 4.1.4 Residential
- 4.2 Major Infrastructure Projects (current And Announced)
- 4.3 Regulatory Framework
- 4.4 Value Chain & Distribution Channel Analysis
5 MARKET SEGMENTATION (includes market size, forecasts up to 2030 and analysis of growth prospects.)
- 5.1 End Use Sector
- 5.1.1 Commercial
- 5.1.2 Industrial and Institutional
- 5.1.3 Infrastructure
- 5.1.4 Residential
- 5.2 Sub Product
- 5.2.1 Cementitious Fixing
- 5.2.2 Resin Fixing
- 5.2.2.1 By Technology
- 5.2.2.1.1 Epoxy Grout
- 5.2.2.1.2 Polyurethane (PU) Grout
- 5.2.3 Other Types
- 5.3 Country
- 5.3.1 Australia
- 5.3.2 China
- 5.3.3 India
- 5.3.4 Indonesia
- 5.3.5 Japan
- 5.3.6 Malaysia
- 5.3.7 South Korea
- 5.3.8 Thailand
- 5.3.9 Vietnam
- 5.3.10 Rest of Asia-Pacific
6 COMPETITIVE LANDSCAPE
- 6.1 Key Strategic Moves
- 6.2 Market Share Analysis
- 6.3 Company Landscape
- 6.4 Company Profiles
- 6.4.1 Ardex Group
- 6.4.2 Arkema
- 6.4.3 Cemkrete Inter Co., Ltd
- 6.4.4 Fosroc, Inc.
- 6.4.5 LATICRETE International, Inc.
- 6.4.6 MAPEI S.p.A.
- 6.4.7 MBCC Group
- 6.4.8 RPM International Inc.
- 6.4.9 Saint-Gobain
- 6.4.10 Sika AG
7 KEY STRATEGIC QUESTIONS FOR CONCRETE, MORTARS AND CONSTRUCTION CHEMICALS CEOS
8 APPENDIX
- 8.1 Global Overview
- 8.1.1 Overview
- 8.1.2 Porter's Five Forces Framework (Industry Attractiveness Analysis)
- 8.1.3 Global Value Chain Analysis
- 8.1.4 Market Dynamics (DROs)
- 8.2 Sources & References
- 8.3 List of Tables & Figures
- 8.4 Primary Insights
- 8.5 Data Pack
- 8.6 Glossary of Terms


샘플 요청 목록