


|
시장보고서
상품코드
1684069
인도의 앵커 및 그라우트 시장 : 점유율 분석, 산업 동향 및 통계, 성장 예측(2025-2030년)India Anchors and Grouts - Market Share Analysis, Industry Trends & Statistics, Growth Forecasts (2025 - 2030) |
||||||
■ 보고서에 따라 최신 정보로 업데이트하여 보내드립니다. 배송일정은 문의해 주시기 바랍니다.
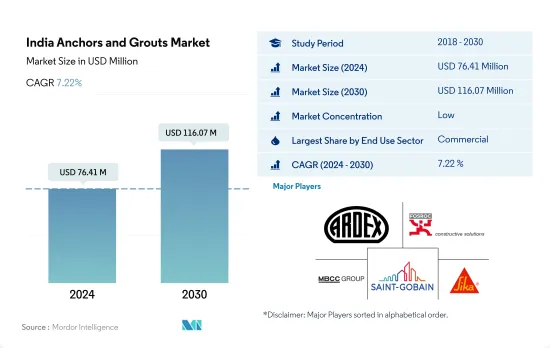
인도의 앵커 및 그라우트 시장 규모는 2024년 7,641만 달러로, 2030년에는 1억 1,607만 달러에 이를 것으로 예측되며, 예측 기간 중(2024-2030년) CAGR은 7.22%로 성장할 것으로 예측됩니다.

제조업이 성장함에 따라 산업 부문은 인도의 앵커 및 그라우트 시장에서 가장 빠르게 성장하는 최종 용도 부문이 될 것입니다.
- 2022년 시장 규모는 전년 대비 480만 달러 증가했는데 이는 최종 용도 부문 수요 증가를 반영하고 있습니다. 2025년에는 1조 4,000억 달러에 달할 것으로 예상되는 인도 건설 산업의 꾸준한 확대를 고려하여 인도 앵커 및 그라우트 시장은 2023년에 상당한 금액 증가를 기록할 것으로 예측됐습니다.
- 인도의 앵커와 그라우트의 주요 소비자는 여전히 상업 부문이며, 주된 이유는 현재 진행중인 새로운 건물의 건설입니다. 2022년 이 부문의 바닥면적은 약 4,700만 평방피트 증가했고, 이는 꾸준한 경제 성장의 반영입니다. 이 부서의 수리, 수리 및 내진 보강 용도의 요구도이 소비에 기여합니다.
- 주택 부문은 인도의 앵커와 그라우트의 주요 사용자이며 특히 타일의 눈을 감을 수 있습니다. 이것은 인도 주택에서 타일과 대리석 바닥재가 선호되는 것과 일치합니다. 인도는 세라믹 타일 생산량 2위이며, 2022년의 생산량은 약 23억 평방미터이기 때문에 타일 눈금용 그라우트 수요가 높은 것이 뒷받침되고 있습니다.
- 인도의 제조업, 헬스케어, 기술 개발, 교육 부문에서는 대규모 건설개발이 예상되고 있습니다. 예를 들어, 제조 부문은 2030년까지 1조 달러에 이를 것으로 예상되고, 2023년에는 인더스트리 4.0 기술에 대한 투자가 13억 달러에 달할 것으로 예상됩니다. 산업·시설 섹터는 예측기간 중(2023-2030년) CAGR 9.1%로 시장가치가 가장 급성장할 것으로 예측되고 있습니다.
인도 앵커 및 그라우트 시장 동향
인도 A등급 사무실 시장은 2030년까지 12억 평방 피트에 달해 상업 건축 부문 수요를 견인할 것으로 예상됩니다.
- 2022년, 인도의 신규 상업층 면적은 2021년 대비 6.2%의 성장을 보였습니다. 소매 부문, 특히 상위 7개 도시(델리 NCR, 방갈로르, 하이데라바드, 뭄바이, 푸네, 첸나이, 콜카타)에서는 왕성한 수요가 보였으며 몰 공간은 260만 평방 피트를 넘어 2021년에서 27% 증가했습니다. 2023년을 전망하면 외국 직접투자(FDI)의 급증이 새로운 사무실, 소매점, 기타 시설의 필요성을 부추겼으며, 이 섹터의 신규 바닥면적은 3,800만 평방피트 급증할 것으로 예상됩니다. 특히 2023년 건설개발에 대한 FDI 자본 유입액은 9,600만 달러에 달할 것으로 예측됐습니다.
- 2020년 인도 상업시설의 신설지면적은 2019년 대비 68.3% 감소했습니다. 이 감소는 주로 정부의 전국적인 봉쇄로 인해 진행중인 프로젝트가 중단되었고 공급망이 긴장되어 노동력 확보에 영향을 미쳤습니다. 그러나 2021년 규제가 완화되면 신규 바닥 면적이 약 5억 2,600만 평방 피트 급증하여 대폭적인 회복이 보였습니다. 게다가 2021년에는 그린 빌딩에 대한 노력이 현저하게 증가했고, 상업 프로젝트의 약 55%가 지속가능성을 도입하여 이 분야 수요를 더욱 밀어 올렸습니다.
- 2030년을 전망하면 인도 상업시설의 신설 바닥 면적은 3억 5,800만 평방 피트에 이를 것으로 예측되며, 2023년부터 크게 급증할 것으로 보입니다. 이러한 급증으로 쇼핑몰, 사무실 공간 및 기타 상업시설에 대한 수요가 증가하고 있습니다. 예를 들어, 상위 7개 도시에서 인도의 A등급 사무실 시장은 2026년까지 10억 평방 피트로 확대되고, 2030년까지는 12억 평방 피트로 확장될 것으로 예상됩니다. 그 결과, 이 나라의 상업시설의 신설 바닥 면적은 예측 기간 동안 CAGR 5.26%라는 견조한 성장을 기록할 전망입니다.
주택 수요 증가와 부동산 부문 확대로 주택 부문 수요 증가
- 2022년 인도의 주택 바닥 면적은 전년보다 9.4% 증가했습니다. 국내 주택 수요는 급증하고 상위 7개 도시(델리 NCR, 방갈로르, 하이데라바드, 뭄바이, 푸네, 첸나이, 콜카타)의 합계로 약 40만 2,000호가 새로 건설되어 2021년부터 44% 증가했습니다. 2023년 1분기에는 이 도시의 주택 판매 호수가 11.4만 호에 달했으며 전년부터 9.95만 호 이상이 급증했습니다. 그 결과 인도의 주택 신축상 면적은 2023년에는 2022년 대비 약 7,100만 평방 피트 확대될 것으로 예측됐습니다.
- 2020년 인도 주택 부문은 후퇴에 직면해 신설 바닥 면적은 전년 대비 6.25% 감소했습니다. 이 감소는 전국적인 봉쇄, 공급망 혼란, 노동력 부족, 건설 생산성 저하, 외국 투자 침체로 인한 것입니다. 그러나 2021년에는 인도의 주택 부동산 시장이 회복되어 상위 7개 도시에서 약 16만 3,000호의 신축 주택이 증가했습니다. 이러한 급증으로 2021년 주택 부문의 신설 바닥 면적은 2020년 대비 약 6억 4,900만 평방피트로 크게 증가했습니다.
- 앞으로 인도의 주택 부문은 2023년부터 2030년까지 수량 기준으로 연평균 복합 성장률(CAGR) 2.95%을 보여줄 전망입니다. 이 성장은 지속적인 주택 수요, 투자 증가, 유리한 정부 정책 때문입니다. 특히 2030년까지 인도 인구의 40% 이상이 도시에 거주하게 되어, 저렴한 주택이 약 2,500만호 추가되는 수요가 높아질 것으로 예측되고 있습니다. 게다가 2030년까지 주택용 부동산 시장은 주요 도시에서 150만호에 달할 것으로 예상되고 있으며, 이 분야 수요를 더욱 촉진하고 있습니다.
인도 앵커 및 그라우트 산업 개요
인도의 앵커 및 그라우트 시장은 세분화되어 상위 5개사에서 33.18%를 차지하고 있습니다. 이 시장 주요 기업은 다음과 같습니다. Ardex Group, Fosroc, Inc., MBCC Group, Saint-Gobain, Sika AG(알파벳순).
기타 혜택
- 엑셀 형식 시장 예측(ME) 시트
- 3개월의 애널리스트 서포트
목차
제1장 주요 요약과 주요 조사 결과
제2장 보고서 제안
제3장 소개
- 조사의 전제조건과 시장 정의
- 조사 범위
- 조사 방법
제4장 주요 산업 동향
- 최종 용도 섹터의 동향
- 상업
- 산업·시설
- 인프라
- 주택
- 주요 인프라 프로젝트(현재 및 발표됨)
- 규제 프레임워크
- 밸류체인과 유통채널 분석
제5장 시장 세분화(시장 규모, 2030년까지의 예측, 성장 전망 분석 포함)
- 최종 용도 섹터
- 상업
- 산업·시설
- 인프라
- 주택
- 서브제품
- 시멘트계 고정재
- 수지 고정
- 기술별
- 에폭시 그라우트
- 폴리우레탄(PU) 그라우트
- 기타 유형
제6장 경쟁 구도
- 주요 전략 동향
- 시장 점유율 분석
- 기업 상황
- 기업 프로파일
- Ardex Group
- Cera-Chem Pvt. Ltd.
- Don Construction Products Ltd.
- Fosroc, Inc.
- LATICRETE International, Inc.
- MAPEI SpA
- MBCC Group
- Saint-Gobain
- Sika AG
- Thermax Limited
제7장 CEO에 대한 주요 전략적 질문
제8장 부록
- 세계 개요
- 개요
- Porter's Five Forces 분석 프레임워크(산업 매력도 분석)
- 세계의 밸류체인 분석
- 시장 역학(DROs)
- 정보원과 참고문헌
- 도표 일람
- 주요 인사이트
- 데이터 팩
- 용어집
The India Anchors and Grouts Market size is estimated at 76.41 million USD in 2024, and is expected to reach 116.07 million USD by 2030, growing at a CAGR of 7.22% during the forecast period (2024-2030).
Owing to the growth in manufacturing industries, the industrial sector is likely to be the fastest-growing end-use sector for the Indian anchors and grouts market
- In 2022, the market value increased by USD 4.8 million compared to the previous year, reflecting the growing demand from end-use sectors. Considering the steady expansion of India's construction industry, which is expected to reach USD 1.4 trillion by 2025, the Indian anchors and grouts market was projected to record a significant increase in value in 2023.
- The commercial sector remains the primary consumer of anchors and grouts in India, largely due to the ongoing construction of new buildings. In 2022, the sector added approximately 47 million sq. ft of new floor area, a reflection of the steady economic growth. The sector's need for repair, restoration, and seismic strengthening applications also contributes to this consumption.
- The residential sector is another major user of anchors and grouts in India, particularly for tile joint filling. This is in line with the higher preference for tile or marble flooring in Indian homes. India's status as the second-largest producer of ceramic tiles, with a production volume of around 2.3 billion sq. m in 2022, underscores the high demand for tile joint grouts.
- Significant construction developments are expected in India's manufacturing, healthcare, skill development, and education sectors. The manufacturing sector, for example, is expected to reach a value of USD 1 trillion by 2030, with investments in Industry 4.0 technologies having been projected to reach USD 1.3 billion in 2023. The industrial and institutional sector is expected to experience the most rapid growth in market value, with a CAGR of 9.1% during the forecast period (2023-2030).
India Anchors and Grouts Market Trends
India's Grade A office market is expected to reach 1.2 billion sq. ft by 2030 and is likely to drive the demand for the commercial construction sector
- In 2022, India's new commercial floor area saw a 6.2% volume growth compared to 2021. The retail sector, particularly in the top seven cities (Delhi NCR, Bangalore, Hyderabad, Mumbai, Pune, Chennai, and Kolkata), witnessed robust demand, adding over 2.6 million sq. ft of mall space, a 27% increase from 2021. Looking ahead to 2023, the sector's new floor area is expected to surge by 38 million sq. ft, driven by a surge in foreign direct investment (FDI) fueling the need for new offices, retail outlets, and other facilities. Notably, the FDI equity inflow for construction development in 2023 was projected to hit USD 96 million.
- In 2020, India's commercial new floor area plummeted by 68.3% in volume compared to 2019. This decline was primarily due to a nationwide lockdown imposed by the government, which disrupted ongoing projects, strained supply chains, and impacted labor availability. However, as restrictions eased in 2021, the country witnessed a significant rebound, with the new floor area surging by approximately 526 million sq. ft. Additionally, 2021 saw a notable uptick in green building initiatives, with around 55% of commercial projects embracing sustainability, further bolstering the demand for the sector.
- Looking ahead to 2030, India's commercial new floor area is projected to hit 358 million sq. ft, a significant jump from 2023. This surge drives a growing appetite for shopping malls, office spaces, and other commercial facilities. For instance, India's Grade A office market in the top seven cities is set to expand to 1 billion sq. ft by 2026 and further to 1.2 billion sq. ft by 2030. Consequently, the country's commercial new floor area is poised to witness a robust CAGR of 5.26% during the forecast period.
Rise in demand for housing units and increasing real estate sector to boost residential sector demand
- In 2022, India witnessed a 9.4% growth in residential floor area, outpacing the previous year. The demand for housing in the country surged, with the top seven cities (Delhi NCR, Bangalore, Hyderabad, Mumbai, Pune, Chennai, and Kolkata) collectively adding approximately 402,000 new units, marking a 44% increase from 2021. In Q1 2023, housing sales in these cities reached 1.14 lakh units, a staggering jump of over 99,500 units from the previous year. Consequently, it was projected that the residential new floor area in India would expand by approximately 71 million sq. ft in 2023 compared to 2022.
- In 2020, the residential sector in India faced a setback, witnessing a 6.25% decline in new floor area compared to the previous year. This decline was attributed to the nationwide lockdown, disruptions in the supply chain, labor shortages, reduced construction productivity, and a dip in foreign investments. However, in 2021, the Indian residential real estate market rebounded, adding around 163,000 new residential units across the top seven cities. This surge translated into a significant increase of about 649 million sq. ft in the residential sector's new floor area in 2021 compared to 2020.
- Looking ahead, the residential sector in India is poised to exhibit a CAGR of 2.95% in terms of volume from 2023 to 2030. This growth can be attributed to sustained housing demand, increased investments, and favorable government policies. Notably, by 2030, it is projected that over 40% of India's population will reside in urban areas, driving a demand for approximately 25 million additional affordable housing units. Furthermore, by 2030, the residential real estate market is expected to hit 1.5 million units in key cities, further fueling the demand in the sector.
India Anchors and Grouts Industry Overview
The India Anchors and Grouts Market is fragmented, with the top five companies occupying 33.18%. The major players in this market are Ardex Group, Fosroc, Inc., MBCC Group, Saint-Gobain and Sika AG (sorted alphabetically).
Additional Benefits:
- The market estimate (ME) sheet in Excel format
- 3 months of analyst support
TABLE OF CONTENTS
1 EXECUTIVE SUMMARY & KEY FINDINGS
2 REPORT OFFERS
3 INTRODUCTION
- 3.1 Study Assumptions & Market Definition
- 3.2 Scope of the Study
- 3.3 Research Methodology
4 KEY INDUSTRY TRENDS
- 4.1 End Use Sector Trends
- 4.1.1 Commercial
- 4.1.2 Industrial and Institutional
- 4.1.3 Infrastructure
- 4.1.4 Residential
- 4.2 Major Infrastructure Projects (current And Announced)
- 4.3 Regulatory Framework
- 4.4 Value Chain & Distribution Channel Analysis
5 MARKET SEGMENTATION (includes market size, forecasts up to 2030 and analysis of growth prospects.)
- 5.1 End Use Sector
- 5.1.1 Commercial
- 5.1.2 Industrial and Institutional
- 5.1.3 Infrastructure
- 5.1.4 Residential
- 5.2 Sub Product
- 5.2.1 Cementitious Fixing
- 5.2.2 Resin Fixing
- 5.2.2.1 By Technology
- 5.2.2.1.1 Epoxy Grout
- 5.2.2.1.2 Polyurethane (PU) Grout
- 5.2.3 Other Types
6 COMPETITIVE LANDSCAPE
- 6.1 Key Strategic Moves
- 6.2 Market Share Analysis
- 6.3 Company Landscape
- 6.4 Company Profiles
- 6.4.1 Ardex Group
- 6.4.2 Cera-Chem Pvt. Ltd.
- 6.4.3 Don Construction Products Ltd.
- 6.4.4 Fosroc, Inc.
- 6.4.5 LATICRETE International, Inc.
- 6.4.6 MAPEI S.p.A.
- 6.4.7 MBCC Group
- 6.4.8 Saint-Gobain
- 6.4.9 Sika AG
- 6.4.10 Thermax Limited
7 KEY STRATEGIC QUESTIONS FOR CONCRETE, MORTARS AND CONSTRUCTION CHEMICALS CEOS
8 APPENDIX
- 8.1 Global Overview
- 8.1.1 Overview
- 8.1.2 Porter's Five Forces Framework (Industry Attractiveness Analysis)
- 8.1.3 Global Value Chain Analysis
- 8.1.4 Market Dynamics (DROs)
- 8.2 Sources & References
- 8.3 List of Tables & Figures
- 8.4 Primary Insights
- 8.5 Data Pack
- 8.6 Glossary of Terms


샘플 요청 목록