|
시장보고서
상품코드
1938994
탈크 : 시장 점유율 분석, 업계 동향과 통계, 성장 예측(2026-2031년)Talc - Market Share Analysis, Industry Trends & Statistics, Growth Forecasts (2026 - 2031) |
||||||
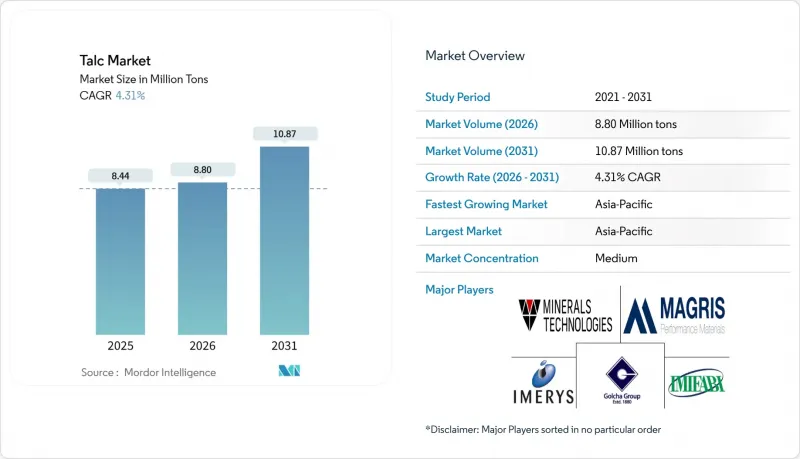
탈크 시장은 2025년 807만 톤에서 2026년에는 842만 톤으로 성장하며, 2026-2031년에 CAGR 4.29%로 추이하며, 2031년까지 1,039만 톤에 달할 것으로 예측되고 있습니다.
전기자동차 생산 증가, 포장의 지속가능성 목표 강화, 수성 도료로의 광범위한 전환이 활석 시장의 꾸준한 성장을 지원하고 있습니다. 고종횡비 활석 등급을 포함한 경량 폴리프로필렌 복합재가 전기자동차(EV)의 인테리어 패널과 배터리 하우징에서 유리섬유를 대체하고 있습니다. 한편, 식품 및 음료 제조업체에서는 GRAS(Generally Recognized as Safe) 인증을 획득한 탈크를 천연 가공 보조제로 채택하고 있습니다. 연간 생산량 3만 5,000톤 규모의 우후 공장에 대한 이멜리스의 투자는 용도 특화형 제품에 대한 집중을 보여줍니다. 동시에 광석 선별 기술을 통한 자원 이용률 향상은 규제 강화에 따른 비용 압박에 대응할 수 있도록 생산자에게 도움을 주고 있습니다.
세계 활석 시장 동향 및 전망
전기자동차(EV) 및 전기 모빌리티용 폴리머의 경량화 요구
자동차 제조업체들은 유리섬유 강화 폴리프로필렌을 탈크 강화 컴파운드로 대체함으로써 강성을 유지하면서 비용과 밀도를 줄이고 15-25%의 경량화를 목표로 하고 있습니다. 고종횡비 등급은 더 얇고 치수 안정성이 우수한 내부 패널과 배터리 인클로저를 가능하게 하므로 활석 시장은 혜택을 누리고 있습니다. 이메리스 HAR 제품은 인장탄성률 향상에 최적화된 설계된 판상 형태가 특징입니다. 적재량 유지가 요구되는 상용 밴을 포함한 전 세계 EV 플랫폼의 보급으로 특수 탈크 등급의 잠재적 수요 톤수는 확대되고 있습니다. 중국 및 미국 정부의 무공해 규제는 이러한 모멘텀을 더욱 촉진하고 있습니다. 컴파운딩 기술과 폴리프로필렌 배합에 대한 전문성을 갖춘 공급업체는 탈크 시장에서 프리미엄 마진을 확보할 수 있습니다.
아시아에서 수성 건축용 도료로의 전환
중국과 인도의 저 VOC 규제 강화로 인해 페인트 제조업체들은 점도 조절과 은폐력 향상을 위해 활석을 필요로 하는 수성 도료로 전환하고 있습니다. 표면 처리된 탈크는 안료의 부유 및 침강을 방지하고 광택을 유지하면서 이산화티타늄을 비용 효율적으로 대체할 수 있습니다. 이들 개질 등급은 탈크 시장에서 20-30%의 가격 상승이 예상되며, 분쇄 및 가공 비용 증가에도 불구하고 이익률 향상이 기대됩니다. 동남아시아 전역의 도시화가 진행되고 신규 주택 착공이 증가함에 따라 중급 건축용 도료에 대한 수요가 확대되고 있습니다. 현지에 공장을 보유한 다국적 페인트 제조업체는 분산 사양을 확실히 충족시킬 수 있는 탈크 공급업체와 장기적인 인수 계약을 체결하고 있습니다.
석면 관련 소송의 유산
존슨앤드존슨이 제안한 80억-100억 달러의 합의안은 지속적인 책임 리스크의 존재를 부각시켜 화장품 등급 수요를 계속 억제하고 있습니다. 미국 식품의약국(FDA)의 새로운 의무 시험 규정으로 인해 중소 가공업체들의 컴플라이언스 비용이 증가하고 있습니다. 세계보건기구(WHO)가 직업적 노출에 따라 탈크를 '발암 우려 물질'로 재분류하면서 감시가 강화되고 있습니다. 이러한 요인들로 인해 탈크 시장은 종합적인 광물학적 스크리닝을 수행하는 공급업체와 산업용 틈새 시장으로 밀려난 공급업체로 양분되어 있습니다. 보험료는 지속적으로 상승하고 있으며, 이익률을 더욱 압박하고 있습니다.
부문 분석
탄산탈크는 2025년 기준 탈크 시장 규모의 61.92%를 차지하며 이 부문을 주도했습니다. 인도와 중국의 풍부한 매장량과 고처리량 범용 제품 등급에 적합한 가공 비용 구조가 기여하고 있습니다. 염화탈크는 공급량이 적고, 열 안정성이 자동차 보닛 내부 부품 및 전자 부품에 적합하여 CAGR 4.76%로 수요가 확대되고 있습니다. 기계 화학적 활성화 기술을 활용하는 공급업체는 표면 에너지와 입자 길이 비율을 사용자 사양에 맞게 조정할 수 있으며, 수익성이 낮은 광상의 탄산염 광석에서도 중급 응용 분야에서 경쟁력을 확보할 수 있습니다. 제트밀을 통한 미세 분쇄에 대한 투자도 마찬가지로 중요하며, 거친 입자의 원료를 고광택 코팅에 필수적인 2마이크로미터 미만의 미세 분말로 변환합니다.
초미세 및 미세 층상 형태에 대한 지속적인 연구개발로 인해 광상 유형의 전통적 경계가 모호해져 탄산염 광산이 일부 용도에서 녹泥石 등급을 대체할 수 있는 가능성이 생겼습니다. 그러나 잔류 광물 함량에 대한 규제적 역풍으로 인해, 저불순물을 요구하는 OEM(Original Equipment Manufacturer)에게는 녹泥石이 풍부한 광석이 매력적입니다. 따라서 탈크 시장은 비용 중심의 탄산염 광석이 대량 응용 분야를 지배하는 반면, 가치 중심의 녹泥石이 프리미엄 틈새 시장에서 점유율을 확대하고 있습니다.
본 활석 시장 보고서는 광상 유형별(탄산탈크 및 녹泥石탈크), 최종사용자 산업별(플라스틱/고무, 페인트/코팅, 세라믹, 펄프/종이, 퍼스널케어/화장품, 식품 및 음료, 기타 산업), 지역별(아시아태평양, 북미, 유럽, 남미, 중동/아프리카)로 분석했습니다. 분석했습니다. 시장 예측은 톤 단위로 제공됩니다.
지역별 분석
아시아태평양은 2025년 활석 시장 규모의 53.10%를 차지할 것으로 예상되며, 2031년까지 연평균 5.18%의 연평균 복합 성장률(CAGR)을 보일 것으로 예측됩니다. 이는 인도가 전 세계 생산량의 25%를 차지한다는 점과 중국의 가공업체와 하류 플라스틱 수출업체를 연결하는 통합된 공급망에 힘입은 바 큽니다. 중국, 일본, 한국 등 국내 EV 제조에는 초미세 탈크 마스터배치가 필요하며, 고종횡비 등급의 현지 수요를 확보하고 있습니다. 동시에 동남아시아의 건설 붐은 저휘발성 유기화합물(VOC) 배합에 대한 규제 추세에도 불구하고 페인트 등급 수요를 증가시키고 있습니다.
북미는 전략적으로 중요하며, OEM(Original Equipment Manufacturer)의 경량화 정책이 프리미엄급 소비를 지원하고 있습니다. 그러나 탈크 화장품에 대한 소비자들의 신중한 태도와 신규 광산의 환경 허가 장벽으로 인해 성장률은 한 자릿수에 그칠 것으로 예측됩니다. 날씨로 인한 공급 장애로 인해 리스크가 부각되고 있으며, 다운스트림 바이어들은 탈크 시장 접근 안정화를 위해 여러 지역으로 공급처를 분산하는 움직임을 보이고 있습니다.
유럽에서는 결정질 실리카에 대한 규제 강화와 REACH 개정안으로 인해 시험 비용 상승과 산업 사용자를 위한 조달 기준의 재검토가 예상됩니다. 독일과 프랑스 바이어들은 이미 ESG(환경-사회-지배구조) 감사를 요구하고 있으며, 저탄소 공급원에 대한 수요 증가가 예상됩니다. 남미와 중동 및 아프리카에서는 건설 및 소비재 생산이 증가하는 추세이지만, 물류 분산화와 현지 가공 능력의 부족은 여전히 지역 시장 확대를 제약하고 있습니다. 이들 지역을 타겟으로 하는 투자자들은 기술 노하우를 확보하기 위해 기존 유럽 또는 아시아 가공업체와 합작회사를 설립하는 경우가 많습니다.
기타 특전:
- 엑셀 형식 시장 예측(ME) 시트
- 애널리스트의 3개월간 지원
자주 묻는 질문
목차
제1장 서론
제2장 조사 방법
제3장 개요
제4장 시장 구도
제5장 시장 규모와 성장 예측
제6장 경쟁 구도
제7장 시장 기회와 향후 전망
KSA 26.03.05The Talc market is expected to grow from 8.07 million tons in 2025 to 8.42 million tons in 2026 and is forecast to reach 10.39 million tons by 2031 at 4.29% CAGR over 2026-2031.

Rising electric-vehicle production, stricter packaging sustainability targets, and a broad shift to water-based coatings keep the talc market on a steady upward path. Lightweight polypropylene compounds containing high-aspect-ratio talc grades are replacing glass fiber in electric vehicle (EV) interior panels and battery housings, while food and beverage firms are adopting Generally Recognized as Safe (GRAS)-certified talc as a natural processing aid. Investments such as Imerys' 35,000 tpa Wuhu plant underline the emphasis on application-specific products. Simultaneously, ore-sorting technology is lifting resource utilization, helping producers offset cost pressures tied to tightening regulatory frameworks.
Global Talc Market Trends and Insights
Light-weighting Demand from EV and E-mobility Polymers
Automakers are targeting 15-25% weight cuts by substituting glass-fiber polypropylene with talc-reinforced compounds that preserve stiffness while trimming cost and density. The talc market benefits because high-aspect-ratio grades support thinner, dimensionally stable interior panels and battery enclosures. Imerys' HAR products emphasize engineered plate-like morphologies optimized for tensile modulus improvement. Global EV platform proliferation, including commercial vans that demand payload retention, extends the addressable tonnage for specialty talc grades. Government zero-emission mandates in China and the U.S. further anchor this momentum. Suppliers with compounding knowledge and polypropylene formulation expertise thus capture premium margins in the talc market.
Shift to Water-based Architectural Paints in Asia
Stricter low-VOC rules in China and India push formulators toward water-borne coatings that need talc for viscosity control and hiding power. Surface-treated talc prevents pigment flooding and sedimentation, enabling cost-effective substitution for titanium dioxide while keeping gloss intact. The talc market sees 20-30% price uplifts for these modified grades, creating margin headroom despite higher grinding and treatment expenses. Urbanization across Southeast Asia is swelling new housing starts, expanding demand for mid-tier architectural paints. Multinational paint companies with regional plants are securing long-term offtake agreements with talc suppliers that can meet dispersion specifications reliably.
Litigation Legacy of Asbestos-related Claims
Johnson & Johnson's proposed USD 8-10 billion settlement underscores persistent liability overhang and keeps cosmetic-grade demand subdued. The FDA has outlined new mandatory testing rules, escalating compliance costs for smaller processors. The WHO's reclassification of talc to "probably carcinogenic" based on occupational exposure intensifies scrutiny. Collectively, these factors split the talc market between suppliers with full-spectrum mineralogical screening and those relegated to industrial niches. Insurance premiums continue to climb, further narrowing margins.
Other drivers and restraints analyzed in the detailed report include:
- Food-grade Talc Uptake in Gum Base and Meat Coatings
- AI-enabled Ore-sorting Boosting Ore Recovery Rates
- Bio-based Fillers Replacing Talc in Premium Papers
For complete list of drivers and restraints, kindly check the Table Of Contents.
Segment Analysis
Talc carbonate led the segment with 61.92% of the Talc market size in 2025, benefiting from abundant reserves in India and China and a processing cost structure that favors high-throughput commodity grades. Talc chlorite, though less available, is gaining traction at a 4.76% CAGR because its thermal stability suits under-hood automotive and electronics parts. Suppliers exploiting mechanochemical activation now tailor surface energy and particle aspect ratio to user specifications, enabling carbonate ore from marginal deposits to compete in mid-range applications. Investment in jet-mill fine grinding is equally pivotal, turning coarse feedstock into sub-2 µm powders critical for high-gloss coatings.
Continued R&D on ultrafine, micro-lamellar morphologies blurs traditional boundaries between deposit types, letting carbonate mines displace chlorite grades in some roles. Yet, regulatory headwinds related to residue mineral content make chlorite-rich ore attractive for OEMs demanding low impurities. The talc market, therefore, tracks a dual trajectory: cost-driven carbonate volumes dominate mass applications, while value-driven chlorite captures incremental share in premium niches.
The Talc Market Report is Segmented by Deposit Type (Talc Carbonate and Talc Chlorite), End-User Industry (Plastics and Rubber, Paints and Coatings, Ceramics, Pulp and Paper, Personal Care and Cosmetics, Food and Beverage, and Other Industries), and Geography (Asia-Pacific, North America, Europe, South America, and Middle East and Africa). The Market Forecasts are Provided in Terms of Volume (Tons).
Geography Analysis
Asia-Pacific commanded 53.10% of the Talc market size in 2025 and is projected to grow at a 5.18% CAGR through 2031, supported by India's 25% global production share and integrated supply chains linking Chinese processors to downstream plastics exporters. Domestic EV manufacturing in China, Japan, and South Korea requires ultrafine talc masterbatches, ensuring local offtake for high-aspect-ratio grades. Simultaneously, booming construction in Southeast Asia increases paint-grade demand despite regulatory moves toward low-VOC (Volatile Organic Compound) formulations.
North America remains strategically important, with original equipment manufacturer (OEM) lightweighting initiatives sustaining premium-grade consumption. Nonetheless, cautious consumer sentiment around talc cosmetics and environmental approval hurdles for new mines hold growth to mid-single digits. Weather-induced disruptions highlight supply risks, prompting downstream buyers to diversify procurement across multiple regions to stabilize talc market access.
Europe's stricter crystalline silica protocols and pending REACH revisions will likely raise testing costs and reshape purchasing criteria for industrial users. Buyers in Germany and France already request Environmental, Social, and Governance (ESG) audits, boosting prospects for low-carbon supply streams. South America and the Middle East & Africa show rising construction and consumer-goods output, yet fragmented logistics and limited local processing still constrain regional talc market scalability. Investors targeting these regions often form joint ventures with established European or Asian processors to lock in technological know-how.
- AKJ MinChem
- ANAND TALC
- Chanda Minerals
- CIMBAR PERFORMANCE MINERALS
- euroMinerals GmbH
- Golcha Group
- Hayashi-Kasei
- Imerys
- IMI Fabi SpA
- LITHOS Industrial Minerals GmbH
- Magris Performance Materials
- Minerals Technologies Inc.
- Nippon Talc Co., Ltd.
- Sibelco
Additional Benefits:
- The market estimate (ME) sheet in Excel format
- 3 months of analyst support
TABLE OF CONTENTS
1 Introduction
- 1.1 Study Assumptions and Market Definition
- 1.2 Scope of the Study
2 Research Methodology
3 Executive Summary
4 Market Landscape
- 4.1 Market Overview
- 4.2 Market Drivers
- 4.2.1 Light-weighting Demand from EV and E-mobility Polymers
- 4.2.2 Shift to Water-based Architectural Paints in Asia
- 4.2.3 Food-grade Talc Uptake in Gum Base and Meat Coatings
- 4.2.4 AI-enabled Ore-sorting Boosting Ore Recovery Rates
- 4.2.5 Low-carbon talc Grades for ESG-scoped Procurement
- 4.3 Market Restraints
- 4.3.1 Litigation Legacy of Asbestos-related Claims
- 4.3.2 Bio-based Fillers Replacing Talc in Premium Papers
- 4.3.3 High-purity Ore Shortages in Europe Post-Finnish Strike
- 4.4 Value Chain Analysis
- 4.5 Porter's Five Forces
- 4.5.1 Bargaining Power of Suppliers
- 4.5.2 Bargaining Power of Consumers
- 4.5.3 Threat of New Entrants
- 4.5.4 Threat of Substitutes
- 4.5.5 Degree of Competition
5 Market Size and Growth Forecasts (Volume)
- 5.1 By Deposit Type
- 5.1.1 Talc Carbonate
- 5.1.2 Talc Chlorite
- 5.2 By End-user Industry
- 5.2.1 Plastics and Rubber
- 5.2.2 Paints and Coatings
- 5.2.3 Ceramics
- 5.2.4 Pulp and Paper
- 5.2.5 Personal Care and Cosmetics
- 5.2.6 Food and Beverage
- 5.2.7 Other Industries
- 5.3 By Geography
- 5.3.1 Asia-Pacific
- 5.3.1.1 China
- 5.3.1.2 India
- 5.3.1.3 Japan
- 5.3.1.4 South Korea
- 5.3.1.5 Rest of Asia-Pacific
- 5.3.2 North America
- 5.3.2.1 United States
- 5.3.2.2 Canada
- 5.3.2.3 Mexico
- 5.3.3 Europe
- 5.3.3.1 Germany
- 5.3.3.2 United Kingdom
- 5.3.3.3 France
- 5.3.3.4 Italy
- 5.3.3.5 Spain
- 5.3.3.6 Rest of Europe
- 5.3.4 South America
- 5.3.4.1 Brazil
- 5.3.4.2 Argentina
- 5.3.4.3 Rest of South America
- 5.3.5 Middle East and Africa
- 5.3.5.1 Saudi Arabia
- 5.3.5.2 South Africa
- 5.3.5.3 Rest of Middle East and Africa
- 5.3.1 Asia-Pacific
6 Competitive Landscape
- 6.1 Market Concentration
- 6.2 Strategic Moves
- 6.3 Market Share (%)/Ranking Analysis
- 6.4 Company Profiles (includes Global level Overview, Market level overview, Core Segments, Financials as available, Strategic Information, Market Rank/Share, Products and Services, Recent Developments)
- 6.4.1 AKJ MinChem
- 6.4.2 ANAND TALC
- 6.4.3 Chanda Minerals
- 6.4.4 CIMBAR PERFORMANCE MINERALS
- 6.4.5 euroMinerals GmbH
- 6.4.6 Golcha Group
- 6.4.7 Hayashi-Kasei
- 6.4.8 Imerys
- 6.4.9 IMI Fabi SpA
- 6.4.10 LITHOS Industrial Minerals GmbH
- 6.4.11 Magris Performance Materials
- 6.4.12 Minerals Technologies Inc.
- 6.4.13 Nippon Talc Co., Ltd.
- 6.4.14 Sibelco
7 Market Opportunities and Future Outlook
- 7.1 White-space and Unmet-Need Assessment