|
시장보고서
상품코드
1685843
북미의 엔지니어링 플라스틱 : 시장 점유율 분석, 산업 동향 및 통계, 성장 예측(2024-2029년)North America Engineering Plastics - Market Share Analysis, Industry Trends & Statistics, Growth Forecasts (2024 - 2029) |
||||||
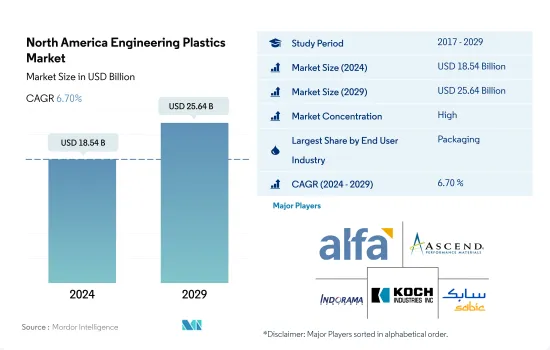
북미의 엔지니어링 플라스틱 시장 규모는 2024년에 185억 4,000만 달러에 달했습니다. 2029년에는 256억 4,000만 달러에 이를 것으로 예상되고, 예측 기간 중(2024-2029년)의 CAGR은 6.70%를 나타낼 것으로 전망됩니다.

포장업계는 전기 및 전자업계에 수량 점유율을 빼앗깁니다.
- 엔지니어링 플라스틱의 용도는 항공우주의 내장벽 패널이나 문에서 경질·연질 포장까지 다양합니다. 북미의 엔지니어링 플라스틱 시장은 포장, 전기 및 전자, 자동차 등 산업이 견인하고 있습니다. 2022년 엔지니어링 플라스틱 시장의 매출은 포장이 약 31.35%, 전기 및 전자가 약 17.43%를 차지했습니다.
- 세계적으로 가족의 인원수가 줄어들고, 도시화와 가족의 인구동태가 크게 변화하고 있기 때문에 이 지역에서는 포장이 최대의 최종 사용자 산업이 되고 있습니다. 이러한 요인으로 인해 기능적이고 포장된 편리한 식품에 대한 수요가 높아지고 있습니다. 북미의 2022년 플라스틱 포장 생산량은 2,240만 톤으로 세계 전체의 16.6%를 차지했습니다. 이 지역의 엔지니어링 플라스틱에 대한 수요는 포장 식품 및 식품 및 식품에 대한 소비자 수요 증가에 따라 증가하고 있습니다.
- 전기 및 전자 부문은 이 지역에서 두 번째로 크고, 특히 미국에서는 큽니다. 이 부문은 GDP의 1.6%를 차지합니다. 2022년에는 이 지역에서 5,761억 달러의 매출을 계상해, 전기 및 전자 기기에 대한 수요를 증대시키는 것과 동시에, 전기자동차, 자율형 로봇, 극비 방위 기술의 등장을 뒷받침해, 엔지니어링 플라스틱 수요를 밀어 올렸습니다.
- 전기 및 전자산업은 다양한 전기 및 전자용도에서 플라스틱 복합재료의 필요성으로 인해 엔지니어링 플라스틱의 용도가 증가하고 있기 때문에 수익과 예측기간(2023-2029년)의 CAGR은 8.54%를 나타낼 것으로 예측되어 이 지역에서 가장 급성장하고 있습니다.
기술 혁신과 함께, 진화하는 소비자 동향과 산업 동향이 엔지니어링 플라스틱 수요를 높일 수 있습니다.
- 2022년 세계의 엔지니어링 플라스틱 소비 점유율은 북미가 15%를 차지했습니다. 엔지니어링 플라스틱은 범용성이 높은 특성을 나타내기 때문에 자동차, 포장, 전기 및 전자 산업에서 용도가 발견되고 있습니다.
- 미국은 2022년 금액 기준으로 전년 대비 7.14%의 성장을 기록했는데, 이는 포장 산업과 전기 및 전자 산업에 의한 것으로, 각각 금액 기준으로 시장 점유율의 27%와 24%를 차지했습니다. 곧 먹을 수 있는 편의점 수요가 증가하고, 외출이 많은 라이프 스타일의 동향이 대두하고 있기 때문에 포장 자재의 소비량이 증가하고 있어, 이 지역의 엔지니어링 플라스틱의 판매 동향을 뒷받침하고 있습니다. 기업이 재택근무모델을 채용해 사람들이 홈오피스를 갖추게 되면서 전자기기 수요도 증가했습니다. 기술 혁신은 또한 전자 기기에 대한 안정적인 수요를 매년 생산하고 있습니다.
- 멕시코는 가장 급성장하고 있는 시장으로, 2022년에는 금액 기준으로 2021년 대비 10.53%의 성장을 기록해 산업기계·설비산업이 견인했습니다. 멕시코는 고속도로 정비, 항만 근대화, 농장의 기계화에 의한 확대를 목표로 하고 있으며, 건설기계와 농업기계 수요를 밀어 올리고 있습니다.
- 북미 엔지니어링 플라스틱 시장은 예측 기간 동안 CAGR 6.62%를 나타낼 것으로 예상되며, 그 중에서도 전기 및 전자 산업은 금액 기준으로 CAGR 8.54%로 가장 높은 CAGR을 기록할 것으로 예측됩니다. 첨단 재료, 유기 전자, 소형화, AI 및 IoT와 같은 파괴적인 기술의 사용은 또한 스마트 제조 방법의 채택을 뒷받침하고 업계의 성장을 가속할 수 있습니다.
북미의 엔지니어링 플라스틱 시장 동향
기술 혁신의 강력한 성장이 업계 전반의 성장을 가속
- 북미의 전기 및 전자기기 생산은 스마트 TV, 냉장고, 에어컨 등 가전제품 수요 증가와 함께 기술의 진보로 2017년부터 2019년에 걸쳐 CAGR이 1.4%를 넘었습니다. 전자 기술 혁신의 급속한 속도는 보다 새롭고 빠른 전자 제품에 대한 수요를 촉진하고 있습니다. 그 결과 이 지역의 전기 및 전자기기 생산도 증가하고 있습니다.
- 북미의 전자기기 매출은 생산시설의 운영 정지, 공급망의 혼란 등 다양한 제약으로 인해 COVID-19의 영향으로 2020년에는 2019년 대비 약 9% 감소했습니다. 그 결과, 이 지역의 전기 및 전자기기 생산에 의한 수익은 2020년에 전년대비 4.7% 감소했습니다.
- 2021년에는 이 지역의 소비자용 전자기기 매출액이 약 1,130억 달러에 달했으며 2020년보다 4% 증가했습니다. 그 결과 북미의 전기 및 전자기기 생산은 2021년 전년 대비 13.8% 증가했습니다.
- 2027년에는 북미는 전기 및 전자기기 생산에서 제3위의 지역이 되어 세계 시장의 약 10.5%의 점유율을 차지할 것으로 예측되고 있습니다. 효율성과 저렴한 비용을 실현하기 위해 가상현실, IoT 솔루션, 로봇 공학 등의 첨단 기술이 가전제품에 등장한 것은 가전 산업에 큰 이점을 제공합니다. 이 지역의 가전 산업은 2023년 1,276억 달러에서 2027년에는 약 1,618억 달러 규모에 이를 것으로 예측됩니다. 그 결과, 이 지역의 전기 및 전자제품에 대한 수요는 증가할 것으로 예측됩니다.
북미의 엔지니어링 플라스틱 산업의 개요
북미의 엔지니어링 플라스틱 시장은 상당히 통합되어 있으며 상위 5개사에서 68.68%를 차지하고 있습니다. 이 시장 주요 기업은 다음과 같습니다. Alfa SAB de CV, Ascend Performance Materials, Indorama Ventures Public Company Limited, Koch Industries, Inc. and SABIC(알파벳순 정렬).
기타 혜택
- 엑셀 형식 시장 예측(ME) 시트
- 3개월의 애널리스트 서포트
목차
제1장 주요 요약과 주요 조사 결과
제2장 보고서 제안
제3장 소개
- 조사의 전제조건과 시장 정의
- 조사 범위
- 조사 방법
제4장 주요 산업 동향
- 최종 사용자 동향
- 항공우주
- 자동차
- 건축 및 건설
- 전기 및 전자
- 포장
- 수출입 동향
- 플루오로폴리머 무역
- 폴리아미드(PA) 무역
- 폴리카보네이트(PC) 무역
- 폴리에틸렌 테레프탈레이트(PET) 무역
- 폴리메틸 메타크릴레이트(PMMA) 무역
- 폴리옥시메틸렌(POM) 무역
- 스티렌 공중합체(ABS 및 SAN) 무역
- 가격 동향
- 재활용 동향
- 폴리아미드(PA) 재활용 동향
- 폴리카보네이트(PC) 재활용 동향
- 폴리에틸렌 테레프탈레이트(PET) 재활용 동향
- 스티렌 공중합체(ABS 및 SAN) 재활용 동향
- 규제 프레임워크
- 캐나다
- 멕시코
- 미국
- 밸류체인과 유통채널 분석
제5장 시장 세분화
- 최종 사용자 산업
- 항공우주
- 자동차
- 건축 및 건설
- 전기 및 전자
- 산업 및 기계
- 포장
- 기타 최종 사용자 산업
- 수지 유형
- 플루오로폴리머
- 하위 수지 유형별
- 에틸렌테트라플루오로에틸렌(ETFE)
- 불소화 에틸렌-프로필렌(FEP)
- 폴리테트라플루오로에틸렌(PTFE)
- 폴리비닐플루오라이드(PVF)
- 폴리비닐리덴 플루오라이드(PVDF)
- 기타 하위 수지 유형
- 액정 폴리머(LCP)
- 폴리아미드(PA)
- 하위 수지 유형별
- 아라미드
- 폴리아미드(PA) 6
- 폴리아미드(PA) 66
- 폴리프탈아미드
- 폴리부틸렌 테레프탈레이트(PBT)
- 폴리카보네이트(PC)
- 폴리에테르 에테르 케톤(PEEK)
- 폴리에틸렌 테레프탈레이트(PET)
- 폴리이미드(PI)
- 폴리메틸 메타크릴레이트(PMMA)
- 폴리옥시메틸렌(POM)
- 스티렌 공중합체(ABS 및 SAN)
- 플루오로폴리머
- 국가
- 캐나다
- 멕시코
- 미국
제6장 경쟁 구도
- 주요 전략 동향
- 시장 점유율 분석
- 기업 상황
- 기업 프로파일
- Alfa SAB de CV
- Arkema
- Ascend Performance Materials
- BASF SE
- Celanese Corporation
- Covestro AG
- DuPont
- Eastman Chemical Company
- Formosa Plastics Group
- Indorama Ventures Public Company Limited
- INEOS
- Koch Industries, Inc.
- SABIC
- Solvay
- Trinseo
제7장 CEO에 대한 주요 전략적 질문
제8장 부록
- 세계 개요
- 개요
- Five Forces 분석 프레임워크(산업 매력도 분석)
- 세계의 밸류체인 분석
- 시장 역학(DROs)
- 정보원과 참고문헌
- 도표 일람
- 주요 인사이트
- 데이터 팩
- 용어집
The North America Engineering Plastics Market size is estimated at 18.54 billion USD in 2024, and is expected to reach 25.64 billion USD by 2029, growing at a CAGR of 6.70% during the forecast period (2024-2029).
Packaging industry to lose some of its volume share to electrical and electronics industry
- Engineering plastics have applications ranging from interior wall panels and doors in aerospace to rigid and flexible packaging. The North American engineering plastics market is led by industries such as packaging, electrical and electronics, and automotive. Packaging and electrical and electronics accounted for around 31.35% and 17.43%, respectively, of the engineering plastics market in terms of revenue in 2022.
- Packaging is the largest end-user industry in the region due to families worldwide becoming smaller and significant changes in urbanization and family demographics. These factors increase the demand for functional, prepackaged, and convenient food products. Plastic packaging production in North America had a volume of 22.4 million tons in 2022, which was 16.6% globally. The demand for engineering plastics in the region is increasing due to the increasing consumer demand for packaged food and beverages.
- The electrical and electronics sector is the second largest in the region and especially in the United States. The sector accounted for 1.6% of the GDP. It generated a revenue of USD 576.1 billion in 2022 in the region, thus increasing the demand for electrical and electronics and empowering the onset of electric vehicles, autonomous robots, and top-secret defense technologies, thereby boosting the demand for engineering plastics.
- The electrical and electronics industry is the fastest-growing in the region by revenue, with an expected CAGR of 8.54% during the forecast period (2023-2029), due to increasing applications of engineering plastics for the need of plastic composites in various electrical and electronics applications.
Evolving consumer and industrial trends, coupled with technological innovations, may boost the demand for engineering plastics
- North America accounted for a 15% consumption share of engineering plastics globally in 2022. Engineering plastics exhibit versatile properties, thus finding applications in the automotive, packaging, and electrical and electronics industries.
- The United States recorded a growth of 7.14% by value in 2022 compared to the previous year, attributed to the packaging and electrical and electronics industries, which held 27% and 24% of the market shares, respectively, by value. With an increase in the demand for ready-to-eat convenience food products and the emerging trend of an on-the-go lifestyle, the consumption of packaging materials has increased, thus boosting the sales of engineering plastics in the region. With companies adopting work-from-home models and people setting up home offices, the demand for electronic devices also increased. Technological innovations are also creating consistent demand for electronic gadgets every year.
- Mexico is the fastest-growing market, recording a growth of 10.53% in terms of value in 2022 compared to 2021, led by the industrial machinery and equipment industry. Mexico aims to improve its highways, modernize its ports, and expand its farms by making them more mechanized, thus boosting the demand for construction and farming machinery.
- The North American engineering plastics market is expected to register a CAGR of 6.62% during the forecast period, with the electrical and electronics industry recording the highest CAGR of 8.54% by value. The use of advanced materials, organic electronics, miniaturization, and disruptive technologies like AI and the IoT may also boost the adoption of smart manufacturing practices, thus driving the industry's growth.
North America Engineering Plastics Market Trends
Strong growth of technological innovations to augment the overall growth of the industry
- Electrical and electronics production in North America witnessed a CAGR of over 1.4% between 2017 and 2019 owing to the advancement of technology, coupled with the increasing demand for consumer electronics products, such as smart TVs, refrigerators, air conditioners, and other products. The rapid pace of electronic technological innovation is driving the demand for newer and faster electronic products. As a result, it has also increased the electrical and electronics production in the region.
- Electronic device sales in North America fell by around 9% in 2020 compared to 2019, owing to the COVID-19 impact, because of the production facility shutdowns, supply chain disruptions, and various other constraints. As a result, revenue from electrical and electronics production in the region decreased by 4.7% in 2020 compared to the previous year.
- In 2021, the sales of consumer electronics in the region reached around USD 113 billion, 4% higher than in 2020. As a result, North America's electrical and electronics production grew by 13.8% in 2021 in terms of revenue compared to the previous year.
- By 2027, North America is projected to be the third-largest region for electrical and electronics production and account for a share of around 10.5% of the global market. The emergence of advanced technologies such as virtual reality, IoT solutions, and robotics into consumer electronic products to achieve efficiency and low cost has provided a significant advantage to the consumer electronics industry. The consumer electronics industry in the region is projected to reach a market volume of around USD 161.8 billion by 2027 from USD 127.6 billion in 2023. As a result, the demand for electrical and electronic products in the region is projected to increase.
North America Engineering Plastics Industry Overview
The North America Engineering Plastics Market is fairly consolidated, with the top five companies occupying 68.68%. The major players in this market are Alfa S.A.B. de C.V., Ascend Performance Materials, Indorama Ventures Public Company Limited, Koch Industries, Inc. and SABIC (sorted alphabetically).
Additional Benefits:
- The market estimate (ME) sheet in Excel format
- 3 months of analyst support
TABLE OF CONTENTS
1 EXECUTIVE SUMMARY & KEY FINDINGS
2 REPORT OFFERS
3 INTRODUCTION
- 3.1 Study Assumptions & Market Definition
- 3.2 Scope of the Study
- 3.3 Research Methodology
4 KEY INDUSTRY TRENDS
- 4.1 End User Trends
- 4.1.1 Aerospace
- 4.1.2 Automotive
- 4.1.3 Building and Construction
- 4.1.4 Electrical and Electronics
- 4.1.5 Packaging
- 4.2 Import And Export Trends
- 4.2.1 Fluoropolymer Trade
- 4.2.2 Polyamide (PA) Trade
- 4.2.3 Polycarbonate (PC) Trade
- 4.2.4 Polyethylene Terephthalate (PET) Trade
- 4.2.5 Polymethyl Methacrylate (PMMA) Trade
- 4.2.6 Polyoxymethylene (POM) Trade
- 4.2.7 Styrene Copolymers (ABS and SAN) Trade
- 4.3 Price Trends
- 4.4 Recycling Overview
- 4.4.1 Polyamide (PA) Recycling Trends
- 4.4.2 Polycarbonate (PC) Recycling Trends
- 4.4.3 Polyethylene Terephthalate (PET) Recycling Trends
- 4.4.4 Styrene Copolymers (ABS and SAN) Recycling Trends
- 4.5 Regulatory Framework
- 4.5.1 Canada
- 4.5.2 Mexico
- 4.5.3 United States
- 4.6 Value Chain & Distribution Channel Analysis
5 MARKET SEGMENTATION (includes market size in Value in USD and Volume, Forecasts up to 2029 and analysis of growth prospects)
- 5.1 End User Industry
- 5.1.1 Aerospace
- 5.1.2 Automotive
- 5.1.3 Building and Construction
- 5.1.4 Electrical and Electronics
- 5.1.5 Industrial and Machinery
- 5.1.6 Packaging
- 5.1.7 Other End-user Industries
- 5.2 Resin Type
- 5.2.1 Fluoropolymer
- 5.2.1.1 By Sub Resin Type
- 5.2.1.1.1 Ethylenetetrafluoroethylene (ETFE)
- 5.2.1.1.2 Fluorinated Ethylene-propylene (FEP)
- 5.2.1.1.3 Polytetrafluoroethylene (PTFE)
- 5.2.1.1.4 Polyvinylfluoride (PVF)
- 5.2.1.1.5 Polyvinylidene Fluoride (PVDF)
- 5.2.1.1.6 Other Sub Resin Types
- 5.2.2 Liquid Crystal Polymer (LCP)
- 5.2.3 Polyamide (PA)
- 5.2.3.1 By Sub Resin Type
- 5.2.3.1.1 Aramid
- 5.2.3.1.2 Polyamide (PA) 6
- 5.2.3.1.3 Polyamide (PA) 66
- 5.2.3.1.4 Polyphthalamide
- 5.2.4 Polybutylene Terephthalate (PBT)
- 5.2.5 Polycarbonate (PC)
- 5.2.6 Polyether Ether Ketone (PEEK)
- 5.2.7 Polyethylene Terephthalate (PET)
- 5.2.8 Polyimide (PI)
- 5.2.9 Polymethyl Methacrylate (PMMA)
- 5.2.10 Polyoxymethylene (POM)
- 5.2.11 Styrene Copolymers (ABS and SAN)
- 5.2.1 Fluoropolymer
- 5.3 Country
- 5.3.1 Canada
- 5.3.2 Mexico
- 5.3.3 United States
6 COMPETITIVE LANDSCAPE
- 6.1 Key Strategic Moves
- 6.2 Market Share Analysis
- 6.3 Company Landscape
- 6.4 Company Profiles (includes Global Level Overview, Market Level Overview, Core Business Segments, Financials, Headcount, Key Information, Market Rank, Market Share, Products and Services, and Analysis of Recent Developments).
- 6.4.1 Alfa S.A.B. de C.V.
- 6.4.2 Arkema
- 6.4.3 Ascend Performance Materials
- 6.4.4 BASF SE
- 6.4.5 Celanese Corporation
- 6.4.6 Covestro AG
- 6.4.7 DuPont
- 6.4.8 Eastman Chemical Company
- 6.4.9 Formosa Plastics Group
- 6.4.10 Indorama Ventures Public Company Limited
- 6.4.11 INEOS
- 6.4.12 Koch Industries, Inc.
- 6.4.13 SABIC
- 6.4.14 Solvay
- 6.4.15 Trinseo
7 KEY STRATEGIC QUESTIONS FOR ENGINEERING PLASTICS CEOS
8 APPENDIX
- 8.1 Global Overview
- 8.1.1 Overview
- 8.1.2 Porter's Five Forces Framework (Industry Attractiveness Analysis)
- 8.1.3 Global Value Chain Analysis
- 8.1.4 Market Dynamics (DROs)
- 8.2 Sources & References
- 8.3 List of Tables & Figures
- 8.4 Primary Insights
- 8.5 Data Pack
- 8.6 Glossary of Terms