|
시장보고서
상품코드
1906948
생물촉진제 : 시장 점유율 분석, 업계 동향 및 통계, 성장 예측(2026-2031년)Biostimulants - Market Share Analysis, Industry Trends & Statistics, Growth Forecasts (2026 - 2031) |
||||||
생물촉진제 시장은 2025년 45억 달러로 평가되었으며, 2026년 49억 4,000만 달러에서 2031년까지 79억 1,000만 달러에 이를 것으로 예상됩니다.
예측 기간(2026-2031년)의 CAGR은 9.85%를 나타낼 것으로 전망됩니다.

지속 가능한 작물 투입물에 대한 수요 급증, 규제 정의의 무결성 강화, 생물학적 자재와 수율 안정성의 관련성을 나타내는 증거의 축적이 이 성장세를 지원하고 있습니다. 농부들은 스트레스 내성 범위를 확대하고 새로운 탄소 신용 제도에 적격성을 확보하기 위해 기존의 비옥도 관리 프로그램에 생물촉진제를 통합하고 있습니다. 한편, 제조업체는 미생물 군집과 아미노산·휴민산을 조합한 제품의 투입을 가속해, 폭넓은 호환성을 추구하고 있습니다. 유럽은 규제의 조기 명확화에 의해 혁신 거점으로서의 역할을 계속하고 있습니다만, 북미에서는 미국 농무성의 「기후 스마트 상품 파트너십」제도(농장 레벨에서의 시용 비용의 최대 75%를 보조)에 의해 현재 가장 급격한 도입 곡선을 나타내고 있습니다. 게다가 미국 식물영양관리관협회(AAPFCO)의 대처에 의해 전미 관할 구역에서의 등록 경로가 표준화되어 승인 기간이 약 3분의 1 단축됨으로써, 세계의 확대가 뒷받침되고 있습니다.
세계의 생물촉진제 시장 동향과 인사이트
유기 식품 제품에 대한 수요 증가
미국의 유기농지는 지속적으로 확대되고 있으며, 생물학적 투입물로 재배된 농산물에 대해 소비자가 프리미엄 가격을 지불할 의사가 있음을 뒷받침하고 있습니다. 유럽의 '농장에서 식탁까지' 프레임워크는 2030년까지 농지의 25%를 유기화하는 것을 목표로 하고 있으며, 이행 기간 중의 수량 확보를 목표로 하는 생산자에 의한 생물촉진제의 도입을 가속화하고 있습니다. 미국 국가 유기 프로그램의 지침은 승인된 생물촉진제의 범주를 명시하고 인증에 대한 전통적인 모호함을 해소했습니다. 전문 소매 채널에서 수요 급증도 함께 가격 실현이 강화되어 고순도 아미노산 추출물과 해조 추출물에 대한 농장 수준의 투자 수익률을 밀어 올리고 있습니다.
정부 보조금 및 지원 규제
기후 스마트 상품 파트너십은 지속가능한 실천에 대한 상환금으로 엄청난 자금을 확보하고 있으며, 대상 생산자는 생물촉진제 비용의 최대 75%를 회수할 수 있습니다. 캘리포니아의 건전한 토양 프로그램에서는 추가 비용 분담 보조금이 겹쳐 적용됩니다. 업계 측에서는 미국 식물 영양관리관 협회가 주정부의 정의를 통일하고, 제조업자를 위한 중복 데이터 제출 절차를 삭감하고, 제품 전개를 가속화했습니다. 유럽의 공통 농업 정책 에코 체계에서 유사한 일관성으로 인해 농부들은 바이오 스튜어드를 영양 관리 계획에 통합 한 후 지불을 청구 할 수 있습니다.
불균일한 규제 정의
유럽 연합(EU) 지역 밖에서는 많은 관할 구역이 여전히 생물학적 침투물을 농약 법규로 분류하고 있으며, 독성 데이터 요구 사항이 추가됨으로써 컴플라이언스 비용이 증가하고 있습니다. 동남아시아 및 아프리카 국가에서는 전용 심사위원회가 설치되지 않은 경우가 많으며 시장 진입이 최대 2시즌 지연될 수 있습니다. 국제표준화기구(ISO)의 작업부회가 세계의 가이드라인의 책정을 목표로 하고 있습니다만, 실시 스케줄은 2027년 이후에 어긋날 전망입니다.
부문 분석
아미노산은 2025년 수익의 30.62%를 차지했고, 고부가가치 원예에서의 비생물적 스트레스 대책으로서 시비 관개나 엽면 살포 프로그램에서 널리 받아들여지고 있는 것이 확인되었습니다. 1에이커당 40달러-80달러의 비교 수익이 15달러-25달러의 투입 비용을 상쇄하기 위해 토마토, 피망, 오이 재배 시스템에서의 지속적인 사용이 촉진되고 있습니다. 점적 관개 약물과의 호환성과 입증된 보존 안정성은 보호 재배 생산자의 지속적인 지원을 지원합니다. 원예통합업자도 국가유기프로그램(NOP)규칙 준수를 목표로 할 때 아미노산을 선호하고 채용합니다. 이는 대부분의 효소 가수분해 경로가 유기 가공 기준에 적합하기 때문입니다. 수용성 푸민산은 계속해서 급성장 서브카테고리이며, 2031년까지 12.45%의 연평균 복합 성장률(CAGR)을 나타낼 것으로 예측되고 있습니다. 미량 영양소를 킬레이트화하여 양이온 교환 용량을 개선하는 토양 개량 메커니즘은 근권의 건전성에 주력하는 옥수수와 대두 생산자에게 지지되고 있습니다.
제조업체 각사는 기존의 우레아암모늄질산염 용액과의 상호 호환성을 강조해, 주류의 열작작물에 있어서 사용 확대를 도모하고 있습니다. 향상된 프릴 코팅 기술은 입자 크기를 균일화하여 기존 사용을 방해했던 장비 막힘을 방지합니다. 단백질 가수분해물은 동물 유래의 아미노산 블렌드가 질소와 탄소를 한 번의 적용으로 공급하는 인증 유기 체인에서 점유율을 계속 확대하고 있습니다. 해초 추출물은 여전히 필수적이지만 공급량의 변화에 직면하고 있으며 정밀 발효 기술을 이용한 합성 유사체의 개발이 촉진되고 있습니다. 풀보산은 가변율 살포기를 도입하는 정밀 농업 종사자들 사이에서 지지를 모으고 있으며, 저분자량이 조직에 신속하게 침투할 수 있게 하고, 멀티스펙트럼 드론 이미지로 일관된 반응 모니터링을 실현합니다.
생물촉진제 시장 보고서는 형태별(아미노산, 플루보산, 푸민산 등), 작물 유형별(환금작물, 원예작물, 농작물), 지역별(북미, 남미, 유럽 등)으로 분류됩니다. 시장 예측은 금액(달러)과 수량(메트릭톤)으로 제공됩니다.
지역별 분석
유럽은 성숙한 규제 인프라와 공통 농업 정책 생태계 내 종합적인 보조금 제도를 배경으로 2025년 38.62%의 가치 점유율을 유지했습니다. 네덜란드의 생산자는 시비 관개 대응 후민산을 사용하여 수량 상한을 보호하면서 질산염 유출 벌금을 삭감하고 있습니다. 덴마크의 경작농가는 유기농지 25% 목표를 활용하고 영양계획에 생물촉진제를 통합하는 것을 조건으로 우대금리로 은행대출을 확보. 이를 통해 재정적 인센티브와 생물학적 채용을 연동시키고 있습니다. 폴란드와 루마니아의 동유럽 생산자는 농촌 개발 프로그램의 기둥을 통한 지식 이전과 자금 지원의 혜택을 받고, 이 지역이 지속적인 주도적 입장을 유지하는 기반을 구축하고 있습니다.
북미는 2031년까지 연평균 복합 성장률(CAGR) 12.35%라는 최고 성장 곡선을 보여줍니다. 미국 농무부의 파트너십 보조금은 아처 다니엘스 미들랜드 사 등의 기업 어그리게이터를 끌어들여 여러 주에 걸친 파일럿 프로젝트의 스폰서가 되어 제작 면적의 조정을 촉진하고 있습니다. 아이오와 주립 대학과 캔자스 주립 대학과 같은 대학은 오픈 액세스 형 농장 시험 데이터 세트를 제공하고 농장 수준의 실험 위험을 줄임으로써 옥수수 벨트 지역의 보급을 가속화하고 있습니다. 캐나다의 지속 가능한 농업 전략은 유사한 인센티브를 반영하여 밀과 캐놀라 생산자가 합성 성장 조절제에서 생물학적 증강제로 전환 할 때 온실 가스 배출 감소 프로토콜의 적용 대상이 될 수 있습니다.
아시아태평양은 다층적 가능성을 보여줍니다. 중국의 국내생물농업지령에서는 생물촉진제를 전략적 투입자재로 자리매김하고 있지만 지방별 감독체제가 분단되어 있어 균질한 도입이 지연되고 있습니다. 인도의 유기인증이전제도는 고부가가치 바스마티 라이스과 망고 수출 수요를 밀어 올리고 있지만 고순도 원료 공급은 여전히 불안정합니다. 남미에서는 주로 브라질에서 진전이 보이고, 대두 생산자가 산성토양에 있어서 알루미늄 독성 관리에 푸민산을 채용하고 있습니다. 아르헨티나의 불경기 재배 시스템은 광범위한 재생 농업 패키지의 일환으로 미생물 종자 코팅을 통합합니다. 중동 및 아프리카는 여전히 발전도상이지만, 이스라엘이나 모로코에서는 관개 제약이 있는 원예 분야에 있어서, 염분 완화를 목적으로 하는 풀보산근부 관주 프로토콜의 검토가 시작되고 있습니다.
기타 혜택 :
- 엑셀 형식 시장 예측(ME) 시트
- 애널리스트 지원(3개월간)
자주 묻는 질문
목차
제1장 서론
- 조사 전제조건 및 시장 정의
- 조사 범위
- 조사 방법
제2장 보고서 제공
제3장 주요 요약 및 주요 조사 결과
제4장 주요 업계 동향
- 유기 재배 면적
- 유기 제품에 대한 1인당 지출액
- 규제 프레임워크
- 아르헨티나
- 호주
- 브라질
- 캐나다
- 중국
- 이집트
- 프랑스
- 독일
- 인도
- 인도네시아
- 이탈리아
- 일본
- 멕시코
- 네덜란드
- 나이지리아
- 필리핀
- 러시아
- 남아프리카
- 스페인
- 태국
- 튀르키예
- 영국
- 미국
- 베트남
- 밸류체인 및 유통채널 분석
- 시장 성장 촉진요인
- 유기 식품 제품에 대한 수요 증가
- 정부 보조금과 지원 규제
- 지속가능성을 중시한 생산자에 의한 채용
- 수율 및 비생물적 스트레스 개선의 증거
- 종자 코팅과 미량 영양소 블렌드의 통합
- 탄소배출권의 수익화 가능성
- 시장 성장 억제요인
- 규제 정의의 불통일
- 농가의 인지도 부족과 효과에 대한 회의
- 미생물 접종제 및 바이오 비료와의 경쟁
- 해초 원료 공급 위험
제5장 시장 규모와 성장 예측(금액 및 수량)
- 형태별
- 아미노산
- 풀빅산
- 휴믹산
- 단백질 가수분해물
- 해초 추출물
- 기타 생물촉진제 시장
- 작물 유형별
- 환금작물
- 원예작물
- 밭작물
- 지역별
- 아프리카
- 국가별
- 이집트
- 나이지리아
- 남아프리카
- 기타 아프리카
- 국가별
- 아시아태평양
- 국가별
- 호주
- 중국
- 인도
- 인도네시아
- 일본
- 필리핀
- 태국
- 베트남
- 기타 아시아태평양
- 국가별
- 유럽
- 국가별
- 프랑스
- 독일
- 이탈리아
- 네덜란드
- 러시아
- 스페인
- 튀르키예
- 영국
- 기타 유럽
- 국가별
- 중동
- 국가별
- 이란
- 사우디아라비아
- 기타 중동
- 국가별
- 북미
- 국가별
- 캐나다
- 멕시코
- 미국
- 기타 북미
- 국가별
- 남미
- 국가별
- 아르헨티나
- 브라질
- 기타 남미
- 국가별
- 아프리카
제6장 경쟁 구도
- 주요 전략적 움직임
- 시장 점유율 분석
- 기업 개황
- 기업 프로파일
- Valagro(Syngenta Group)
- Trade Corporation International(Rovensa Group)
- Atlantica Agricola SA
- Agriculture Solutions Inc.
- Biolchim SpA(JM Huber Corporation)
- Coramandel International Limited
- UPL Ltd.
- BASF SE
- Bayer AG
- FMC Corporation
- Koppert Group
- Gowan Company
- Haifa Group(Trance Resource Minerals Pte.)
- BioAtlantis Ltd.
제7장 CEO에 대한 주요 전략적 질문
KTH 26.01.20The biostimulants market was valued at USD 4.5 billion in 2025 and estimated to grow from USD 4.94 billion in 2026 to reach USD 7.91 billion by 2031, at a CAGR of 9.85% during the forecast period (2026-2031).
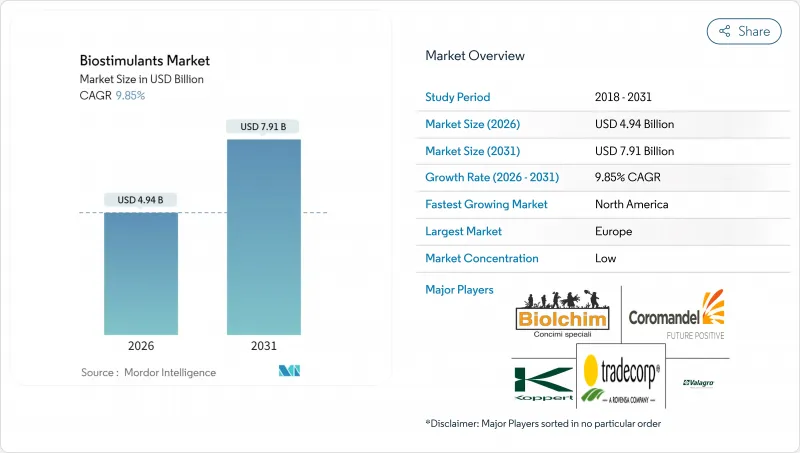
Surging demand for sustainable crop inputs, growing alignment of regulatory definitions, and mounting evidence linking biologicals with yield stability are anchoring this momentum. Farmers are integrating biostimulants with conventional fertility programs to widen stress-tolerance ranges and qualify for emerging carbon-credit schemes, while manufacturers accelerate product launches that pair microbial consortia with amino and humic acids for broader compatibility. Europe continues to serve as the innovation hub because of early regulatory clarity, although North America now records the sharpest deployment curve under the United States Department of Agriculture Climate-Smart Commodities Partnership, which reimburses up to 75% of field-level application costs. Global expansion is further supported by the Association of American Plant Food Control Officials' initiative that standardizes registration pathways across the United States jurisdictions, cutting approval times by nearly one-third.
Global Biostimulants Market Trends and Insights
Growing demand for organic food products
Organic acreage in the United States is continuously expanding, confirming consumer willingness to pay premiums for produce cultivated with biological inputs. Europe's Farm to Fork framework, which targets 25 % organic farmland by 2030, quickens biostimulant uptake among producers seeking to safeguard yields during transition periods. National Organic Program guidance now lists approved biostimulant categories, clearing prior ambiguity around certification. Parallel surges in specialty retail channels strengthen price realization, driving farm-level return on investment for high-purity amino and seaweed extracts.
Government subsidies and supportive regulations
The Climate-Smart Commodities Partnership sets aside significant fund for sustainable practice reimbursements, with eligible growers recouping as much as 75 % of biostimulant costs. California's Healthy Soils Program layers additional cost-share grants. On the industry side, the Association of American Plant Food Control Officials harmonized state-by-state definitions, trimming redundant data filing steps for manufacturers and expediting product rollouts. Similar alignment across Europe's Common Agricultural Policy eco-schemes allows farmers to claim payments after integrating biostimulants into nutrient-management plans.
Heterogeneous regulatory definitions
Outside the European Union, many jurisdictions still file biostimulants under pesticide statutes, adding toxicological data requirements that inflate compliance costs. Countries in Southeast Asia and Africa often lack dedicated review committees, delaying market entry by up to two seasons. Pending International Organization for Standardization workstreams aim to deliver global guidelines, yet implementation timelines stretch beyond 2027.
Other drivers and restraints analyzed in the detailed report include:
- Sustainability-driven grower adoption
- Yield and abiotic-stress improvement evidence
- Low farmer awareness and efficacy skepticism
For complete list of drivers and restraints, kindly check the Table Of Contents.
Segment Analysis
Amino acids captured 30.62 % of 2025 revenue, confirming their widespread acceptance in fertigation and foliar programs addressing abiotic stress in high-value horticulture. Comparative returns of USD 40 - 80 per acre offset input costs of USD 15 - 25, encouraging continuous application in tomato, pepper, and cucumber systems. Compatibility with drip irrigation chemistries and proven shelf stability underpin loyalty among protected-crop producers. Horticultural integrators also favor amino acids when seeking to meet National Organic Program rules because most enzymatic hydrolysis routes qualify under organic processing standards. Water-soluble humic acids remain the breakout subcategory, projected to register a 12.45 % CAGR through 2031. Soil-conditioning mechanisms that chelate micronutrients and improve cation-exchange capacity resonate with corn and soybean growers focused on root-zone health.
Manufacturers highlight cross-compatibility with conventional urea ammonium nitrate solutions to expand usage in mainstream row crops. Improved prill coating technologies deliver uniform particle size, avoiding equipment blockages that once hindered use. Protein hydrolysates continue to build share in certified organic chains, where animal-derived amino blends contribute nitrogen and carbon in a single pass. Seaweed extracts, although still integral, face supply volatility that encourages synthetic analog development using precision fermentation. Fulvic acids are gaining loyalty among precision farmers deploying variable-rate sprayers because their lower molecular weight supports rapid tissue infiltration, allowing consistent response monitoring through multispectral drone imagery.
The Biostimulants Market Report is Segmented by Form (Amino Acids, Fulvic Acid, Humic Acid, and More), Crop Type (Cash Crops, Horticultural Crops, and Row Crops), and Geography (North America, South America, Europe, and More). The Market Forecasts are Provided in Terms of Value (USD) and Volume (Metric Tons).
Geography Analysis
Europe retained 38.62 % value share in 2025 on the back of a mature regulatory infrastructure and comprehensive subsidies within the Common Agricultural Policy eco-scheme. Producers in the Netherlands use fertigation-compatible humic acids to cut nitrate leaching fines while safeguarding yield ceilings. Danish arable farms leverage the 25 % organic land goal to secure bank loans at preferential rates, provided that biostimulants feature in nutrient plans, thereby tying financial incentives to biological adoption. Eastern European producers in Poland and Romania benefit from knowledge transfer and funding via Rural Development Program pillars, positioning the bloc for continued leadership.
North America registers the highest growth curve at 12.35 % CAGR by 2031. The United States Department of Agriculture partnership grants draw corporate aggregators such as Archer Daniels Midland to sponsor multistate pilot projects, encouraging acreage alignment. Universities, including Iowa State and Kansas State, deliver open-access field trial datasets that de-risk farm-level experiments, accelerating diffusion in the Corn Belt. Canada's Sustainable Agriculture Strategy mirrors these incentives, enabling wheat and canola growers to qualify for greenhouse-gas offset protocols when switching from synthetic growth regulators to biological enhancers.
Asia-Pacific demonstrates layered potential. China's domestic biological-agriculture directive lists biostimulants as strategic inputs, but fragmented provincial oversight slows homogeneous deployment. India's organic transfer schemes boost demand in high-value basmati rice and mango exports, yet supply of high-purity raw materials remains uneven. South America gains traction largely in Brazil, where soybean producers adopt humic acids to manage aluminum toxicity in acid soils. Argentina's no-till systems integrate microbial seed coatings as part of wider regenerative packages. Middle East and Africa stay nascent, though irrigation-constrained horticulture in Israel and Morocco begins to explore fulvic acid root-drench protocols to mitigate salinity.
- Valagro (Syngenta Group)
- Trade Corporation International ( Rovensa Group )
- Atlantica Agricola S.A.
- Agriculture Solutions Inc.
- Biolchim SpA ( J. M. Huber Corporation )
- Coramandel International Limited
- UPL Ltd.
- BASF SE
- Bayer AG
- FMC Corporation
- Koppert Group
- Gowan Company
- Haifa Group ( Trance Resource Minerals Pte. )
- BioAtlantis Ltd.
Additional Benefits:
- The market estimate (ME) sheet in Excel format
- 3 months of analyst support
TABLE OF CONTENTS
1 INTRODUCTION
- 1.1 Study Assumptions and Market Definition
- 1.2 Scope of the Study
- 1.3 Research Methodology
2 REPORT OFFERS
3 EXECUTIVE SUMMARY AND KEY FINDINGS
4 KEY INDUSTRY TRENDS
- 4.1 Area Under Organic Cultivation
- 4.2 Per Capita Spending on Organic Products
- 4.3 Regulatory Framework
- 4.3.1 Argentina
- 4.3.2 Australia
- 4.3.3 Brazil
- 4.3.4 Canada
- 4.3.5 China
- 4.3.6 Egypt
- 4.3.7 France
- 4.3.8 Germany
- 4.3.9 India
- 4.3.10 Indonesia
- 4.3.11 Italy
- 4.3.12 Japan
- 4.3.13 Mexico
- 4.3.14 Netherlands
- 4.3.15 Nigeria
- 4.3.16 Philippines
- 4.3.17 Russia
- 4.3.18 South Africa
- 4.3.19 Spain
- 4.3.20 Thailand
- 4.3.21 Turkey
- 4.3.22 United Kingdom
- 4.3.23 United States
- 4.3.24 Vietnam
- 4.4 Value Chain and Distribution Channel Analysis
- 4.5 Market Drivers
- 4.5.1 Growing demand for organic food products
- 4.5.2 Government subsidies and supportive regulations
- 4.5.3 Sustainability-driven grower adoption
- 4.5.4 Yield and abiotic-stress improvement evidence
- 4.5.5 Seed-coating and micronutrient blend integration
- 4.5.6 Carbon-credit monetization potential
- 4.6 Market Restraints
- 4.6.1 Heterogeneous regulatory definitions
- 4.6.2 Low farmer awareness and efficacy skepticism
- 4.6.3 Competition from microbial inoculants and biofertilizers
- 4.6.4 Seaweed raw-material supply risk
5 MARKET SIZE AND GROWTH FORECASTS (VALUE AND VOLUME)
- 5.1 Form
- 5.1.1 Amino Acids
- 5.1.2 Fulvic Acid
- 5.1.3 Humic Acid
- 5.1.4 Protein Hydrolysates
- 5.1.5 Seaweed Extracts
- 5.1.6 Other Biostimulants
- 5.2 Crop Type
- 5.2.1 Cash Crops
- 5.2.2 Horticultural Crops
- 5.2.3 Row Crops
- 5.3 Geography
- 5.3.1 Africa
- 5.3.1.1 By Country
- 5.3.1.1.1 Egypt
- 5.3.1.1.2 Nigeria
- 5.3.1.1.3 South Africa
- 5.3.1.1.4 Rest of Africa
- 5.3.1.1 By Country
- 5.3.2 Asia-Pacific
- 5.3.2.1 By Country
- 5.3.2.1.1 Australia
- 5.3.2.1.2 China
- 5.3.2.1.3 India
- 5.3.2.1.4 Indonesia
- 5.3.2.1.5 Japan
- 5.3.2.1.6 Philippines
- 5.3.2.1.7 Thailand
- 5.3.2.1.8 Vietnam
- 5.3.2.1.9 Rest of Asia-Pacific
- 5.3.2.1 By Country
- 5.3.3 Europe
- 5.3.3.1 By Country
- 5.3.3.1.1 France
- 5.3.3.1.2 Germany
- 5.3.3.1.3 Italy
- 5.3.3.1.4 Netherlands
- 5.3.3.1.5 Russia
- 5.3.3.1.6 Spain
- 5.3.3.1.7 Turkey
- 5.3.3.1.8 United Kingdom
- 5.3.3.1.9 Rest of Europe
- 5.3.3.1 By Country
- 5.3.4 Middle East
- 5.3.4.1 By Country
- 5.3.4.1.1 Iran
- 5.3.4.1.2 Saudi Arabia
- 5.3.4.1.3 Rest of Middle East
- 5.3.4.1 By Country
- 5.3.5 North America
- 5.3.5.1 By Country
- 5.3.5.1.1 Canada
- 5.3.5.1.2 Mexico
- 5.3.5.1.3 United States
- 5.3.5.1.4 Rest of North America
- 5.3.5.1 By Country
- 5.3.6 South America
- 5.3.6.1 By Country
- 5.3.6.1.1 Argentina
- 5.3.6.1.2 Brazil
- 5.3.6.1.3 Rest of South America
- 5.3.6.1 By Country
- 5.3.1 Africa
6 COMPETITIVE LANDSCAPE
- 6.1 Key Strategic Moves
- 6.2 Market Share Analysis
- 6.3 Company Landscape
- 6.4 Company Profiles (Includes Global Level Overview, Market Level Overview, Core Segments, Financials as available, Strategic Information, Market Rank/Share, Products and Services, and Recent Developments)
- 6.4.1 Valagro (Syngenta Group)
- 6.4.2 Trade Corporation International ( Rovensa Group )
- 6.4.3 Atlantica Agricola S.A.
- 6.4.4 Agriculture Solutions Inc.
- 6.4.5 Biolchim SpA ( J. M. Huber Corporation )
- 6.4.6 Coramandel International Limited
- 6.4.7 UPL Ltd.
- 6.4.8 BASF SE
- 6.4.9 Bayer AG
- 6.4.10 FMC Corporation
- 6.4.11 Koppert Group
- 6.4.12 Gowan Company
- 6.4.13 Haifa Group ( Trance Resource Minerals Pte. )
- 6.4.14 BioAtlantis Ltd.