|
시장보고서
상품코드
1686295
아시아태평양의 건설용 화학제품 : 시장 점유율 분석, 산업 동향, 통계, 성장 예측(2025-2030년)Asia-Pacific Construction Chemicals - Market Share Analysis, Industry Trends & Statistics, Growth Forecasts (2025 - 2030) |
||||||
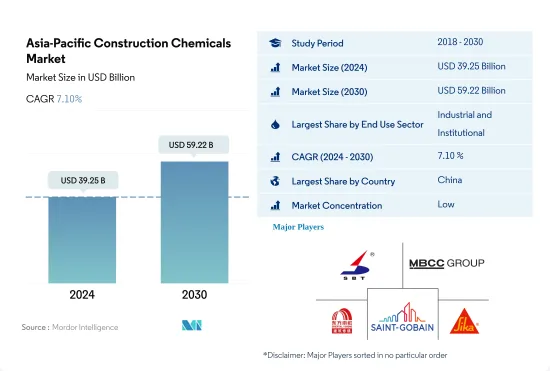
아시아태평양의 건설용 화학제품 시장 규모는 2024년에는 392억 5,000만 달러, 2030년에는 592억 2,000만 달러에 이를 것으로 예측되며, 예측 기간 중(2024-2030년) CAGR은 7.10%를 보일 것으로 예상됩니다.
아시아태평양의 건설용 화학제품 시장은 주택 분야에서 가장 급성장
- 2022년 아시아태평양의 건설용 화학제품 시장은 지역 전체의 건설 활동의 급증에 견인되어 전년 대비 2.58% 증가했습니다. 또한 최종 사용자 부문이 큰 성장을 기대하고 있기 때문에 2023년 시장은 2022년 대비 약 6% 확대될 것으로 예측됩니다.
- 2022년에 20.69%의 점유율을 차지하는 상업 부문은 이 시장의 최대 주주 중 하나입니다. 이러한 이점은 복잡한 설계, 다양한 요구사항 및 상당한 예산을 특징으로 하는 상업용 건물의 수가 증가하고 있기 때문입니다. 이 지역의 주목할 만한 예로는 상하이 타워(중국), 롯데월드 타워(한국), 센트럴 월드(태국) 등이 있습니다.
- 아시아태평양에는 세계 인구의 절반 이상이 살고 있으며, 주택 부문은 두 번째로 벌어지는 분야입니다. 도시화, 1인당 소득 상승, 다층 주택 건설의 급증과 같은 요인에 더해, 건설용 화학약품에 대한 의식의 고조가 이 분야의 가치를 밀어 올리고 있습니다.
- 최종 사용자 부문 중에서 주택 부문이 가장 높은 성장을 이루며 예측 기간(2023-2030년)의 CAGR은 7.89%로 예측됩니다. 이 급성장은 급증하는 도시 인구와 가처분 소득 증가로 인한 주택 수요 증가에 기여하고 있습니다.
강력한 산업 및 인프라 부문을 가진 중국이 아시아태평양의 건설용 화학제품 시장에서 우위를 차지하는 것이 시장을 끌어올릴 것으로 예상됩니다.
- 2022년 아시아태평양의 건설용 화학제품 수요 전체는 2021년 대비 3% 가까이 증가했습니다. 가장 큰 증가가 보인 것은 인프라 부문으로 2021년 대비 6% 수요 증가가 되었습니다. 2023년에는 중국과 인도네시아가 가장 현저한 급증을 보였으며, 2022년 대비 각각 6.2%와 6.8% 증가가 전망될 것으로 예측됩니다.
- 중국은 지배적인 선수로서 2022년 아시아태평양의 건설용 화학제품 시장의 절반 이상을 차지했습니다. 이는 중국이 이 지역 최대의 경제대국임을 뒷받침하고 건설 분야에 대한 투자가 견조하기 때문이라고 생각됩니다. 2022년 중국의 인프라 지출은 이 지역 전체의 63%를 차지합니다. 중국에서는 산업 및 기관 부문이 최대 소비자로 2022년 총 수요의 약 36%를 차지했습니다.
- 일본은 중국에 약간 차이가 계속되고 아시아태평양에서 2위의 건설용 화학제품 소비국입니다. 이 배경에는 일본 인구의 90%가 도시에 집중되어 있으며 주택, 사무실, 레스토랑, 공장 등 지속적인 인프라 개발이 필요할 수 있습니다. 게다가 지진과 해일의 리스크가 높아지고 있는 것에 대응한 일본의 엄격한 건축 기준법이 수요를 더욱 밀어 올리고 있습니다.
- 예측기간(2023-2030년)에는 중국이 CAGR 7.5%로 성장할 것으로 예상되며, 건설용 화학제품 수요가 가장 급성장할 전망입니다. 이 급증은 중국 정부가 2023년 주요 건설 및 인프라 프로젝트에 대한 지출을 1조 8,000억 달러 증가시킬 계획을 세우고 있기 때문입니다.
아시아태평양 건설용 화학제품 시장 동향
인도 등에서 소매점과 사무실 공간이 증가하고 아시아태평양의 상업 건설 분야를 뒷받침
- 2022년 아시아태평양 상업시설의 신설 바닥 면적은 전년 대비 3.23% 감소했습니다. 이 후퇴는 규제의 압력, 인플레이션율의 상승, 모기지 금리의 급상승 등의 요인에 의한 것입니다. 2023년에는 이 지역이 회복되었고 상업시설의 신설 바닥 면적은 약 1억 4,600만 평방 피트 증가했습니다. 이 급증은 주로 외국 직접투자(FDI) 증가로 인한 것으로, 새로운 오피스, 창고, 소매점, 기타 시설 수요에 박차를 가했습니다. 특히 베트남 건설 부문은 2023년 7,144만 달러의 FDI 자본을 유치했습니다.
- 2020년 아시아태평양은 상업시설의 신설 바닥 면적에서 상당한 타격을 입었으며, 2019년 대비 21.92%의 수량 감소가 되었습니다. 이 감소의 주요 원인은 정부의 봉쇄가 확산되고 프로젝트 작업이 중단되었으며 공급망, 장비 및 노동력에 심각한 영향을 미쳤다는 것입니다. 그러나 규제가 완화됨에 따라 이 지역은 눈부신 회복을 보였으며 2021년 상업시설의 신설 바닥 면적은 20.98% 급증하여 약 5억 2,600만 평방 피트의 바닥 면적에 이르렀습니다.
- 아시아태평양의 상업용 신설 바닥 면적은 크게 성장할 것으로 예상되며, 2023년에 비해 2030년에는 14억 1,000만 평방 피트 증가할 것으로 추정됩니다. 이러한 급증은 쇼핑몰, 오피스 스페이스, 소매점 등에 대한 수요 증가에 힘입어지고 있습니다. 아시아태평양은 세계 소매 대국으로 부상하고 있으며 세계 소매 성장의 4분의 3에 기여하고 있습니다. 예를 들어, 인도의 학년 A 오피스 시장은 상위 7개 도시에서 2026년까지 10억 평방 피트, 2030년까지 12억 평방 피트로 확장될 수 있습니다. 전반적으로 아시아태평양 상업시설의 신설 바닥 면적은 예측 기간 동안 CAGR 5.16%를 나타낼 것으로 예상됩니다.
인도에서는 2030년까지 2,500만호에 달할 가능성이 있는 등 저렴한 주택이 증가하고, 이 지역의 주택 건설이 확대됩니다.
- 2022년 아시아태평양의 주택 착공 바닥 면적은 전년 대비 약 5.39% 감소했습니다. 이 우울은 COVID-19의 대유행 시 건축 활동이 급증한 후 섹터가 정상화된 결과입니다. 이 지역의 주택 부문은 인구 증가, 부유층 증가 및 급속한 도시화에 의해 견인되고 있습니다. 이 지역의 주택 신축상 면적은 2023년에는 2022년 대비 4억 1,000만 평방 피트 증가할 것으로 예상되었습니다.
- 2020년 아시아태평양의 주택 신설 바닥 면적은 2019년 대비 약 5.06% 감소했습니다. 이는 주로 정부의 봉쇄, 공급망 혼란, 노동력 부족, 건설 생산성 저하, 외국 투자 침체로 인한 것이었습니다. 그러나 규제가 완화됨에 따라 이 지역에서는 상당한 회복이 보였고, 2021년에는 주택 신설 호수 증가로 주택 신설 바닥 면적이 약 14억 평방 피트 급증했습니다. 예를 들어, 2021년에만 인도의 주택 부동산 시장은 상위 7개 도시에서 약 16만 3,000호의 신축 주택을 도입합니다.
- 아시아태평양의 주택 신축 바닥 면적은 예측 기간 동안 CAGR 3.98%를 나타낼 것으로 예측됩니다. 이 성장은 주택 수요, 투자 증가, 유리한 정부 정책 때문입니다. 보다 저렴한 주택건설에 주력함으로써 이 지역의 주택건설 부문은 활기를 되찾아 회복에 도움이 될 것으로 기대됩니다. 2030년까지는 인도 인구의 40% 이상이 도시에 거주할 것으로 예상되며, 2,500만 호의 저렴한 주택 수요가 예상됩니다. 이 수요가 급증함에 따라 인도의 주거용 부동산 시장은 2030년까지 150만 호에 달할 것으로 예상됩니다.
아시아태평양 건설용 화학제품 산업 개요
아시아태평양의 건설용 화학제품품 시장은 세분화되어 상위 5개사에서 13.78%를 차지하고 있습니다. 이 시장 주요 기업은 다음과 같습니다. Jiangsu Subote New Material, MBCC Group, Oriental Yuhong, Saint-Gobain and Sika AG(sorted alphabetically).
기타 혜택
- 엑셀 형식 시장 예측(ME) 시트
- 3개월간의 애널리스트 서포트
목차
제1장 주요 요약과 주요 조사 결과
제2장 보고서 제안
제3장 소개
- 조사의 전제조건과 시장 정의
- 조사 범위
- 조사 방법
제4장 주요 산업 동향
- 최종 용도 분야의 동향
- 상업
- 산업 및 시설
- 인프라
- 주택
- 주요 인프라 프로젝트(현재 및 발표됨)
- 규제 프레임워크
- 밸류체인과 유통채널 분석
제5장 시장 세분화
- 최종 용도 분야
- 상업
- 산업 및 시설
- 인프라
- 주택
- 제품
- 접착제
- 서브 제품별
- 핫멜트
- 반응성
- 용제계
- 수성
- 앵커와 그라우트
- 서브 제품별
- 시멘트계 고정재
- 수지 고정
- 기타 유형
- 콘크리트 혼화제
- 서브 제품별
- 촉진제
- 공기혼입혼화제
- 고범위 감수제(초가소제)
- 지연제
- 수축 저감 혼화제
- 점도 조정제
- 감수제(가소제)
- 기타 유형
- 콘크리트 보호 페인트
- 서브 제품별
- 아크릴계
- 알키드
- 에폭시
- 폴리우레탄
- 기타 수지
- 바닥용 수지
- 서브 제품별
- 아크릴
- 에폭시
- 폴리아스파라긴
- 폴리우레탄
- 기타 수지 유형
- 보수 및 재생케미컬
- 서브 제품별
- 섬유 포장 시스템
- 주입 그라우트재
- 마이크로 콘크리트 모르타르
- 개질 모르타르
- 철근보호재
- 실링재
- 서브 제품별
- 아크릴
- 에폭시
- 폴리우레탄
- 실리콘
- 기타 수지
- 표면 처리 약품
- 서브 제품별
- 경화 컴파운드
- 이형제
- 기타 제품 유형
- 방수 솔루션
- 서브 제품별
- 화학제품
- 멤브레인
- 접착제
- 국가명
- 호주
- 중국
- 인도
- 인도네시아
- 일본
- 말레이시아
- 한국
- 태국
- 베트남
- 기타 아시아태평양
제6장 경쟁 구도
- 주요 전략 동향
- 시장 점유율 분석
- 기업 상황
- 기업 프로파일
- Arkema
- Cementaid International Group of Companies
- Fosroc, Inc.
- Jiangsu Subote New Material Co., Ltd.
- Kao Corporation
- Keshun Waterproof Technology Co., ltd.
- Lonseal Corporation
- MAPEI SpA
- MBCC Group
- MUHU(China) Construction Materials Co., Ltd.
- Normet
- Oriental Yuhong
- RPM International Inc.
- Saint-Gobain
- Sika AG
제7장 CEO에 대한 주요 전략적 질문
제8장 부록
- 세계 개요
- 개요
- Five Forces 분석 프레임워크(산업 매력도 분석)
- 세계의 밸류체인 분석
- 시장 역학(DROs)
- 정보원과 참고문헌
- 도표 일람
- 주요 인사이트
- 데이터 팩
- 용어집
The Asia-Pacific Construction Chemicals Market size is estimated at 39.25 billion USD in 2024, and is expected to reach 59.22 billion USD by 2030, growing at a CAGR of 7.10% during the forecast period (2024-2030).

Asia-Pacific construction chemicals market to grow the fastest in the residential sector
- In 2022, the Asia-Pacific construction chemicals market witnessed a 2.58% increase in value compared to the previous year, driven by a surge in construction activities across the region. Moreover, the market was projected to expand by approximately 6% in 2023 over 2022 as end-user sectors are looking forward to significant growth.
- Accounting for a substantial 20.69% share in 2022, the commercial sector stands as one of the largest shareholders in the market. This dominance can be attributed to the rising number of commercial buildings characterized by intricate designs, diverse requirements, and substantial budgets, all of which result in a relatively wide variety of construction chemicals usage. Notable examples in the region include Shanghai Tower (China), Lotte World Tower (South Korea), and CentralWorld (Thailand).
- With the Asia-Pacific region housing over half of the global population, the residential sector is the second most lucrative segment. Factors such as urbanization, rising per capita income, and a surge in multi-story residential constructions, coupled with growing awareness about construction chemicals, have propelled the sector's value.
- Among the end-user sectors, the residential segment is poised for the highest growth, with a projected CAGR of 7.89% during the forecast period (2023-2030). This surge is fueled by the escalating demand for housing, driven by a burgeoning urban population and increased disposable incomes.
China's dominance in the Asia-Pacific construction chemicals market owing to strong industrial and infrastructure sectors is expected to boost the market
- The overall demand for construction chemicals in the Asia-Pacific increased by nearly 3% in 2022 over 2021. The most significant increase was observed in the infrastructure sector, with a 6% higher demand than in 2021. In 2023, China and Indonesia were projected to see the most significant spikes, with estimated increases of 6.2% and 6.8%, respectively, over 2022.
- China, as the dominant player, accounted for over half of the Asia-Pacific construction chemicals market in 2022. This could be attributed to China's robust investments in its construction sectors, bolstered by its status as the region's largest economy. China's infrastructure spending in 2022 constituted 63% of the region's total. In China, the industrial and institutional sector was the largest consumer, accounting for nearly 36% of the total demand in 2022.
- Japan, following closely behind China, stands as the second-largest consumer of construction chemicals in the Asia-Pacific. This is due to Japan's urban-centric population, with 90% residing in cities, necessitating continuous infrastructure development for housing, offices, restaurants, and factories. Additionally, Japan's stringent building codes, a response to its heightened earthquake and tsunami risks, further contribute to the demand.
- During the forecast period (2023-2030), China is poised to witness the fastest growth in demand for construction chemicals, recording a CAGR of 7.5%. This surge can be attributed to the Chinese government's plan to ramp up spending on major construction and infrastructure projects by USD 1.8 trillion in 2023, which was a significant increase from the previous year.
Asia-Pacific Construction Chemicals Market Trends
Rising retail and office spaces in countries such as India to boost the Asia-Pacific commercial construction sector
- In 2022, Asia-Pacific witnessed a 3.23% decline in its commercial new floor area compared to the previous year. This setback was attributed to factors such as regulatory pressures, higher inflation, and a surge in mortgage rates. In 2023, the region rebounded, with commercial construction new floor area increasing by approximately 146 million sq. ft. This surge was primarily driven by a rise in foreign direct investment (FDI), which spurred the demand for new offices, warehouses, retail outlets, and other facilities. Notably, the Vietnamese construction sector attracted an FDI capital of USD 71.44 million in 2023.
- In 2020, the Asia-Pacific region experienced a significant setback in commercial new floor area, with a volume decline of 21.92% compared to 2019. This decline was primarily due to widespread government lockdowns, which disrupted project work and severely impacted supply chains, equipment, and labor. However, as restrictions eased, the region witnessed a remarkable rebound, with its commercial new floor area surging by 20.98% in 2021, reaching a volume of approximately 526 million sq. ft.
- Asia-Pacific's commercial new floor area is projected to witness substantial growth, with an estimated increase of 1.41 billion sq. ft by 2030 compared to 2023. This surge is fueled by a rising demand for shopping malls, office spaces, retail outlets, and more. The Asia-Pacific region is emerging as a global retail powerhouse, contributing to nearly three-quarters of the worldwide retail growth. For instance, the Indian Grade A office market in its top seven cities may to expand to 1 billion sq. ft by 2026 and further to 1.2 billion sq. ft. by 2030. Overall, the commercial new floor area in Asia-Pacific is projected to witness a volume CAGR of 5.16% during the forecast period.
Rising affordable housing units, such as India's likely to reach 25 million by 2030, to augment the residential constructions in the region
- In 2022, the residential new floor area in the Asia-Pacific region saw a volume decline of approximately 5.39% from the previous year. This dip was a result of the sector normalizing after a surge in building activity during the COVID-19 pandemic. The region's residential sector is driven by a growing population, increasing wealth, and rapid urbanization. The residential new floor area in the region was expected to rise by 410 million sq. ft in 2023 compared to 2022.
- In 2020, the residential new floor area in Asia-Pacific declined in volume by around 5.06% compared to 2019. This was primarily due to government-imposed lockdowns, disruptions in the supply chain, labor shortages, reduced construction productivity, and low foreign investments. However, as restrictions eased, the region saw a significant rebound, with the residential new floor area surging by about 1.4 billion sq. ft in 2021, driven by the addition of new residential housing units. For instance, in 2021 alone, the Indian residential real estate market introduced approximately 163 thousand new residential units across its top seven cities.
- The residential new floor area in the Asia-Pacific region is projected to witness a CAGR of 3.98% during the forecast period. This growth can be attributed to the demand for housing, increased investments, and favorable government policies. The focus on constructing more affordable housing units is expected to rejuvenate the residential construction sector in the region, aiding its recovery. By 2030, it is estimated that over 40% of India's population will reside in urban areas, leading to a demand for an additional 25 million affordable housing units. This surge in demand is expected to push the Indian residential real estate market to reach 1.5 million units by 2030.
Asia-Pacific Construction Chemicals Industry Overview
The Asia-Pacific Construction Chemicals Market is fragmented, with the top five companies occupying 13.78%. The major players in this market are Jiangsu Subote New Material Co., Ltd., MBCC Group, Oriental Yuhong, Saint-Gobain and Sika AG (sorted alphabetically).
Additional Benefits:
- The market estimate (ME) sheet in Excel format
- 3 months of analyst support
TABLE OF CONTENTS
1 EXECUTIVE SUMMARY & KEY FINDINGS
2 REPORT OFFERS
3 INTRODUCTION
- 3.1 Study Assumptions & Market Definition
- 3.2 Scope of the Study
- 3.3 Research Methodology
4 KEY INDUSTRY TRENDS
- 4.1 End Use Sector Trends
- 4.1.1 Commercial
- 4.1.2 Industrial and Institutional
- 4.1.3 Infrastructure
- 4.1.4 Residential
- 4.2 Major Infrastructure Projects (current And Announced)
- 4.3 Regulatory Framework
- 4.4 Value Chain & Distribution Channel Analysis
5 MARKET SEGMENTATION (includes market size, forecasts up to 2030 and analysis of growth prospects.)
- 5.1 End Use Sector
- 5.1.1 Commercial
- 5.1.2 Industrial and Institutional
- 5.1.3 Infrastructure
- 5.1.4 Residential
- 5.2 Product
- 5.2.1 Adhesives
- 5.2.1.1 By Sub Product
- 5.2.1.1.1 Hot Melt
- 5.2.1.1.2 Reactive
- 5.2.1.1.3 Solvent-borne
- 5.2.1.1.4 Water-borne
- 5.2.2 Anchors and Grouts
- 5.2.2.1 By Sub Product
- 5.2.2.1.1 Cementitious Fixing
- 5.2.2.1.2 Resin Fixing
- 5.2.2.1.3 Other Types
- 5.2.3 Concrete Admixtures
- 5.2.3.1 By Sub Product
- 5.2.3.1.1 Accelerator
- 5.2.3.1.2 Air Entraining Admixture
- 5.2.3.1.3 High Range Water Reducer (Super Plasticizer)
- 5.2.3.1.4 Retarder
- 5.2.3.1.5 Shrinkage Reducing Admixture
- 5.2.3.1.6 Viscosity Modifier
- 5.2.3.1.7 Water Reducer (Plasticizer)
- 5.2.3.1.8 Other Types
- 5.2.4 Concrete Protective Coatings
- 5.2.4.1 By Sub Product
- 5.2.4.1.1 Acrylic
- 5.2.4.1.2 Alkyd
- 5.2.4.1.3 Epoxy
- 5.2.4.1.4 Polyurethane
- 5.2.4.1.5 Other Resin Types
- 5.2.5 Flooring Resins
- 5.2.5.1 By Sub Product
- 5.2.5.1.1 Acrylic
- 5.2.5.1.2 Epoxy
- 5.2.5.1.3 Polyaspartic
- 5.2.5.1.4 Polyurethane
- 5.2.5.1.5 Other Resin Types
- 5.2.6 Repair and Rehabilitation Chemicals
- 5.2.6.1 By Sub Product
- 5.2.6.1.1 Fiber Wrapping Systems
- 5.2.6.1.2 Injection Grouting Materials
- 5.2.6.1.3 Micro-concrete Mortars
- 5.2.6.1.4 Modified Mortars
- 5.2.6.1.5 Rebar Protectors
- 5.2.7 Sealants
- 5.2.7.1 By Sub Product
- 5.2.7.1.1 Acrylic
- 5.2.7.1.2 Epoxy
- 5.2.7.1.3 Polyurethane
- 5.2.7.1.4 Silicone
- 5.2.7.1.5 Other Resin Types
- 5.2.8 Surface Treatment Chemicals
- 5.2.8.1 By Sub Product
- 5.2.8.1.1 Curing Compounds
- 5.2.8.1.2 Mold Release Agents
- 5.2.8.1.3 Other Product Types
- 5.2.9 Waterproofing Solutions
- 5.2.9.1 By Sub Product
- 5.2.9.1.1 Chemicals
- 5.2.9.1.2 Membranes
- 5.2.1 Adhesives
- 5.3 Country
- 5.3.1 Australia
- 5.3.2 China
- 5.3.3 India
- 5.3.4 Indonesia
- 5.3.5 Japan
- 5.3.6 Malaysia
- 5.3.7 South Korea
- 5.3.8 Thailand
- 5.3.9 Vietnam
- 5.3.10 Rest of Asia-Pacific
6 COMPETITIVE LANDSCAPE
- 6.1 Key Strategic Moves
- 6.2 Market Share Analysis
- 6.3 Company Landscape
- 6.4 Company Profiles
- 6.4.1 Arkema
- 6.4.2 Cementaid International Group of Companies
- 6.4.3 Fosroc, Inc.
- 6.4.4 Jiangsu Subote New Material Co., Ltd.
- 6.4.5 Kao Corporation
- 6.4.6 Keshun Waterproof Technology Co., ltd.
- 6.4.7 Lonseal Corporation
- 6.4.8 MAPEI S.p.A.
- 6.4.9 MBCC Group
- 6.4.10 MUHU (China) Construction Materials Co., Ltd.
- 6.4.11 Normet
- 6.4.12 Oriental Yuhong
- 6.4.13 RPM International Inc.
- 6.4.14 Saint-Gobain
- 6.4.15 Sika AG
7 KEY STRATEGIC QUESTIONS FOR CONCRETE, MORTARS AND CONSTRUCTION CHEMICALS CEOS
8 APPENDIX
- 8.1 Global Overview
- 8.1.1 Overview
- 8.1.2 Porter's Five Forces Framework (Industry Attractiveness Analysis)
- 8.1.3 Global Value Chain Analysis
- 8.1.4 Market Dynamics (DROs)
- 8.2 Sources & References
- 8.3 List of Tables & Figures
- 8.4 Primary Insights
- 8.5 Data Pack
- 8.6 Glossary of Terms