|
시장보고서
상품코드
1687220
북미의 데이터센터 시장 : 시장 점유율 분석, 산업 동향, 성장 예측(2025-2030년)North America Data Center - Market Share Analysis, Industry Trends & Statistics, Growth Forecasts (2025 - 2030) |
||||||
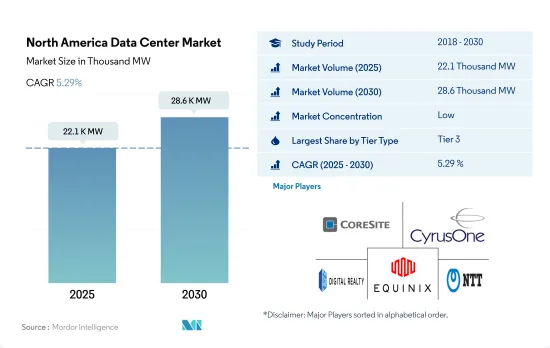
북미의 데이터센터 시장 규모는 2025년 2만 2,100MW로 추정되고, 2030년 2만 8,600MW에 달할 전망이며, CAGR 5.29%로 성장할 것으로 예측됩니다. 또한 2025년 코로케이션 수익은 259억 3,260만 달러로 추정되고, 2030년에는 422억 2,770만 달러에 이를 것으로 예측되며, 예측 기간인 2025-2030년 CAGR 10.24%로 성장할 전망입니다.
2023년에는 Tier 3 데이터센터가 수량 기준으로 대부분의 점유율을 차지합니다, : Tier 4는 급성장 부문
- 티어 4 데이터센터는 2023년에 5,881.0MW에 이르렀으며, 또한 CAGR 13.46%를 나타내며 2029년에는 1만 2,547.2MW를 초과할 것으로 예측됩니다.
- 향후 몇 년간, Tier 1과 Tier 2의 설비 수요는 꾸준히 감소하겠지만, 길고 예측할 수 없는 정전에 의해 성장은 계속될 것으로 예상됩니다. 이러한 티어1과 티어2의 로케이션에는 이미 충분한 양의 리테일용 코로케이션이 공급되고 있지만, 저레이턴시와 효율성 향상에 대한 수요가 높아지는 가운데 하이퍼스케일 클라우드의 요건을 충족시키기 위한 대규모 프로젝트도 수요를 견인하고 있습니다.
- 데이터 처리, 스토리지 및 분석에 대한 수요가 증가함에 따라 대부분의 고객은 궁극적으로 Tier 3 및 티어 4 시설로 옮겨 갈 것으로 예상됩니다. 티어 3 유형은 그 기능의 큰 장점으로 인해 2022년에는 시장의 대부분을 차지했습니다. 이 지역의 티어 3 데이터센터의 대부분은 북미에 있어 전력과 냉각을 위한 다수의 채널을 제공할 뿐만 아니라 높은 수준의 용장성도 갖추고 있습니다. 이러한 데이터센터의 가동률은 약 99.982%로, 이는 연간 1.6시간의 다운타임에 해당합니다. 또한 엣지 접속과 클라우드 접속의 이용 증가에 따라 티어 3 데이터센터의 확대는 앞으로도 계속될 것으로 예상됩니다.
- 티어 4 유형은 CAGR 15.51%로 증가할 것으로 예상됩니다. 종합적인 내결함성과 구성 요소 중복으로 이익을 얻기 위해 여러 선진국이 티어 4 인증을 채택하기 위해 노력하고 있습니다. 2022년 북미에는 81개의 티어 4 데이터 센터가 존재했습니다. 클라우드 기반 서비스를 제공하는 기업이 늘면서 다른 기업들도 최고의 기술을 갖춘 코로케이션 공간을 제공하는 시설을 건설하게 됐고, 티어 4 데이터센터는 앞으로 몇 년 안에 비약적으로 성장할 것으로 보입니다.
미국이 이 지역 시장의 대부분의 점유율을 차지하고 있으며, 예측 기간 동안에도 그 우위성은 계속될 것으로 예상됩니다.
- 지난 몇 년간 이 지역에서는 클라우드의 보급과 데이터 세대 증가로 데이터센터 수요가 급증하고 있습니다. 북미 데이터센터 시장 확대의 주요인은 IoT의 인기 상승, 5G 네트워크 개발 확대, 신흥국 시장의 대유행, 온라인 엔터테인먼트 콘텐츠의 고속 스트리밍 수요 증가입니다.
- 북미의 하이퍼스케일 코로케이션 데이터센터의 총 IT 부하 용량은 4,481.2 메가와트(MW)이며 CAGR 14.63%를 기록한 뒤 2029년에는 1만 2,047.5MW에 달할 전망입니다. 2023년까지 1만 3,000MW 이상의 용량이 개발되었고, 2029년까지 2만 5,000MW 이상으로 증가할 전망입니다. 이 신규 용량의 절반 이상이 미국에서 메가데이터센터에 의해 추가되고, 그 다음으로 대규모 데이터센터가 이어집니다. 데이터센터에 대한 사용자 요구의 규모와 양은 계속 확대되고 있습니다.
- 여러 대기업이 합계 60MW 이상, 안에는 100MW 이상의 임대 계약을 맺고 있습니다. 대부분의 대형 하이퍼스케일러가 70% 이상의 순흡수율을 담당하고 있으며, 2029년까지 5% 이상 증가할 전망입니다. 미국의 하이퍼스케일 데이터 센터 시장은 향후 몇 년간 북미에서 가장 빠르게 성장할 것으로 예측되고 있습니다. 최근의 경제우대 조치나 세제우대 조치가 미국 데이터센터 시장 구축의 주요인이 되고 있습니다.
- 캐나다는 데이터센터 시장의 성장국입니다. 지원적인 규제환경과 냉량한 기후가 데이터센터 시장을 지원하고 운영에 이상적입니다. 사물인터넷(IoT), 클라우드 컴퓨팅, 빅데이터로 인해 캐나다에서는 데이터 스토리지와 처리 능력에 대한 수요가 높아지고 있습니다. 그 결과 새로운 시설이 건설되고 오래된 시설은 확대되고 있습니다.
북미의 데이터센터 시장 동향
네트워크 커버리지 확대, 4G 및 5G 확대의 지속적인 고채용이 시장 성장을 견인할 가능성
- 무제한 데이터 통신 요금, 5G 네트워크 커버리지 확대, 네트워크 용량 증가로 2021년에는 5G 신규 가입자가 점점 증가했습니다. 게게임, XR, 동영상 기반 앱 채택이 증가할 것으로 예상되는 가운데 분당 사용으로 생성되는 데이터 양은 크게 증가할 것으로 예상되었습니다. 사용자를 만족시키기 위해서는 더 높은 비디오 해상도, 더 많은 업링크 트래픽, 클라우드 컴퓨팅 리소스에 오프로드된 장치에서 데이터가 필요합니다. 북미는 2028년까지 5G 계약 보급률이 가장 높아질 전망이며, 다른 전 지역과 비교해 90%에 이를 것으로 예측됐습니다.
- 5G를 조기에 전개한 인기 도시가, 2021년의 예측 기간 중에 트래픽 증가의 페이스를 잡았습니다. 5G는 향후 몇 년 동안 모바일 데이터 트래픽의 10% 이상을 차지할 것으로 예상되었습니다. 커버리지 확대와 스마트폰 계약 수와 스마트폰 1대당 평균 데이터 사용량 증가와 관련된 4G의 지속적인 높은 보급률이 트래픽 증가를 이끌어 왔습니다. 예를 들어, 2021년 시점에서 미국 스마트폰 소유자 수는 약 3억 2,800만 명이고, 2027년에는 북미 스마트폰 계약 수는 3억 5,800만 건에 이를 전망입니다.
- 광대역 서비스의 이용은 LTE의 이용 가능 범위의 확대에 의해 가능하게 되었습니다. 모바일 서비스를 이용하는 사람의 약 75%가 주 단위로 인터넷을 이용해, 그 절반 이상이 모바일 기기로부터 인터넷을 이용하고 있었습니다. 두 번째로 많았던 것은 소셜 네트워킹으로, 모바일 사용자의 60% 이상이 매주 적어도 한 번은 소셜 네트워킹 사이트를 방문했습니다. 이 이용은 2021년에는 하루 15분에서 30분 사이의 비디오 스트리밍에 해당합니다. 또한 SNS 및 기타 앱으로 인한 트래픽 증가도 예상되었습니다. 2021년 월간 모바일 데이터 트래픽은 6GB에 달하며, 2029년에는 30GB 이상으로 증가할 것으로 예상되었습니다.
5G 네트워크 확대와 5G 스마트폰 판매 증가가 시장 성장을 뒷받침
- 스마트폰의 보급에는 확대의 여지가 있습니다. 2021년 말까지, 북미의 모바일 접속의 83%를 스마트폰이 차지합니다. 2025년까지 3,000만 대의 스마트폰 접속이 추가로 전망됨에 따라 레거시 네트워크(2G와 3G)로부터의 이행이 향후에도 스마트폰의 보급을 뒷받침할 것으로 생각됩니다. 2027년까지 3배 이상이 될 것으로 예상되는 북미의 모바일 데이터 트래픽 확대는 스마트폰 보급률 상승에 계속 크게 의존할 것으로 보입니다. 애플이 2007년에 첫 번째 아이폰을 발표한 이후, 스마트폰의 인기는 급상승했습니다. 2016년에는 미국인 전체의 43.5%가 아이폰을 소유할 것으로 예상되었습니다.
- 미국에서는 2021년에는 모바일 연결의 약 4건에 1건이 5G가 되고, 5G의 보급이 시작되고 있었습니다. 팬데믹 이후 경기 회복, 5G 스마트폰 판매 증가, 일반적인 마케팅 시책 등이 기운의 고조로 이어졌습니다. 5G로의 업그레이드에 대한 소비자들의 관심이 높아지고 있으며, 현재 5G를 이용하고 있는 고객들은 스트리밍 비디오, 음악, 게임, 라이브 스포츠, 클라우드 스토리지 등의 콘텐츠와 서비스로 5G 플랜을 확대하는 데 관심을 보이고 있었습니다. 이로 인해 더 많은 사람들이 스마트폰을 구입하고 스마트폰 사용자가 증가할 것으로 예상되었습니다.
- 북미에서는 약 90%의 사람들이 인터넷을 이용하고 있습니다. 미국과 캐나다에서는 페이스북의 월간 활성 사용자 수(MAU)는 총 2억 6,600만 명이었습니다. 이는 이 지역에서 스마트폰이 널리 보급되고 있음을 보여줍니다. 스마트폰은 대량의 데이터를 실시간으로 처리해야 하기 때문에 데이터센터를 스토리지로 이용해야 합니다. 이 지역에서는 스마트폰의 호조된 성장으로 예상되는 기간 동안 데이터센터의 증가가 예상됩니다.
북미의 데이터센터 산업 개요
북미의 데이터센터 시장은 세분화되어 있으며 상위 5개사에서 19.67%를 차지하고 있습니다. 이 시장의 주요 기업은 CoreSite (America Tower Corporation), CyrusOne Inc., Digital Realty Trust Inc., Equinix Inc. 및 NTT Ltd 등입니다.
기타 혜택
- 엑셀 형식 시장 예측(ME) 시트
- 3개월간의 애널리스트 서포트
목차
제1장 주요 요약 및 주요 조사 결과
제2장 보고서 제안
제3장 서문
- 조사의 전제조건 및 시장 정의
- 조사 범위
- 조사 방법
제4장 시장 전망
- 내하중
- 바닥면적
- 코로케이션 수입
- 설치 랙 수
- 랙 공간 이용률
- 해저 케이블
제5장 주요 산업 동향
- 스마트폰 사용자수
- 스마트폰 1대당 데이터 트래픽
- 모바일 데이터 속도
- 광대역 데이터 속도
- 광섬유 접속 네트워크
- 규제 프레임워크
- 캐나다
- 멕시코
- 미국
- 밸류체인 및 유통채널 분석
제6장 시장 세분화
- 데이터센터 규모별
- 대규모
- 초대규모
- 중규모
- 메가 규모
- 소규모
- Tier 유형별
- Tier 1과 Tier 2
- Tier 3
- Tier 4
- 흡수량별
- 비이용
- 이용
- 코로케이션 유형별
- 하이퍼스케일
- 소매
- 홀세일
- 최종 사용자별
- BFSI
- 클라우드
- 전자상거래
- 정부기관
- 제조업
- 미디어 및 엔터테인먼트
- 텔레콤
- 기타
- 국가별
- 캐나다
- 멕시코
- 미국
- 기타 북미
제7장 경쟁 구도
- 시장 점유율 분석
- 기업 상황
- 기업 프로파일
- Cologix Inc.
- CoreSite(America Tower Corporation)
- CyrusOne Inc.
- Cyxtera Technologies
- Digital Realty Trust Inc.
- Edgecore(Partners Group)
- Equinix Inc.
- Flexential Corp.
- NTT Ltd
- Quality Technology Services
- Switch
- Vantage Data Centers LLC
제8장 CEO에 대한 주요 전략적 질문
제9장 부록
- 세계 개요
- 개요
- Porter's Five Forces 분석 프레임워크
- 세계의 밸류체인 분석
- 세계 시장 규모와 DRO
- 정보원 및 참고문헌
- 도표 목록
- 주요 인사이트
- 데이터 팩
- 용어집
The North America Data Center Market size is estimated at 22.1 thousand MW in 2025, and is expected to reach 28.6 thousand MW by 2030, growing at a CAGR of 5.29%. Further, the market is expected to generate colocation revenue of USD 25,932.6 Million in 2025 and is projected to reach USD 42,227.7 Million by 2030, growing at a CAGR of 10.24% during the forecast period (2025-2030).

Tier 3 data centers accounted for majority share in terms of volume in 2023; Tier 4 is the fastest-growing segment
- The tier 4 data center reached 5881.0 MW in 2023 and is further projected to exhibit a CAGR of 13.46%, surpassing 12547.2 MW by 2029.
- Over the coming years, demand for facilities in tiers 1 and 2 will steadily decrease, but growth will continue due to protracted and unpredictable outages. While there is already an adequate supply of retail colocation in these tier 1 and tier 2 locations, large-scale projects are also driving demand to fulfill growing hyperscale cloud requirements as the demand for lower latency and greater efficiency develops.
- The majority of clients will eventually move to tier 3 and tier 4 facilities due to the increasing demand for data processing, storage, and analysis. The tier 3 type held the majority of the market in 2022 due to the significant benefits of its features. Most tier 3 data centers in the area are located in North America, providing numerous channels for power and cooling as well as a high level of redundancy. These data centers have an uptime of about 99.982%, which equals 1.6 hours of downtime annually. Additionally, it is anticipated that the expansion in tier 3 data centers will continue to increase with the increased usage of edge and cloud connectivity.
- The tier 4 type is anticipated to increase at a CAGR of 15.51%. To benefit from total fault tolerance and component redundancy, several industrialized nations are working on adopting the Tier 4 certification. In 2022, there were 81 tier 4 data centers in North America. Tier 4 data centers will grow dramatically in the coming years as more companies are offering cloud-based services, which has prompted other companies to build facilities to offer colocation space with the greatest technology.
The United States holds the majority share of the regional market, with its dominance expected to continue during the forecast period
- Over the past few years, there has been a sharp increase in the demand for data centers in the region due to growing cloud adoption and rising data generation. The major drivers of the expansion of the data center market in North America have been the rising popularity of IoT, the increased development of 5G networks, the COVID-19 pandemic, and the increasing demand for high-speed streaming of online entertainment content.
- The total IT load capacity of hyper-scale colocation data centers in North America is 4,481.2 megawatts (MW), and by 2029, it is expected to reach 1,2047.5 MW after registering a CAGR of 14.63%. By 2023, more than 13,000 MW of capacity were to be under development, and by 2029, this is expected to increase to more than 25,000 MW. More than half this new capacity is being added in the United States by mega data centers, followed by massive-size data centers. The size and quantity of user requirements for data centers kept expanding.
- Several sizable businesses have inked leases totaling more than 60 MW, some even over 100 MW. Most big hyperscalers are responsible for a net absorption percentage of more than 70%, which is to rise by more than 5% by 2029. The hyperscale data center market in the United States is predicted to grow the fastest in North America over the coming years. Recent economic incentives and tax benefits have been key factors in constructing the US data center market.
- Canada is a growing nation in the data center market. A supportive regulatory environment and cool climate support the data center market and are ideal for operations. The Internet of Things (IoT), cloud computing, and big data drive Canada's demand for data storage and processing capabilities. As a result, new facilities are being built, and old ones are being expanded.
North America Data Center Market Trends
The expansion of network coverage and the continued high adoption of 4G and 5G expansion may drive market growth
- The unlimited data rates, enhanced 5G network coverage, and increased network capacity drew more and more new 5G subscribers in 2021. With the adoption of gaming, XR, and video-based apps anticipated to rise, the amount of data created per minute of use was expected to increase considerably. To satisfy users, these experiences required greater video resolutions, more uplink traffic, and data from devices offloaded to cloud computing resources. North America was projected to have the highest 5G subscription penetration, reaching 90%, by 2028 compared to all other areas.
- Popular cities with early 5G rollouts set the pace for traffic growth during the forecast period in 2021. 5G was expected to account for more than 10% of mobile data traffic in the upcoming years. The expansion of coverage and the continued high adoption of 4G, which was related to an increase in smartphone subscriptions and average data usage per smartphone, were driving traffic growth. For instance, as of 2021, there were about 328 million smartphone owners in the United States, and by 2027, there will be 358 million smartphone subscriptions in North America.
- The use of high bandwidth services was made possible by the expansion of LTE availability. About 75% of people who used mobile services visited the internet on a weekly basis, with more than half of them doing so from their mobile devices. The second-largest category was social networking, with more than 60% of mobile users visiting a social networking site at least once each week. The usage equated to 15 to 30 minutes of daily video streaming in 2021. Increased traffic was also expected to result from social networking and other apps. In 2021, monthly mobile data traffic was anticipated to reach 6 GB and increase to more than 30 GB by 2029.
5G network expansion and increased sales of 5G smartphones will boost the market's growth
- Smartphone adoption has some room to expand. By the end of 2021, smartphones accounted for 83% of mobile connections in North America. With 30 million additional smartphone connections anticipated by 2025, the migration away from legacy networks (2G and 3G) will continue to support smartphone adoption in the coming years. The expansion of mobile data traffic in North America, which was anticipated to more than triple by 2027, will continue to depend heavily on rising smartphone penetration. Since Apple unveiled the first iPhone in 2007, the popularity of smartphones has skyrocketed. By 2016, it was expected that 43.5% of all Americans would own an iPhone.
- In the United States, where 5G made up approximately one out of every four mobile connections in 2021, 5G was starting to become widely used. The economic recovery following the pandemic, increased sales of 5G smartphones, and general marketing initiatives have all helped increase momentum. Consumer interest in upgrading to 5G was increasing, and current 5G customers were showing an increased interest in expanding their 5G plans to include content and services like streaming video, music, gaming, live sports, and cloud storage. This was expected to encourage more people to purchase smartphones, increasing the number of smartphone users.
- Almost 90% of people in North America use the internet. In the United States and Canada, Facebook had a combined 266 million monthly active users (MAU). This demonstrated the widespread use of smartphones in the region, which essentially necessitates the use of data centers for storage since they demand real-time processing of sizable data chunks. A rise in data centers was expected to be seen in the region during the anticipated period as a result of good smartphone growth.
North America Data Center Industry Overview
The North America Data Center Market is fragmented, with the top five companies occupying 19.67%. The major players in this market are CoreSite (America Tower Corporation), CyrusOne Inc., Digital Realty Trust Inc., Equinix Inc. and NTT Ltd (sorted alphabetically).
Additional Benefits:
- The market estimate (ME) sheet in Excel format
- 3 months of analyst support
TABLE OF CONTENTS
1 EXECUTIVE SUMMARY & KEY FINDINGS
2 REPORT OFFERS
3 INTRODUCTION
- 3.1 Study Assumptions & Market Definition
- 3.2 Scope of the Study
- 3.3 Research Methodology
4 MARKET OUTLOOK
- 4.1 It Load Capacity
- 4.2 Raised Floor Space
- 4.3 Colocation Revenue
- 4.4 Installed Racks
- 4.5 Rack Space Utilization
- 4.6 Submarine Cable
5 Key Industry Trends
- 5.1 Smartphone Users
- 5.2 Data Traffic Per Smartphone
- 5.3 Mobile Data Speed
- 5.4 Broadband Data Speed
- 5.5 Fiber Connectivity Network
- 5.6 Regulatory Framework
- 5.6.1 Canada
- 5.6.2 Mexico
- 5.6.3 United States
- 5.7 Value Chain & Distribution Channel Analysis
6 MARKET SEGMENTATION (INCLUDES MARKET SIZE IN VOLUME, FORECASTS UP TO 2030 AND ANALYSIS OF GROWTH PROSPECTS)
- 6.1 Data Center Size
- 6.1.1 Large
- 6.1.2 Massive
- 6.1.3 Medium
- 6.1.4 Mega
- 6.1.5 Small
- 6.2 Tier Type
- 6.2.1 Tier 1 and 2
- 6.2.2 Tier 3
- 6.2.3 Tier 4
- 6.3 Absorption
- 6.3.1 Non-Utilized
- 6.3.2 Utilized
- 6.3.2.1 By Colocation Type
- 6.3.2.1.1 Hyperscale
- 6.3.2.1.2 Retail
- 6.3.2.1.3 Wholesale
- 6.3.2.2 By End User
- 6.3.2.2.1 BFSI
- 6.3.2.2.2 Cloud
- 6.3.2.2.3 E-Commerce
- 6.3.2.2.4 Government
- 6.3.2.2.5 Manufacturing
- 6.3.2.2.6 Media & Entertainment
- 6.3.2.2.7 Telecom
- 6.3.2.2.8 Other End User
- 6.4 Country
- 6.4.1 Canada
- 6.4.2 Mexico
- 6.4.3 United States
- 6.4.4 Rest of North America
7 COMPETITIVE LANDSCAPE
- 7.1 Market Share Analysis
- 7.2 Company Landscape
- 7.3 Company Profiles (includes Global Level Overview, Market Level Overview, Core Business Segments, Financials, Headcount, Key Information, Market Rank, Market Share, Products and Services, and Analysis of Recent Developments).
- 7.3.1 Cologix Inc.
- 7.3.2 CoreSite (America Tower Corporation)
- 7.3.3 CyrusOne Inc.
- 7.3.4 Cyxtera Technologies
- 7.3.5 Digital Realty Trust Inc.
- 7.3.6 Edgecore (Partners Group)
- 7.3.7 Equinix Inc.
- 7.3.8 Flexential Corp.
- 7.3.9 NTT Ltd
- 7.3.10 Quality Technology Services
- 7.3.11 Switch
- 7.3.12 Vantage Data Centers LLC
- 7.4 LIST OF COMPANIES STUDIED
8 KEY STRATEGIC QUESTIONS FOR DATA CENTER CEOS
9 APPENDIX
- 9.1 Global Overview
- 9.1.1 Overview
- 9.1.2 Porter's Five Forces Framework
- 9.1.3 Global Value Chain Analysis
- 9.1.4 Global Market Size and DROs
- 9.2 Sources & References
- 9.3 List of Tables & Figures
- 9.4 Primary Insights
- 9.5 Data Pack
- 9.6 Glossary of Terms