|
시장보고서
상품코드
1687702
미국의 유기 비료 : 시장 점유율 분석, 산업 동향 및 통계, 성장 예측(2025-2030년)United States Organic Fertilizer - Market Share Analysis, Industry Trends & Statistics, Growth Forecasts (2025 - 2030) |
||||||
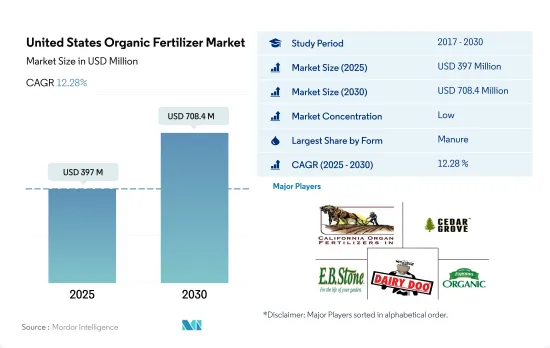
미국의 유기 비료 시장 규모는 2025년에는 3억 9,700만 달러로 추정되며, 2030년에는 7억 840만 달러에 달할 것으로 예상되며, 예측 기간(2025-2030년) 동안 12.28%의 CAGR로 성장할 것으로 예상됩니다.
- 퇴비는 미국에서 가장 많이 소비되는 유기 비료로 2022년 최대 점유율 46.7%를 차지했습니다. 퇴비는 식물성 또는 동물성 또는 배설물과 같은 식물성 또는 동물성 폐기물을 분해한 것으로, 일반적으로 유기물이 풍부합니다. 동물성 또는 식물성 배설물 퇴비, 농지 퇴비, 녹비 등이 농업에서 자주 사용되는 것들입니다.
- 퇴비 비료의 시용은 유기농업과 비유기농업 모두에서 일반적으로 행해지고 있습니다. 퇴비는 토양 내 유기물과 탄소 함량을 증가시켜 작물의 영양분 흡수를 높이고 곡물 수확량을 증가시키는 것으로 알려져 있습니다.
- 기타 유기 비료에는 피쉬 구아노, 박쥐 구아노, 생선 유제, 버미콘 퇴비, 당밀 등이 포함되며 2021년에는 11.9%의 점유율을 차지하여 두 번째로 많이 소비되는 유기 비료가 되었습니다. 기타 유기 비료는 풍부한 영양 특성을 가지고 있음에도 불구하고 가격이 비싸기 때문에 비료보다 덜 사용되어 시장을 약간 억제하고 있습니다. 그러나 농가의 경제적 여유가 증가함에 따라 수요가 증가할 가능성이 있습니다.
- 사료용 비료에 대한 수요는 주로 유기농 인증을 받은 생산자와 유기농으로 전환 중인 농장에서 발생합니다. 미국은 세계 최대 소고기 생산국으로 2020년에는 약 20.4%를 차지했습니다. 이는 미국 내 사료용 비료의 생산 여지가 크다는 것을 의미하며, 유기농 농부들이 쉽게 접근하고 사용할 수 있는 비료가 될 수 있습니다.
- 미국 오일케이크 시장은 2022년 210만 달러로 평가되며, 같은 해 소비량은 6,316.6톤입니다. 오일케이크는 질소 함량 2.0-8.0%, 인 함량 0-2.0%, 칼륨 함량 0-2.0%를 포함한 유기 영양소의 풍부한 공급원입니다.
미국 유기 비료 시장 동향
국가 법규에 따라 연작 작물을 중심으로 유기농 재배 면적 증가
- 2021년 미국의 유기농업 재배면적은 62만 3,000헥타르에 달했습니다. 미국의 유기 농업은 지난 20년 동안 크게 증가했지만 대부분 특정 법률과 규정의 도입으로 인해 크게 증가했습니다. 캘리포니아주의 유기농 농장 및 목장 수는 2021년 3,061개로 미국에서 가장 많은 유기농 인증 농장을 보유하고 있습니다. 펜실베니아 주에는 1,125개 이상의 유기농 인증 농장이 있으며, 2019년에 운영 중인 인증 유기농 농장은 1,554만 8,000여 개가 작물을 재배하고, 713만 9,000여 개가 목초지와 방목지를 운영했습니다. 묘목과 온실을 포함한 작물 판매액은 거의 58억 달러에 달했습니다.
- 국내 유기 농업은 경작 작물이 차지하고 있으며, 2021년에는 전체 유기농 농지의 약 71.8%를 차지했습니다. 곡물 생산이 이 나라 농업 부문의 대부분을 차지합니다. 주요 곡물에는 옥수수, 밀, 쌀, 수수, 기장 등이 있습니다. 유기농 제품의 소비는 다양한 건강상의 이점으로 인해 유기농 식품을 선택하는 미국 소비자들 사이에서 인기를 끌고 있습니다.
- 전체 유기원예작물 재배면적은 증가 추세로 2017년 11만 2,900헥타르에서 2021년에는 15만 6,100헥타르가 될 것이며, 2021년 국내 생산량 상위 5개 품목은 사과(31.1%), 딸기(9.5%), 오렌지(6.9%), 로메인레터스(6.7%), 감자(6.2%)로 나타났습니다. 로메인상추(6.7%), 감자(6.2%)입니다. 무역의 경우 수입이 많은 품목은 바나나(53.1%), 아보카도(7.7%), 망고(5.8%), 블루베리(5.0%), 호박(4.3%)이며, 수출이 많은 품목은 사과(80.0%), 배(14.4%), 체리(4.0%), 말린양파(1.5%), 감자(0.2%)입니다.
과일-채소 부문을 중심으로 유기농 농산물에 대한 수요 증가, 유기농 식품에 대한 1인당 지출액 증가
- 미국은 세계 최고의 유기농 제품 소비국입니다. 영양 비즈니스 저널(NBJ, 2021)에 따르면, 2020년 미국의 유기농 식품 총 매출액은 516억 달러에 달했습니다. 미국은 북미에서 유기농 제품에 대한 일인당 지출이 가장 큰 국가로 2021년에는 186.7달러에 달했습니다.
- 유기농 신선 과일과 채소는 유기농 식품 소매업이 설립된 이래로 유기농 식품의 주요 카테고리가 되었으며, 2020년에는 이러한 유기농 제품의 소매 매출액이 200억 달러에 달할 것으로 예상되며, 이는 유기농 농산물에 대한 수요가 증가하고 있음을 보여줍니다. 유기농 신선 과일과 채소에 대한 수요는 지난 20년간 꾸준히 증가하고 있습니다. 유기농 식품의 판매 증가는 특히 고소득층의 소비자 인식이 높아졌기 때문입니다. 가장 수요가 높은 유기농 식품 카테고리에는 계란, 유제품, 과일, 채소 등 기본 식품이 포함됩니다.
- 유기농 식품에 대한 선호도는 인구층과 지역에 따라 달라지는데, 18-29세 젊은 층은 65세 이상 고령층에 비해 유기농 제품을 찾는 경향이 강하다(50% 이상). 소득과 지역도 관련이 있는데, 소득이 3만 달러 미만인 사람의 42%, 7만 5,000달러 이상인 사람의 49%가 유기농 제품을 찾는 것으로 나타났습니다.
- 미국 내 유기농 제품에 대한 1인당 지출이 증가하고 있으며, 2017년부터 2021년까지 5.2%의 CAGR을 기록할 것으로 예상됩니다. 유기농 제품에 대한 수요 증가는 미국 유기농 생산자들이 국내외 고부가가치 시장을 개척할 수 있는 기회를 창출하고 있습니다. 유기농 제품과 관련된 가격 프리미엄은 저소득층 소비자의 유기농 식품 소비를 제한하는 주요 요인 중 하나입니다.
미국 유기 비료 산업 개요
미국 유기 비료 시장은 세분화되어 있으며, 상위 5개 기업이 21.10%를 차지하고 있습니다. 이 시장의 주요 업체는 다음과 같습니다. California Organic Fertilizers Inc., Cedar Grove Composting Inc., EB Stone & Sons Inc., Morgan Composting Inc. and The Espoma Company(알파벳순).
기타 혜택
- 엑셀 형식의 시장 예측(ME) 시트
- 3개월 애널리스트 지원
목차
제1장 주요 요약과 주요 조사 결과
제2장 보고서 오퍼
제3장 소개
- 조사 가정과 시장 정의
- 조사 범위
- 조사 방법
제4장 주요 산업 동향
- 유기 재배 면적
- 1인당 유기농 제품에 대한 지출
- 규제 프레임워크
- 미국
- 밸류체인과 유통 채널 분석
제5장 시장 세분화
- 형태
- 거름
- 밀 기반 비료
- 오일 케이크
- 기타 유기 비료
- 작물 유형
- 환금작물
- 원예작물
- 밭작물
제6장 경쟁 구도
- 주요 전략적 활동
- 시장 점유율 분석
- 기업 상황
- 기업 개요.
- Atlas Organics Inc.
- California Organic Fertilizers Inc.
- Cascade Agronomics LLC
- Cedar Grove Composting Inc.
- EB Stone & Sons Inc.
- Morgan Composting Inc.
- Sustane Natural Fertilizer Inc.
- The Espoma Company
- The Rich Lawn Company LLC
- Walts Organic Fertilizers Co.
제7장 CEO에 대한 주요 전략적 질문
제8장 부록
- 세계 개요
- 개요
- Five Forces 분석 프레임워크
- 세계의 밸류체인 분석
- 시장 역학(DROs)
- 정보 출처와 참고문헌
- 도표
- 주요 인사이트
- 데이터팩
- 용어집
The United States Organic Fertilizer Market size is estimated at 397 million USD in 2025, and is expected to reach 708.4 million USD by 2030, growing at a CAGR of 12.28% during the forecast period (2025-2030).

- Manures are the most consumed organic fertilizer in the United States, accounting for a maximum share of 46.7% in 2022. Manures can be of plant or animal origin or a decomposed form of plant or animal waste like excreta, which is generally rich in organic matter. Animal or plant waste compost manure, farmyard manure, and green manure are the common types used in agriculture.
- The application of manure fertilizers is generally observed in organic and non-organic farms. It is known to increase organic matter and carbon content in the soil, which would increase the nutrient uptake of the crop and, thus, the grain yield.
- The other organic fertilizers include fish guano, bat guano, fish emulsion, vermicompost, and molasses and are the second most consumed organic fertilizers, accounting for a share of 11.9% in 2021. Despite the rich nutrient properties, other organic fertilizers are less commonly used than manures due to their higher prices, which is slightly hindering the market. However, the demand may increase with the increasing affordability of farmers.
- The demand for meal-based fertilizers majorly comes from certified organic growers and farms under organic conversion. The United States is the largest producer of beef in the world, which accounted for around 20.4% in 2020. This indicates the higher scope for meal-based fertilizer production in the country, leading to easy availability and accessibility for organic farmers.
- The United States oilcake market was valued at USD 2.1 million in 2022, with a volume consumption of 6,316.6 metric tons in the same year. Oilcake is a rich source of organic nutrients containing 2.0-8.0% nitrogen, 0-2.0% phosphorous, and 0-2.0% potassium content.
United States Organic Fertilizer Market Trends
Increase in organic area, particularly in row crops, due to country's laws and regulations
- In 2021, the area under organic agricultural farming in the United States was 623 thousand hectares. Organic agriculture in the United States has increased significantly in the previous 20 years, mostly due to the introduction of particular laws and regulations. The number of organic farms and ranches in California was 3,061 in 2021, the largest number of certified organic farms in the United States. There were over 1,125 certified organic farms in Pennsylvania. Nearly 15,548 thousand certified organic farms in operation used cropland in 2019, while 7,139 thousand farms operated pastureland and rangeland. The sales value of crops, including those from nurseries and greenhouses, amounted to nearly USD 5.8 billion.
- Row crops dominated organic farming in the nation. In 2021, they accounted for about 71.8% of all organic cropland. The production of cereal crops predominates the country's agricultural sector. The main cereals include maize, wheat, rice, and millet. The consumption of organic products has become popular among US consumers who increasingly choose to eat organic foods because of their various health benefits.
- There is an increasing trend in the overall organic horticultural crop cultivation area, from 112.9 thousand hectares in 2017 to 156.1 thousand hectares in 2021. Regarding domestic production in 2021, the top five fruits and vegetables were apples (31.1%), strawberries (9.5%), oranges (6.9%), romaine lettuce (6.7%), and potatoes (6.2%). In the case of trade, the most imported produce was bananas (53.1%), avocados (7.7%), mangoes (5.8%), blueberries (5.0%), and squashes (4.3%), while the most exported were apples (80.0%), pears (14.4%), cherries (4.0%), dried onions (1.5%), and potatoes (0.2%).
Growing demand for organic produce especially in the fruits and vegetables sector, rise in per capita spending on organic food
- The United States is one of the largest organic product consumers in the world. In 2020, the total sales of organic food products in the country accounted for USD 51.6 billion, according to the Nutrition Business Journal (NBJ, 2021). The United States had the largest per capita spending on organic products in the North American region, worth USD 186.7 in 2021.
- Organic fresh fruits and vegetables have been the leading categories of organic food since the establishment of the organic food retail industry. In 2020, retail sales for these organic products were valued at USD 20.0 billion, showing a growing demand for organic produce. The demand for organic fresh fruits and vegetables has steadily risen over the past two decades. Organic food sales are rising due to growing consumer awareness, especially among high-income consumers. The most in-demand organic categories include basic foods like eggs, dairy, fruits, and vegetables.
- Organic food preferences vary by demographic and region. Younger people aged between 18 and 29 are more likely to seek organic products (over 50%) compared to older people aged 65 and above. Income and region also play a role, with 42% of those with under USD 30,000 income and 49% of those with over USD 75.0 thousand seeking organic products.
- The per capita spending on organic products is increasing in the country, recording a projected CAGR of 5.2% between 2017 and 2021. The growing demand for organic products is creating opportunities for US organic producers to tap into high-value markets both domestically and abroad. The price premium associated with organic products is one of the major limiting factors for organic food consumption for low-income consumers.
United States Organic Fertilizer Industry Overview
The United States Organic Fertilizer Market is fragmented, with the top five companies occupying 21.10%. The major players in this market are California Organic Fertilizers Inc., Cedar Grove Composting Inc., EB Stone & Sons Inc., Morgan Composting Inc. and The Espoma Company (sorted alphabetically).
Additional Benefits:
- The market estimate (ME) sheet in Excel format
- 3 months of analyst support
TABLE OF CONTENTS
1 EXECUTIVE SUMMARY & KEY FINDINGS
2 REPORT OFFERS
3 INTRODUCTION
- 3.1 Study Assumptions & Market Definition
- 3.2 Scope of the Study
- 3.3 Research Methodology
4 KEY INDUSTRY TRENDS
- 4.1 Area Under Organic Cultivation
- 4.2 Per Capita Spending On Organic Products
- 4.3 Regulatory Framework
- 4.3.1 United States
- 4.4 Value Chain & Distribution Channel Analysis
5 MARKET SEGMENTATION (includes market size in Value in USD and Volume, Forecasts up to 2030 and analysis of growth prospects)
- 5.1 Form
- 5.1.1 Manure
- 5.1.2 Meal Based Fertilizers
- 5.1.3 Oilcakes
- 5.1.4 Other Organic Fertilizer
- 5.2 Crop Type
- 5.2.1 Cash Crops
- 5.2.2 Horticultural Crops
- 5.2.3 Row Crops
6 COMPETITIVE LANDSCAPE
- 6.1 Key Strategic Moves
- 6.2 Market Share Analysis
- 6.3 Company Landscape
- 6.4 Company Profiles (includes Global Level Overview, Market Level Overview, Core Business Segments, Financials, Headcount, Key Information, Market Rank, Market Share, Products and Services, and Analysis of Recent Developments).
- 6.4.1 Atlas Organics Inc.
- 6.4.2 California Organic Fertilizers Inc.
- 6.4.3 Cascade Agronomics LLC
- 6.4.4 Cedar Grove Composting Inc.
- 6.4.5 EB Stone & Sons Inc.
- 6.4.6 Morgan Composting Inc.
- 6.4.7 Sustane Natural Fertilizer Inc.
- 6.4.8 The Espoma Company
- 6.4.9 The Rich Lawn Company LLC
- 6.4.10 Walts Organic Fertilizers Co.
7 KEY STRATEGIC QUESTIONS FOR AGRICULTURAL BIOLOGICALS CEOS
8 APPENDIX
- 8.1 Global Overview
- 8.1.1 Overview
- 8.1.2 Porter's Five Forces Framework
- 8.1.3 Global Value Chain Analysis
- 8.1.4 Market Dynamics (DROs)
- 8.2 Sources & References
- 8.3 List of Tables & Figures
- 8.4 Primary Insights
- 8.5 Data Pack
- 8.6 Glossary of Terms