


|
시장보고서
상품코드
1687725
아조토박터 : 시장 점유율 분석, 산업 동향, 통계, 성장 예측(2025-2030년)Azotobacter - Market Share Analysis, Industry Trends & Statistics, Growth Forecasts (2025 - 2030) |
||||||
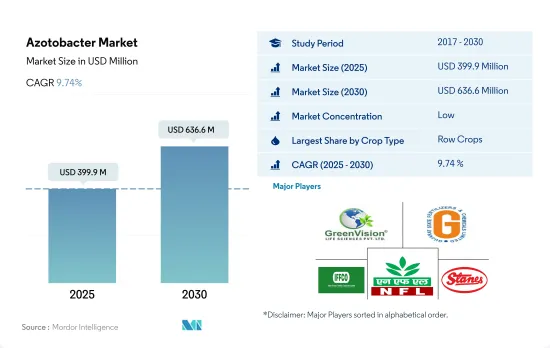
아조토박터 시장 규모는 2025년에 3억 9,990만 달러, 2030년에는 6억 3,660만 달러에 이를 것으로 예측되며, 예측 기간 중(2025-2030년) CAGR 9.74%로 성장할 것으로 예측됩니다.
- 아조토박터는 숙주 식물에 의존하지 않고 호기성 또는 혐기성으로 생물학적 질소 고정을 수행하는 자유 생활 세균을 의미합니다. 아조토박터 바이오 비료는 2022년 세계 바이오 비료 시장에서 11.3%의 점유율을 차지했습니다.
- 세계 유기농 작물 재배 면적은 지난 기간 동안 29.1% 증가했으며, 2017년 1,110만 헥타르에서 2022년에는 1,440만 헥타르로 증가했습니다. 2022년에는 연작작물이 최대의 유기재배면적을 차지했으며 점유율은 67.5%, 이어 원예작물이 17.5%, 환금작물이 15.1%였습니다.
- 쌀, 보리, 옥수수, 밀, 유채, 해바라기, 콩 및 기타 주요 농작물이 전 세계에서 재배되고 있습니다. 세계 아조토박터 시장은 경작작물이 압도적으로 많아 2022년에는 시장의 76.9%를 차지합니다. 아조토박터 바이오 비료는 벼, 밀, 기장, 면화, 토마토, 양배추, 겨자, 해바라기와 같은 비 레귤레이션 작물에 유용합니다.
- 다양한 무기 비료 대신에, 또는 무기 비료와 병용하여 아조토박터 바이오 비료를 시용함으로써 다양한 원예작물의 과실수량을 증가시킬 수 있기 때문에 원예작물에서의 아조토박터의 사용량이 증가하고 있습니다. 수율과 결실 증가는 질소 고정 능력에 의한 것뿐만 아니라 아조토박터가 식물의 잎을 통해 뿌리에서 꽃으로 다른 영양소의 정류를 증가시키는 능력 때문입니다.
- 질소 비료의 과다 적용은 부영양화, 온실 효과, 산성 비와 같은 환경 문제와 관련이 있습니다. 아조토박터 바이오 비료는 과도한 투여 없이 식물에 필요한 질소를 공급할 수 있습니다. 이러한 요인에 의해 세계의 아조토박터 바이오 비료 시장은 2023년부터 2029년 사이에 CAGR 9.5%를 나타낼 전망입니다.
- 질소(N)는 작물의 수율을 늘리는 데 필수적이며 작물의 초식 동물에 대한 방어 능력을 변경할 수 있습니다. 질소 비료는 식물의 수율과 경제적 수익성을 극대화하기 위해 필요 이상으로 자주 적용됩니다. 아조토박터는 질소 비료의 적용을 줄이는 실행 가능한 옵션입니다.
- 아시아태평양은 아조토박터 바이오 비료의 가장 규모가 큰 지역 시장으로, 2022년에는 1억 3,820만 달러 시장 규모를 차지합니다. 중국과 인도는 아시아태평양의 주요 국가별 시장으로, 아조토박터 시장 점유율은 각각 99.2%와 0.2%입니다. 중국은 세계에서 가장 질소(N) 비료의 소비율이 높습니다. 질소 비료의 사용은 중국의 식량 생산에 크게 도움이 되었지만 동시에 생물 지구 화학 사이클에 전례없는 변화를 가져 왔으며 육지와 수역의 생태계가 위기에 처해 있습니다. 중국의 비료 정책 개혁은 질소 비료의 사용과 질소 오염을 줄이는 데 도움이 됩니다. 아조토박터 바이오 비료는 합성 질소 기반 비료의 사용을 줄일 가능성도 가지고 있습니다.
- 인도에서는 오일 씨앗과 오일 팜에 관한 국가 미션(NMOOP) 아래, 바이오 비료, 공급 뿌리혹박테리아 (Rhizobium) 배양물, 인산 가용화 세균, 아연 가용화 세균, 아자토박터, 마이코로히자, 버미컴포스트 등 다양한 요소에 대해 1헥타르당 300루피의 이러한 요인들은 2023년부터 2029년까지 아조토박터 바이오 비료 시장을 끌어올릴 것으로 예상됩니다.
- 북미는 세계 아조토박터 시장에서 두 번째로 큰 지역 부문입니다. 미국과 캐나다는 유기농업에 대한 노력으로 북미 시장을 독점하고 있습니다.
세계 아조토박터 시장 동향
북미와 유럽에서는 유기농업에 대한 의식이 높아지고 정부의 이니셔티브로 유기농업의 생산량이 과거 최고를 기록하고 있습니다.
- 유기농업은 지속가능한 식량시스템에 크게 공헌하는 것으로 대두되고 있으며, 세계 187개국에서 실천되고 있습니다. 2021년 현재 세계 유기농지역은 7,230만 ha로 2018년부터 2021년까지 전 지역에서 평균 2.9% 증가하고 있습니다. 유기농경지는 1,440만 ha로, 유기농지 전체의 19.9%를 차지하고 있습니다.
- 유기농업의 가장 강력한 시장은 북미와 유럽으로 세계 유기농 경지의 41.0%를 차지하고 있습니다. 2022년에는 유럽에는 650만ha의 유기 경작지가 있으며, 이는 유기 경작지 전체의 44.1%에 해당합니다. 북미와 유럽에서 유기 재배되는 가장 중요한 작물은 사과, 딸기, 곡물, 올리브입니다.
- 아시아태평양의 신흥 국가들은 또한 유기농업운동에 참여하며 국내 수요를 충족하는 신선한 유기농산물의 생산과 공급으로 자급자족하고 있습니다. 유기농업의 동향은 아시아태평양에서 기세를 늘리고 있으며, 이 지역에서는 2017년부터 2022년에 걸쳐 유기경지면적이 18.8% 증가합니다. 이 지역 정부의 주요 이니셔티브도 유기농 농업의 확대 경향에 중요한 역할을 합니다. 예를 들어 일본의 식량·농업·농촌 기본계획은 2030년까지 유기농가와 유기농지의 수를 3배로 늘리는 것을 목표로 하고 있습니다.
- 유기농업의 성장의 원동력이 되는 것은 토양의 건강을 촉진하고, 환경에 대한 영향을 줄이고, 보다 건강한 식품을 생산하는 등 유기농업의 이점에 대한 의식 증가입니다.
유기농 식품의 1인당 지출은 주로 미국과 독일에서 관찰되지만, 이는 보다 건강하고 지속 가능한 식품에 대한 소비자 수요에 기인합니다.
- 유기농 식품 시장은 지난 몇 년간 현저한 성장을 거두었으며, 세계 매출은 2012년 708억 달러에서 2020년 1,206억 달러에 이르렀습니다. 유기농 식품에 대한 추세는 보다 건강하고 지속가능한 식품 선택을 추구하는 소비자 수요 증가와 전통적인 농업이 환경에 미치는 영향에 대한 의식이 증가하는 등 여러 요인들에 힘입어지고 있습니다. 세계 유기농 식품 시장은 향후 수년간 성장세가 지속될 것으로 예상됩니다.
- 유기농 무역협회가 2021년에 실시한 조사에 따르면 같은 해 유기농 과일 및 채소 매출은 약 4.5% 증가하여 전체 유기농 매출의 15%를 차지했습니다. 유기농 제품에 대한 평균 지출액은 북미가 시장을 독점하고 있으며, 미국 1인당 지출액은 2021년에 186.7달러에 이르고, 북미 국가 중 가장 높습니다. 유럽도 유기농 식품 시장에서 큰 성장이 예상되고 있으며, 2021년 1인당 지출액이 가장 높은 것은 독일에서 75.6달러입니다.
- 유기농 식품 시장은 소비자의 가처분 소득이 높은 선진국들이 여전히 지배적이지만, 신흥 국가에서도 성장이 예상됩니다. 예를 들어, 아시아태평양에서는 근로자 계급이 증가하고 있으며, 유기농 식품을 입수하기 쉽고 저렴한 가격으로 구입할 수 있게 되어 시장 확대에 기여할 가능성이 있습니다.
아조토박터 산업 개요
아조토박터 시장은 세분화되어 상위 5개사에서 14.24%를 차지하고 있습니다. 이 시장 주요 기업은 다음과 같습니다. Green Vision Life Sciences, Gujarat State Fertilizers & Chemicals Ltd, Indian Farmers Fertiliser Cooperative Limited, National Fertilizers Limited and T.Stanes and Company Limited(sorted alphabetically).
기타 혜택
- 엑셀 형식 시장 예측(ME) 시트
- 3개월의 애널리스트 서포트
목차
제1장 주요 요약과 주요 조사 결과
제2장 보고서 제안
제3장 소개
- 조사의 전제조건과 시장 정의
- 조사 범위
- 조사 방법
제4장 주요 산업 동향
- 유기 재배 면적
- 1인당 유기농 제품에 대한 지출
- 규제 프레임워크
- 아르헨티나
- 호주
- 브라질
- 캐나다
- 중국
- 이집트
- 프랑스
- 독일
- 인도
- 인도네시아
- 이탈리아
- 일본
- 멕시코
- 네덜란드
- 나이지리아
- 필리핀
- 러시아
- 남아프리카
- 스페인
- 태국
- 터키
- 영국
- 미국
- 베트남
- 밸류체인과 유통채널 분석
제5장 시장 세분화
- 작물 유형
- 환금작물
- 원예작물
- 경작작물
- 지역
- 아프리카
- 국가별
- 이집트
- 나이지리아
- 남아프리카
- 기타 아프리카
- 아시아태평양
- 국가별
- 호주
- 중국
- 인도
- 인도네시아
- 일본
- 필리핀
- 태국
- 베트남
- 기타 아시아태평양
- 유럽
- 국가별
- 프랑스
- 독일
- 이탈리아
- 네덜란드
- 러시아
- 스페인
- 터키
- 영국
- 기타 유럽
- 중동
- 국가별
- 이란
- 사우디아라비아
- 기타 중동
- 북미
- 국가별
- 캐나다
- 멕시코
- 미국
- 기타 북미
- 남미
- 국가별
- 아르헨티나
- 브라질
- 기타 남미
- 아프리카
제6장 경쟁 구도
- 주요 전략 동향
- 시장 점유율 분석
- 기업 상황
- 기업 프로파일
- Ezzy Bioscience Pvt. Ltd
- Green Vision Life Sciences
- Gujarat State Fertilizers & Chemicals Ltd
- Indian Farmers Fertiliser Cooperative Limited
- Indogulf BioAg LLC(Biotech Division of Indogulf Company)
- IPL Biologicals Limited
- Jaipur Bio Fertilizers
- National Fertilizers Limited
- Samriddhi Crops India Pvt. Ltd
- T.Stanes and Company Limited
제7장 CEO에 대한 주요 전략적 질문
제8장 부록
- 세계 개요
- 개요
- Five Forces 분석 프레임워크
- 세계의 밸류체인 분석
- 시장 역학(DROs)
- 정보원과 참고문헌
- 도표 일람
- 주요 인사이트
- 데이터 팩
- 용어집
The Azotobacter Market size is estimated at 399.9 million USD in 2025, and is expected to reach 636.6 million USD by 2030, growing at a CAGR of 9.74% during the forecast period (2025-2030).

- Azotobacter refers to free-living bacteria that perform biological nitrogen fixation aerobically or anaerobically without depending on the host plants. Azotobacter biofertilizers accounted for an 11.3% share of the global biofertilizers market in 2022.
- The global area under organic crop cultivation increased by 29.1% during the historical period, rising from 11.1 million hectares in 2017 to 14.4 million hectares in 2022. In 2022, row crops accounted for the largest area under organic cultivation, with a 67.5% share, followed by horticulture crops and cash crops, with shares of 17.5% and 15.1%, respectively.
- Rice, barley, corn, wheat, rapeseed, sunflower, soybean, and other major field crops are grown worldwide. Row crops dominate the global Azotobacter market, accounting for 76.9% of the market in 2022. Azotobacter biofertilizers are useful for non-leguminous crops like paddy, wheat, millet, cotton, tomato, cabbage, mustard, and sunflower.
- The usage of Azotobacter in horticulture crops is increasing as the application of Azotobacter biofertilizer by replacing or in conjunction with various inorganic fertilizers is capable of increasing the fruit yield in various horticultural crops. The increase in yield and fruit set is not only attributed to its nitrogen-fixing ability but also due to Azotobacter's ability to increase the translocation of other nutrients from root to flower via plant foliage.
- Excessive nitrogen fertilizer application has been linked to environmental issues such as eutrophication, the greenhouse effect, and acid rain. Azotobacter biofertilizers can provide plants with the necessary nitrogen without overdosing them. These factors are anticipated to drive the global Azotobacter biofertilizers market to record a CAGR of 9.5% between 2023 and 2029.
- Nitrogen (N) is essential for increasing crop yields and can alter crops' ability to defend against herbivores. N-fertilizer is applied more frequently than required to maximize plant yield and economic profitability. Azotobacter is a viable option for reducing N fertilizer application.
- Asia-Pacific is the largest regional market for Azotobacter biofertilizers, accounting for a value of USD 138.2 million in 2022. China and India are the major country-wise markets in Asia-Pacific, accounting for shares of 99.2% and 0.2%, respectively, in the Azotobacter market. China has the highest nitrogen (N) fertilizer consumption rate in the world. While N fertilizer use has greatly aided China's food production, it has also resulted in unprecedented changes in biogeochemical cycles and endangered terrestrial and aquatic ecosystems. Fertilizer policy reforms in China can help reduce N fertilizer use and the resultant N pollution. Azotobacter biofertilizers also have the potential to reduce the use of synthetic N-based fertilizers.
- In India, under the National Mission on Oilseeds and Oil Palm (NMOOP), financial assistance, including a 50% subsidy to the tune of INR 300/ha, is being given for different components like biofertilizers, supply Rhizobium culture/Phosphate solubilizing bacteria/Zinc solubilizing bacteria/Azatobacter/Mycorrhiza, and vermicompost. These factors are expected to boost the market for Azotobacter biofertilizers between 2023 and 2029.
- North America is the second-largest regional segment of the global Azotobacter market. The United States and Canada dominate the North American market due to their efforts to achieve organic farming.
Global Azotobacter Market Trends
Organic production is at an all-time high in North America and Europe, due to the increasing awareness and Government initiatives.
- Organic agriculture has emerged as a significant contributor to sustainable food systems, with 187 countries practicing it globally. As of 2021, there was 72.3 million ha of organic agricultural land worldwide, with an average increase of 2.9% across all regions from 2018 to 2021. Organic arable land accounted for 14.4 million ha, representing 19.9% of the total organic agricultural land.
- The strongest markets for organic farming are North America and Europe, accounting for 41.0% of the global organic arable land. In 2022, Europe had 6.5 million ha of organic arable land, equivalent to 44.1% of the overall organic arable agricultural area. The most significant crops grown organically in North America and Europe are apples, strawberries, cereals, and olives.
- Developing countries in Asia-Pacific are also joining the organic agriculture movement and becoming self-sufficient in producing and providing fresh organic produce to meet their domestic demand. The trend of organic farming is gaining momentum in Asia-Pacific, with the region recording an 18.8% increase in organic arable land from 2017 to 2022. The major initiatives by governments in the region also play a vital role in the growing trend of organic farming. For example, Japan's Basic Plan for Food, Agriculture, and Rural Areas aims to triple the number of organic farmers and lands by 2030.
- The growth of organic agriculture is driven by the rising awareness of the benefits of organic farming, such as promoting soil health, reducing environmental impacts, and producing healthier food.
Per capita spending of organic food majorly observed in United States and Germany, attributed to the consumer demand for healthier and sustainable food
- The organic food market experienced significant growth in the past few years, with global sales reaching USD 120.6 billion in 2020, up from USD 70.8 billion in 2012. The trend toward organic food is being driven by several factors, such as increasing consumer demand for healthier, more sustainable food options and a growing awareness of the environmental impact of conventional agriculture. The global organic food market is expected to continue its growth trend over the coming years.
- According to a survey conducted by the Organic Trade Association in 2021, sales of organic fruits and vegetables increased by around 4.5% in the same year, accounting for 15% of the overall organic sales. North America dominates the market in terms of average spending on organic products, with per capita spending in the United States reaching USD 186.7 in 2021, the highest among all North American countries. Europe is also expected to experience significant growth in the organic food market, with Germany accounting for the highest per capita spending of USD 75.6 in 2021.
- While the organic food market is still dominated by developed countries with high consumer disposable incomes, it is also expected to grow in developing nations. For example, the increasing number of working-class people in the Asia-Pacific region may contribute to the market's expansion due to the growing availability and affordability of organic food products.
Azotobacter Industry Overview
The Azotobacter Market is fragmented, with the top five companies occupying 14.24%. The major players in this market are Green Vision Life Sciences, Gujarat State Fertilizers & Chemicals Ltd, Indian Farmers Fertiliser Cooperative Limited, National Fertilizers Limited and T.Stanes and Company Limited (sorted alphabetically).
Additional Benefits:
- The market estimate (ME) sheet in Excel format
- 3 months of analyst support
TABLE OF CONTENTS
1 EXECUTIVE SUMMARY & KEY FINDINGS
2 REPORT OFFERS
3 INTRODUCTION
- 3.1 Study Assumptions & Market Definition
- 3.2 Scope of the Study
- 3.3 Research Methodology
4 KEY INDUSTRY TRENDS
- 4.1 Area Under Organic Cultivation
- 4.2 Per Capita Spending On Organic Products
- 4.3 Regulatory Framework
- 4.3.1 Argentina
- 4.3.2 Australia
- 4.3.3 Brazil
- 4.3.4 Canada
- 4.3.5 China
- 4.3.6 Egypt
- 4.3.7 France
- 4.3.8 Germany
- 4.3.9 India
- 4.3.10 Indonesia
- 4.3.11 Italy
- 4.3.12 Japan
- 4.3.13 Mexico
- 4.3.14 Netherlands
- 4.3.15 Nigeria
- 4.3.16 Philippines
- 4.3.17 Russia
- 4.3.18 South Africa
- 4.3.19 Spain
- 4.3.20 Thailand
- 4.3.21 Turkey
- 4.3.22 United Kingdom
- 4.3.23 United States
- 4.3.24 Vietnam
- 4.4 Value Chain & Distribution Channel Analysis
5 MARKET SEGMENTATION (includes market size in Value in USD and Volume, Forecasts up to 2030 and analysis of growth prospects)
- 5.1 Crop Type
- 5.1.1 Cash Crops
- 5.1.2 Horticultural Crops
- 5.1.3 Row Crops
- 5.2 Region
- 5.2.1 Africa
- 5.2.1.1 By Country
- 5.2.1.1.1 Egypt
- 5.2.1.1.2 Nigeria
- 5.2.1.1.3 South Africa
- 5.2.1.1.4 Rest of Africa
- 5.2.2 Asia-Pacific
- 5.2.2.1 By Country
- 5.2.2.1.1 Australia
- 5.2.2.1.2 China
- 5.2.2.1.3 India
- 5.2.2.1.4 Indonesia
- 5.2.2.1.5 Japan
- 5.2.2.1.6 Philippines
- 5.2.2.1.7 Thailand
- 5.2.2.1.8 Vietnam
- 5.2.2.1.9 Rest of Asia-Pacific
- 5.2.3 Europe
- 5.2.3.1 By Country
- 5.2.3.1.1 France
- 5.2.3.1.2 Germany
- 5.2.3.1.3 Italy
- 5.2.3.1.4 Netherlands
- 5.2.3.1.5 Russia
- 5.2.3.1.6 Spain
- 5.2.3.1.7 Turkey
- 5.2.3.1.8 United Kingdom
- 5.2.3.1.9 Rest of Europe
- 5.2.4 Middle East
- 5.2.4.1 By Country
- 5.2.4.1.1 Iran
- 5.2.4.1.2 Saudi Arabia
- 5.2.4.1.3 Rest of Middle East
- 5.2.5 North America
- 5.2.5.1 By Country
- 5.2.5.1.1 Canada
- 5.2.5.1.2 Mexico
- 5.2.5.1.3 United States
- 5.2.5.1.4 Rest of North America
- 5.2.6 South America
- 5.2.6.1 By Country
- 5.2.6.1.1 Argentina
- 5.2.6.1.2 Brazil
- 5.2.6.1.3 Rest of South America
- 5.2.1 Africa
6 COMPETITIVE LANDSCAPE
- 6.1 Key Strategic Moves
- 6.2 Market Share Analysis
- 6.3 Company Landscape
- 6.4 Company Profiles (includes Global Level Overview, Market Level Overview, Core Business Segments, Financials, Headcount, Key Information, Market Rank, Market Share, Products and Services, and Analysis of Recent Developments).
- 6.4.1 Ezzy Bioscience Pvt. Ltd
- 6.4.2 Green Vision Life Sciences
- 6.4.3 Gujarat State Fertilizers & Chemicals Ltd
- 6.4.4 Indian Farmers Fertiliser Cooperative Limited
- 6.4.5 Indogulf BioAg LLC (Biotech Division of Indogulf Company)
- 6.4.6 IPL Biologicals Limited
- 6.4.7 Jaipur Bio Fertilizers
- 6.4.8 National Fertilizers Limited
- 6.4.9 Samriddhi Crops India Pvt. Ltd
- 6.4.10 T.Stanes and Company Limited
7 KEY STRATEGIC QUESTIONS FOR AGRICULTURAL BIOLOGICALS CEOS
8 APPENDIX
- 8.1 Global Overview
- 8.1.1 Overview
- 8.1.2 Porter's Five Forces Framework
- 8.1.3 Global Value Chain Analysis
- 8.1.4 Market Dynamics (DROs)
- 8.2 Sources & References
- 8.3 List of Tables & Figures
- 8.4 Primary Insights
- 8.5 Data Pack
- 8.6 Glossary of Terms
