


|
시장보고서
상품코드
1687729
아프리카의 바이오 비료 : 시장 점유율 분석, 산업 동향 및 통계, 성장 예측(2025-2030년)Africa Biofertilizer - Market Share Analysis, Industry Trends & Statistics, Growth Forecasts (2025 - 2030) |
||||||
■ 보고서에 따라 최신 정보로 업데이트하여 보내드립니다. 배송일정은 문의해 주시기 바랍니다.
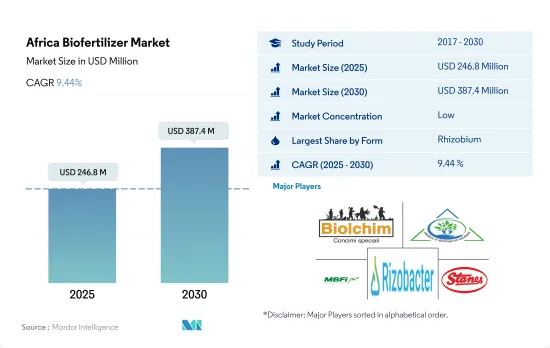
아프리카의 바이오 비료 시장 규모는 2025년에는 2억 4,680만 달러에 달할 것으로 추정됩니다. 2030년에는 3억 8,740만 달러에 이를 것으로 예상되며, 예측 기간(2025-2030년)의 CAGR은 9.44%를 나타낼 전망입니다.

- 바이오 비료는 토양중의 영양분을 동원하거나 이용성을 높이거나 하여 식물의 영양상태를 개선하는 살아있는 미생물입니다.
- 이 바이오 비료 중에서 리조븀은 아프리카에서 가장 널리 사용되고 있으며, 2022년에는 시장의 45.6%를 차지했으며, 8,750만 달러로 평가되었습니다.
- 아조스피릴룸은 2위 시장 점유율을 차지하며 2022년에는 4,380만 달러로 평가되었습니다.
- 경작 작물이 바이오 비료 시장을 독점했으며, 2022년에는 약 1억 4,680만 달러로 소비 점유율의 76.5%를 차지했고, 이어 원예 작물로 3,050만 달러에 달했습니다. 수수료 시장 규모는 끊임없이 확대되고 있습니다.
- 바이오 비료를 적용함으로써 화학 질소 비료의 사용량을 줄이고 재배 비용 전체를 삭감할 수 있습니다.
- 이집트, 나이지리아, 남아프리카 등 많은 아프리카 국가에서 유기 재배 식품 수요가 증가하고 있기 때문에 아프리카는 바이오 비료의 중요한 시장이 되고 있습니다. 110만 헥타르에서 2022년에는 130만 헥타르로 약간 확대되었습니다.
- 뿌리 알갱이는 아프리카 국가에서 가장 자주 사용되는 바이오 비료이며 2022년에는 시장의 45.6%를 차지했으며 8,760만 달러를 기록했습니다.
- 기타 아프리카 국가에서는 2021년 튀니지가 지역 최대 규모의 유기 생산국이 되었습니다. 대부분은 올리브 오일이지만, 데이트, 향수?약초, 일부의 야채나 과일도 수출되고 있습니다.
- 유기농업면적의 주요 국가는 이집트와 남아프리카에서 각각 4만 5,100헥타르와 1만 2,600헥타르로 합쳐 5.0%를 차지하고 있습니다.
- 유기제품에 대한 소비자의 관심이 높아짐에 따라 바이오 비료 수요는 예측기간 중에 증가할 것으로 예상됩니다.
아프리카 바이오 비료 시장 동향
이 지역의 유기농업부문에는 83만 4,000명의 유기생산자가 있으며, 튀니지 쪽이 유기농지가 많습니다.
- 아프리카의 유기농업에는 인증농업과 비인증농업의 두 가지 형태가 있습니다. 아프리카에서는 유기농지의 0.2%밖에 인증을 받지 않습니다. 반은 아프리카 최대의 농산물 시장인 유럽연합(EU)에 수출되고 있습니다. 한편, 인증되지 않은 유기농업 종사자는 자국에서의 판매를 목적으로 하고 있습니다.
- 아프리카의 주요 유기농 작물로는 견과류, 올리브, 커피, 코코아, 오일 씨앗, 면화 등이 있습니다. 작작물은 유기농지 면적의 제2위, 즉 약 25.6%를 차지했으며, 같은 해의 면적은 33만 1,200헥타르였습니다.
- 2020년에는 아프리카의 유기 생산자는 83만 4,000명 가까이 되었습니다.
- 면적에서는 튀니지의 유기 재배 면적이 최대입니다(2020년에는 29만ha 이상).
1인당 유기농 제품에 대한 지출은 이집트, 남아프리카, 나이지리아 국가에서 많습니다.
- 아프리카의 1인당 소득은 일관되게 증가하고 있으며, 사람들은 영양가가 높은 식품에 더 많은 지출을 하게 되어 있습니다.
- 아프리카에서는 특히 이집트, 남아프리카, 나이지리아에서 유기제품의 소비가 대폭 증가했습니다.
- 아프리카에서 일반적으로 소비되고 있는 유기 제품은 신선한 야채와 과일입니다.
- 과일 주스를 중심으로 하는 음료의 1인당 소비량 증가, 건강 의식의 높아, 화학 성분을 포함하지 않는 유기식음료에의 소비자의 시프트에 수반해, 유기 식품 수요는 2023-2029년 사이에 증가할 것으로 예상됩니다.
- 현재 유기농 식품이 식품 산업에서 차지하는 비율은 작지만 아프리카 소비자들 사이에서는 인기가 높아지고 있습니다.
아프리카 바이오 비료 산업 개요
아프리카의 바이오 비료 시장은 세분화되어 있으며 상위 5개 회사에서 2.49%를 차지하고 있습니다. Stanes and Company Limited 등입니다.
기타 혜택
- 엑셀 형식 시장 예측(ME) 시트
- 3개월의 애널리스트 서포트
목차
제1장 주요 요약과 주요 조사 결과
제2장 보고서 제안
제3장 서론
- 조사의 전제조건과 시장 정의
- 조사 범위
- 조사 방법
제4장 주요 산업 동향
- 유기 재배 면적
- 1인당 유기농 제품에 대한 지출
- 규제 프레임워크
- 이집트
- 이란
- 나이지리아
- 남아프리카
- 밸류체인과 유통채널 분석
제5장 시장 세분화
- 형태
- 아조스피릴룸
- 아조토박터
- 마이코리자
- 인산염 가용화 박테리아
- 리조 비움
- 기타 바이오 비료
- 작물 유형
- 환금 작물
- 원예 작물
- 밭 작물
- 생산국
- 이집트
- 나이지리아
- 남아프리카
- 기타 아프리카
제6장 경쟁 구도
- 주요 전략 동향
- 시장 점유율 분석
- 기업 상황
- 기업 프로파일
- Atlantica Agricola
- Biolchim SPA
- IPL Biologicals Limited
- Mapleton Agri BIoTec Pt. Ltd
- Microbial Biological Fertilizers International
- Rizobacter
- T. Stanes and Company Limited
- Valent Biosciences LLC
- Vegalab SA
제7장 CEO에 대한 주요 전략적 질문
제8장 부록
- 세계의 개요
- 개요
- Five Forces 분석 프레임워크
- 세계의 밸류체인 분석
- 시장 역학(DROs)
- 정보원과 참고문헌
- 도표 일람
- 주요 인사이트
- 데이터 팩
- 용어집
The Africa Biofertilizer Market size is estimated at 246.8 million USD in 2025, and is expected to reach 387.4 million USD by 2030, growing at a CAGR of 9.44% during the forecast period (2025-2030).
- Biofertilizers are living microorganisms that improve plant nutrition by mobilizing or increasing nutrient availability in soils. Mycorrhiza, Azospirillum, Azotobacter, Rhizobium, and phosphate-solubilizing bacteria are the most frequent microorganisms used as biofertilizers in agriculture.
- Among these biofertilizers, Rhizobium is most widely used in Africa, accounting for 45.6% of the market in 2022 and valued at USD 87.5 million. Rhizobium is the most prominent nitrogen-fixing bacteria that live in the root nodules of leguminous plants and has a symbiotic relationship with plants.
- Azospirillum accounted for the second-largest market share, valued at USD 43.8 million in 2022. Azospirillum-based biofertilizers promote plant vegetative growth by substituting 25-30% of plant nitrogen requirements.
- Row crops dominated the biofertilizer market, valued at about USD 146.8 million and accounting for 76.5% of the consumption share in 2022, followed by horticultural crops, valued at USD 30.5 million. The market value of biofertilizers in row crops is constantly expanding. It increased by about 17.8% between 2017 and 2021. It is anticipated to increase by about 69.6% by the end of the forecast period, reaching USD 270.0 million.
- The application of biofertilizers can reduce the use of chemical nitrogen fertilizers and the overall cost of cultivation. The demand for organic products in domestic and international markets is increasing, thus driving the demand for biofertilizers in the region.
- As the demand for organically cultivated food grows in many African countries such as Egypt, Nigeria, and South Africa, Africa is a significant market for biofertilizers. During the historical period (2017-2022), the region's organically cultivated area expanded slightly, from 1.1 million hectares in 2017 to 1.3 million hectares in 2022. During the same period, the African biofertilizer market grew by 6.9%. Major cereal crops are produced in the region, like maize, wheat, and corn.
- Rhizobium is the most often used biofertilizer in African countries, accounting for 45.6% of the market in 2022 and worth USD 87.6 million. Rhizobium is the most prominent nitrogen-fixing bacterium that resides in the root nodules of leguminous plants and has a symbiotic connection with plants.
- In the Rest of Africa, in terms of area, Tunisia was the region's largest organic producer in 2021. Around 60 of the 250 organic product categories cultivated in Tunisia are exported, mostly olive oil, but also dates, aromatic and medicinal herbs, and certain vegetables and fruits. Tunisia ranks 30th in the world and first in Africa in terms of organic farming area certification, despite its small size.
- The major countries with organic agricultural acreage include Egypt and South Africa accounting for 5.0% together, with 45.1 thousand hectares and 12.6 thousand hectares, respectively. However, the Rest of Africa accounted for 95.0% of total organic agricultural acreage in Africa, with 1.2 million hectares.
- The demand for biofertilizers is expected to rise during the forecast period owing to rising consumer interest in organic products. Farmers are becoming more aware of the disadvantages of relying on chemical inputs in agriculture and increasing organic acreage, which may also drive the market.
Africa Biofertilizer Market Trends
8,34,000 organic producers are in the region's organic sector with Tunisia is having more organic land
- Organic farming takes two forms in Africa: certified and uncertified. Only 0.2% of organic agricultural land may be certified in Africa. However, most organic farmers are not certified. Many certified farmers aim to export their products, with the majority being exported to the European Union, Africa's largest agricultural market. In contrast, non-certified organic farmers aim to sell their produce from home. In 2022, the area of organic agricultural land in Africa was over 1.2 million ha, representing 9.0% of the total organic agricultural area worldwide.
- In the African region, key organic crops include nuts, olives, coffee, cocoa, oilseeds, and cotton. Cash crops occupied a major share of organic agricultural land, accounting for 63.2% in 2022, with 817.4 thousand hectares. Row crops held the second-largest share of organic acreage, i.e., about 25.6%, accounting for 331.2 thousand hectares in the same year. Horticultural crops accounted for 11.2% of the organic acreage, with 144.9 thousand ha in 2022.
- In 2020, there were nearly 834,000 organic producers in Africa. The countries with the highest number of organic producers were Ethiopia (almost 220,000), Tanzania (nearly 149,000), and Uganda (over 139,000).
- In terms of area, Tunisia has the largest organic area under cultivation (more than 290,000 ha in 2020). The island state of Sao Tome and Principe has the region's highest percentage of land devoted to organic farming, i.e., 20.7%.
Per capita spending on organic product predominant in Egypt, South Africa, and Nigeria countries
- Africa's per capita income is consistently increasing, encouraging people to spend more on nutritious food. Organic foods and beverages are gaining more shelf space in the region.
- In Africa, consumption of organic products increased significantly, especially in Egypt, South Africa, and Nigeria. In 2021, the per capita consumption of organic products accounted for USD 55.5 in Egypt, followed by South Africa with USD 7.1. Within Africa, Uganda was an early adopter of organic farming and successfully established itself as a significant producer and exporter of organic products.
- In the African region, the commonly consumed organic products include fresh vegetables and fruits. Significant efforts have been made to mainstream organic agriculture into policy, national extension systems, marketing, and value chain development, thus gaining consumer attention.
- With the increasing per capita consumption of beverages, primarily fruit juices, growing health awareness, and consumers shifting toward organic food and drinks that do not contain chemical ingredients, the demand for organic food is expected to increase between 2023 and 2029.
- Though organic foods currently account for a small portion of the food industry, they are gaining popularity among African consumers. However, low income levels, lack of organic standards, and other infrastructure for local market certification may restrain the growth of the organic food market in the region.
Africa Biofertilizer Industry Overview
The Africa Biofertilizer Market is fragmented, with the top five companies occupying 2.49%. The major players in this market are Biolchim SPA, IPL Biologicals Limited, Microbial Biological Fertilizers International, Rizobacter and T. Stanes and Company Limited (sorted alphabetically).
Additional Benefits:
- The market estimate (ME) sheet in Excel format
- 3 months of analyst support
TABLE OF CONTENTS
1 EXECUTIVE SUMMARY & KEY FINDINGS
2 REPORT OFFERS
3 INTRODUCTION
- 3.1 Study Assumptions & Market Definition
- 3.2 Scope of the Study
- 3.3 Research Methodology
4 KEY INDUSTRY TRENDS
- 4.1 Area Under Organic Cultivation
- 4.2 Per Capita Spending On Organic Products
- 4.3 Regulatory Framework
- 4.3.1 Egypt
- 4.3.2 Iran
- 4.3.3 Nigeria
- 4.3.4 South Africa
- 4.4 Value Chain & Distribution Channel Analysis
5 MARKET SEGMENTATION (includes market size in Value in USD and Volume, Forecasts up to 2030 and analysis of growth prospects)
- 5.1 Form
- 5.1.1 Azospirillum
- 5.1.2 Azotobacter
- 5.1.3 Mycorrhiza
- 5.1.4 Phosphate Solubilizing Bacteria
- 5.1.5 Rhizobium
- 5.1.6 Other Biofertilizers
- 5.2 Crop Type
- 5.2.1 Cash Crops
- 5.2.2 Horticultural Crops
- 5.2.3 Row Crops
- 5.3 Country
- 5.3.1 Egypt
- 5.3.2 Nigeria
- 5.3.3 South Africa
- 5.3.4 Rest of Africa
6 COMPETITIVE LANDSCAPE
- 6.1 Key Strategic Moves
- 6.2 Market Share Analysis
- 6.3 Company Landscape
- 6.4 Company Profiles (includes Global Level Overview, Market Level Overview, Core Business Segments, Financials, Headcount, Key Information, Market Rank, Market Share, Products and Services, and Analysis of Recent Developments).
- 6.4.1 Atlantica Agricola
- 6.4.2 Biolchim SPA
- 6.4.3 IPL Biologicals Limited
- 6.4.4 Mapleton Agri Biotec Pt. Ltd
- 6.4.5 Microbial Biological Fertilizers International
- 6.4.6 Rizobacter
- 6.4.7 T. Stanes and Company Limited
- 6.4.8 Valent Biosciences LLC
- 6.4.9 Vegalab SA
7 KEY STRATEGIC QUESTIONS FOR AGRICULTURAL BIOLOGICALS CEOS
8 APPENDIX
- 8.1 Global Overview
- 8.1.1 Overview
- 8.1.2 Porter's Five Forces Framework
- 8.1.3 Global Value Chain Analysis
- 8.1.4 Market Dynamics (DROs)
- 8.2 Sources & References
- 8.3 List of Tables & Figures
- 8.4 Primary Insights
- 8.5 Data Pack
- 8.6 Glossary of Terms


샘플 요청 목록