|
시장보고서
상품코드
1910840
인도의 데이터센터 시장 : 점유율 분석, 업계 동향 및 통계, 성장 예측(2026-2031년)India Data Center - Market Share Analysis, Industry Trends & Statistics, Growth Forecasts (2026 - 2031) |
||||||
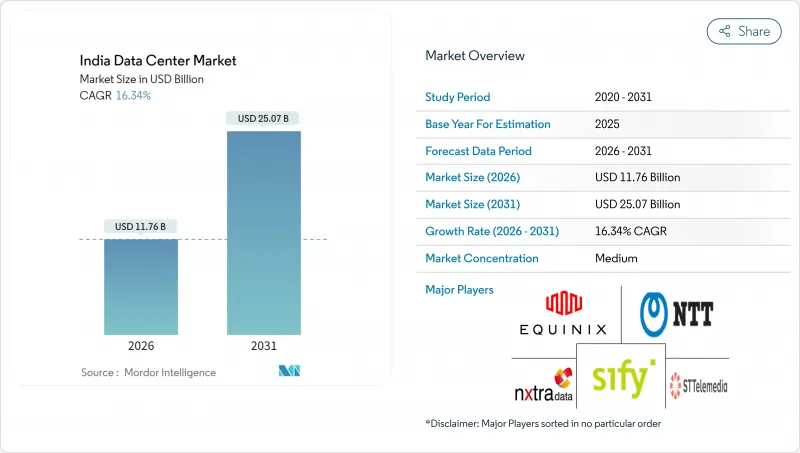
2026년 인도의 데이터센터 시장 규모는 117억 6,000만 달러로 추정되며, 2025년 101억 1,000만 달러에서 성장하여, 2031년에는 250억 7,000만 달러에 이를 것으로 예측됩니다.
2026년부터 2031년까지의 연평균 성장률(CAGR)은 16.34%를 나타낼전망입니다.

IT 부하 용량 측면에서 시장은 2025년 4,480메가와트에서 2030년까지 1만 2,470메가와트로 성장하며, 예측 기간(2025-2030년)에 22.72%의 연평균 복합 성장률(CAGR)로 확대될 것으로 전망되고 있습니다. 시장 세분화의 점유율 및 추정치는 MW 단위로 계산 및 보고됩니다. 이 급격한 확대는 디지털 인디아 정책에 의한 하이퍼스케일 클라우드 투자 촉진, 엣지 노드를 지방 도시로 확대시키는 폭발적인 OTT 트래픽, 데이터 현지화 의무화 규제, 재생에너지 조달 위험을 줄이는 전력 구매 계약(PPA), 국제 대역폭을 4배로 확대하는 해저 케이블 용량, 랙 밀도를 50kW 이상으로 높이는 급증하는 AI 워크로드의 6가지 요인에 기인합니다. 클라우드 프로바이더는 수십억 달러 규모의 캠퍼스를 잇따라 계획하고 있으며, 국내 사업자는 GPU 대응 설계와 재생에너지 용량의 확충에 주력하고 있습니다. 뭄바이와 첸나이의 국제 연결 강화는 국경을 넘는 트래픽 지연을 줄이고 아시아태평양의 상호 연결 허브로서 인도의 데이터센터 시장의 매력을 높입니다. 동시에 RBI(연방준비은행)와 MeitY(전자정보기술부)의 데이터 현지화 의무화로 BFSI(은행, 금융 서비스 및 보험) 및 공공 부문의 사용자로부터 비재량적 수요가 창출되어 장기적인 가동률의 기반이 구축되고 있습니다. 이러한 배경을 바탕으로 신재생에너지, 고밀도 냉각기술, 연안부의 토지 보유를 강점으로 하는 사업자가 전략적 우위성을 확보하고 있습니다.
인도의 데이터센터 시장의 동향 및 인사이트
디지털 인디아 정책 이후 하이퍼스케일 클라우드 배포의 폭발적 성장
릴라이언스 인더스트리는 잠나가르에 300억 달러 규모의 3GW AI 캠퍼스를 발표했으며 이는 인도의 단일 데이터센터 투자로는 최대 규모입니다. AWS, 마이크로소프트, 구글은 인프라 우대 조치와 원스톱 인가 제도의 혜택을 받아 뭄바이, 첸나이, 하이데라바드 주변에서 신규 용량 확대를 위해 150억 달러 이상의 투자를 약속하고 있습니다. 인도의 AI 미션은 1만대의 GPU 도입에 10,371캐롤 루피(12억 5,000만 달러)를 할당해 지속적인 정책 지원을 뒷받침하고 있습니다. 이러한 움직임으로 시설 설계는 50-120kW 랙, 액체 냉각, 현장 재생에너지로 재구축되어 범용 코로케이션에서 전용 하이퍼스케일 캠퍼스로의 경쟁 전환이 진행되고 있습니다.
국내 OTT 동영상 트래픽의 급증으로 엣지 노드 수요 견인
OTT 구독은 두 자릿수 성장을 계속하고 지연에 민감한 캐시를 푸네, 자이푸르, 코친 등의 2급 도시로 확대하고 있습니다. 아쌈, 비하르, 우타르프라데시 동부에서는 2024년에 지방의 광대역 회선이 도시를 넘어서 분산형 인프라의 필요성을 부각시켰습니다. 5-20MW 엣지 사이트는 공급자가 50밀리초 미만의 지연을 달성하여 백홀 비용을 줄이고, 사용자 경험을 개선하는 데 도움이 됩니다. 컴팩트한 설치면적을 전문으로 하는 지역사업자는 이러한 변화를 파악하고 세계의 CDN사업자가 고화질 컨텐츠의 현지화를 위해 지역 PoP를 전개하는 움직임을 활용하고 있습니다.
주간 전력요금 격차가 비용 경쟁력을 저하
산업용 전력요금은 안드라프라데시주의 4.50루피에서 마하라슈트라주의 8.00루피까지 편차가 있어 20년의 자산 수명에서는 40-50%로 차이가 확대됩니다. 기존 서버의 15-20배의 전력을 소비하는 AI 랙은 이 격차가 가장 강하게 작용하는 부문입니다. 오픈 액세스 조달에 관한 정책 협의가 진행 중이며 격차 완화가 기대되지만, 시기는 아직 미정입니다. 이 때문에 사업자는 구글이 구자라트주의 30GW 규모 카브다 프로젝트와 제휴한 사례에서 나타나듯이 자사 전용 태양광 및 풍력 하이브리드 발전과 여러 주에 걸친 재생에너지 PPA(전력 구매 계약)를 추진하고 있습니다.
부문 분석
대규모 시설은 2025년 매출의 22.08%를 차지하면서 하이퍼스케일 테넌트의 핵심 거점으로서의 역할을 확고히 했습니다. 공유 인프라와 50-200MW 규모가 운영 레버리지와 크로스 커넥트의 깊이를 실현합니다. 한편 중규모 사이트는 19.22%의 연평균 복합 성장률(CAGR)을 나타낼 전망입니다. 이는 OTT(스트리밍) 지연을 줄이고 IoT 용도를 지원하는 2급 도시에서의 엣지 노드 배포를 견인합니다. 이 분산 메쉬를 통해 공급자는 최종 사용자와 가까운 곳에 컴퓨팅 리소스를 배치할 수 있으며 메가 캠퍼스를 대체하는 대신 보완할 수 있습니다. AI 모델이 성숙함에 따라 수요는 수기가와트 규모의 캠퍼스와 다수의 중간 규모 기지 사이에서 양극화되고 있습니다.
사업자는 토지 비용, 전력망 접근, 지연 목표 간의 균형을 맞추기 위해 확장 계획을 조정하고 있습니다. 대규모 캠퍼스 개발자는 여러 해저 케이블과 재생에너지 클러스터가 장기적인 내결함성을 제공하는 해안 및 전력이 풍부한 내륙 회랑을 선호합니다. 중규모 사이트 건설업자는 견고한 광섬유 백본을 갖춘 기존 시설(브라운필드)을 모색하고 12-18개월 이내에 가동이 가능한 점을 중시하고 있습니다. 이 타임라인은 사용자 경험의 역치 달성을 두고 경쟁하는 OTT 및 게임 플랫폼에 매우 중요합니다. 지속가능성 요건도 규모 결정에 영향을 미치고 있으며, 이는 절수형 냉각이나 현장 태양광 발전 등의 구성 요소는 20-50MW 단위로의 확장이 보다 예측이 가능하기 때문입니다. 이러한 변수는 허브 거점에서 인도의 데이터센터 시장의 규모를 기반으로 소비 지역에 소규모 노드를 방사형으로 전개하는 이중층 구축 전략을 강화하고 있습니다.
티어 3은 N1 중복성으로 설비 투자와 99.982% 가동률의 균형을 유지하고 2025년에 점유율 49.05%를 유지한 기반층입니다. 한편, BFSI(은행, 금융 서비스 및 보험), 의료, 실시간 거래 플랫폼이 요구하는 99.995% 가동률에 대응하기 위해, 티어 4는 20.25%의 연평균 복합 성장률(CAGR)로 급성장 중입니다. 2N 전원 구성으로 동시에 유지보수가 가능하여 내결함성 레이아웃을 실현할 수 있는 사업자는 고부가가치 워크로드를 획득하고 있습니다. 개발 및 테스트 환경이나 비용 중시의 이용 사례용으로 티어 1 및 2 시설이 유지되지만, 중요도가 높아짐에 따라 그 존재감은 서서히 낮아질 전망입니다.
규제 당국과 보험 회사는 서비스 레벨 계약을 티어 4 기준에 맞추는 경향을 강화하고 있으며, 따라서 기업은 미션 크리티컬 시스템을 상위 레벨로 이행할 수밖에 없습니다. 모듈 설계는 초기 투자를 단계적으로 수행하면서 초기에 티어 4 인증을 획득할 수 있으므로 자본 비용이 줄어듭니다. 더불어 하이브리드 클라우드 설계자는 보조 사이트에 표준화된 티어 3 기능을 추진하여 티어 4의 전체 비용을 부담하지 않고 재해 복구 계획을 간소화합니다. 그 결과, 프리미엄 내결함성과 실용적인 중복성 레벨이 공존하는 계층화된 가동률 구조가 형성되어, 명확한 서비스 레벨 차별화를 제공하는 사업자에게 인도의 데이터센터 시장에서 점유율을 확대하는 계기로 이어지고 있습니다.
인도의 데이터센터 시장 보고서는 데이터센터 규모(대규모, 초대규모, 중규모, 메가, 소규모), 티어 유형(티어 1 및 2, 티어 3, 티어 4), 데이터센터 유형(하이퍼스케일 및 자사 건설, 엔터프라이즈 및 엣지, 코로케이션), 최종 사용자(은행, 금융 서비스 및 보험(BFSI), IT 및 ITES, 전자상거래, 정부, 제조, 미디어 및 엔터테인먼트 등)별로 나뉘며 시장 예측은 IT 부하 용량(MW) 단위로 제공됩니다.
기타 혜택
- 시장 예측(ME) 엑셀 시트
- 3개월 애널리스트 서포트
자주 묻는 질문
목차
제1장 서론
제2장 조사 방법
제3장 주요 요약
제4장 시장 상황
- 시장 개요
- 촉진요인
- 디지털 인디아 정책 이후 하이퍼스케일 클라우드 도입의 폭발적 성장
- 국내 OTT 동영상 트래픽의 급증이 엣지 노드 수요를 견인
- 인도 연방준비은행(RBI) 및 전자정보기술부(MeitY)의 정책에 근거한 데이터 현지화 의무
- 자사 전용 태양광 및 풍력 하이브리드 에너지용 공급량 연동형 전력 구입 계약
- 해저 케이블 육상 거점의 확장이 국제 대역폭 공급을 촉진
- AI-ML 워크로드의 부하 강도 증가로 GPU 고밀도 랙의 필요성 증가
- 억제요인
- 주간 전력 요금 격차로 인한 비용 경쟁력 저하
- 해안부의 수요가 높은 허브에서 토지 취득 지연
- 도시 중심부에서 디젤식 비상용 발전기의 인가 절차 지연
- 전문적인 데이터센터 건설노동력 부족
- 시장 전망
- IT 부하 용량
- 이중 바닥 구조
- 코로케이션 수익
- 랙 설치
- 랙 공간 이용률
- 해저 케이블
- 주요 업계 동향
- 스마트폰 이용자수
- 스마트폰 1대당 데이터 트래픽
- 모바일 데이터 통신 속도
- 광대역 데이터 통신 속도
- 광섬유 연결 네트워크
- 규제 프레임워크
- 밸류체인 및 유통채널 분석
- Porter's Five Forces 분석
- 신규 참가업체의 위협
- 구매자의 협상력
- 공급자의 협상력
- 대체품의 위협
- 경쟁 기업 간 경쟁 관계
제5장 시장 규모 및 성장 예측(메가와트)
- 데이터센터 규모별
- 대규모
- 거대
- 중규모
- 메가
- 소규모
- 티어 유형별
- 티어 1 및 티어 2
- 티어 3
- 티어 4
- 데이터센터 유형별
- 하이퍼스케일 및 자사 건설
- 엔터프라이즈 및 엣지
- 코로케이션
- 미가동
- 가동 중
- 소매 코로케이션
- 도매 코로케이션
- 최종 사용자별
- BFSI
- IT 및 ITES
- 전자상거래
- 정부기관
- 제조업
- 미디어 및 엔터테인먼트
- 통신
- 기타 최종 사용자
- 핫스팟별
- 벵갈루
- 첸나이
- 하이데라바드
- 뭄바이
- 델리 수도권
- 기타 지역
제6장 경쟁 구도
- 시장 집중도
- 전략적 동향
- 시장 점유율 분석
- 기업 프로파일
- NTT Ltd
- CtrlS Datacenters Ltd
- AdaniConneX Private Limited
- STT Telemedia Global Data Centres India Private Limited
- Amazon Web Services Inc
- Princeton Digital Group Limited
- Sify Technologies Limited
- Colt Data Centre Services Holdings Limited
- Nxtra Data Limited
- SAP SE
- Yotta Infrastructure Solutions LLP
- RackBank Datacenters Private Limited
- MilesWeb Internet Services Pvt Ltd
- Pi DATACENTERS Pvt Ltd
- Reliance Communications Limited
- Equinix Inc
- Digital Realty Trust Inc
- Web Werks India Pvt Ltd
- Tata Communications Limited
- Bridge Data Centres India Private Limited
제7장 시장 기회 및 미래 전망
CSM 26.02.04India Data Center Market size in 2026 is estimated at USD 11.76 billion, growing from 2025 value of USD 10.11 billion with 2031 projections showing USD 25.07 billion, growing at 16.34% CAGR over 2026-2031.
In terms of IT load capacity, the market is expected to grow from 4.48 thousand megawatt in 2025 to 12.47 thousand megawatt by 2030, at a CAGR of 22.72% during the forecast period (2025-2030). The market segment shares and estimates are calculated and reported in terms of MW. This sharp expansion stems from six forces: hyperscale cloud investments unlocked by Digital India incentives, explosive OTT traffic that pulls edge nodes into tier-2 cities, mandatory data localization rules, power purchase agreements that derisk renewable sourcing, submarine cable capacity that quadruples international bandwidth, and surging AI workloads that push rack densities above 50 kW. Cloud providers have lined up multi-billion-USD campuses, while domestic operators are pivoting to GPU-ready designs and renewable capacity additions. International connectivity upgrades at Mumbai and Chennai reduce latency for cross-border traffic, enhancing the attractiveness of the India data center market to Asia-Pacific interconnection hubs. Simultaneously, RBI and MeitY localization mandates create non-discretionary demand from BFSI and public-sector users, anchoring long-term utilization. Against this backdrop, operators with renewable power, high-density cooling, and coastal land banks are securing strategic advantages.
India Data Center Market Trends and Insights
Explosive Growth in Hyperscale Cloud Deployments Post-Digital India Incentives
Reliance Industries unveiled a USD 30 billion, 3 GW AI campus in Jamnagar, marking the largest single data center investment in India. AWS, Microsoft, and Google have together pledged more than USD 15 billion for new capacity around Mumbai, Chennai, and Hyderabad, facilitated by infrastructure status benefits and single-window clearances. The India AI Mission earmarked INR 10,371 crore (USD 1.25 billion) for 10,000 GPUs, validating sustained policy support. These moves are reshaping facility design toward 50-120 kW racks, liquid cooling, and on-site renewables, shifting competition from generic colocation toward purpose-built hyperscale campuses.
Escalating Domestic OTT Video Traffic Driving Edge Node Demand
OTT subscriptions keep rising in double digits, driving latency-sensitive caches into tier-2 cities such as Pune, Jaipur and Kochi. Rural broadband lines in Assam, Bihar and Uttar Pradesh East surpassed urban connections in 2024, underlining the need for distributed infrastructure. Edge sites of 5-20 MW help providers meet sub-50 ms latency, trim backhaul costs and improve user experience. Regional operators specializing in compact footprints are capitalizing on this shift as global CDNs deploy regional PoPs to localize high-definition content.
Inter-State Power Tariff Differentials Eroding Cost Competitiveness
Industrial tariffs vary from INR 4.50 in Andhra Pradesh to INR 8.00 in Maharashtra, a 40-50% spread that magnifies over a 20-year asset life. AI racks that draw 15-20 times the power of legacy servers feel this disparity most keenly. Pending policy talks on open-access procurement could ease the gap, yet timelines remain undefined. Operators therefore pursue captive solar-wind hybrids and multi-state renewable PPAs, illustrated by Google's tie-up with the 30 GW Khavda project in Gujarat.
Other drivers and restraints analyzed in the detailed report include:
- Mandated Data Localization Under RBI and MeitY Policies
- Rising AI-ML Workload Intensity Requiring GPU-Dense Racks
- Land Acquisition Delays in Coastal High-Demand Hubs
For complete list of drivers and restraints, kindly check the Table Of Contents.
Segment Analysis
Large facilities represented 22.08% of 2025 revenue, cementing their role as anchor hubs for hyperscale tenants. Shared infrastructure and 50-200 MW scale deliver operating leverage and cross-connect depth. Medium sites, however, will clock a 19.22% CAGR, propelled by edge-node rollouts in tier-2 cities that lower OTT latency and support IoT applications. This distributed mesh allows providers to place compute closer to end users, complementing megacampuses rather than replacing them. As AI models mature, demand is bifurcating between a few giga-watt campuses and numerous mid-sized outposts.
Operators are calibrating expansion plans to balance land costs, grid access, and latency targets. Large-campus developers favor coastal or power-rich inland corridors where multiple subsea cables or renewable clusters offer long-term resilience. Medium-site builders seek brownfield buildings with robust fiber backbones that can be brought online within 12-18 months, a timeline crucial for OTT and gaming platforms racing to meet user-experience thresholds. Sustainability mandates also influence sizing decisions because water-efficient cooling and on-site solar form factors scale more predictably in 20-50 MW blocks. These variables reinforce a two-tier build strategy that anchors the India data center market size at hub locations while radiating smaller nodes into consumption zones.
Tier 3 remains the baseline, retaining a 49.05% 2025 share thanks to N+1 redundancy, which balances capex and achieves 99.982% availability. Yet Tier 4 is accelerating at 20.25% CAGR as BFSI, healthcare, and real-time trading platforms demand 99.995% uptime. Operators that can deliver concurrently maintainable, fault-tolerant layouts with 2N power trains are capturing high-value workloads. Tier 1 and Tier 2 rooms persist for development and testing, as well as cost-sensitive use cases, but face gradual erosion as criticality increases.
Regulators and insurers are increasingly aligning service-level agreements with Tier 4 benchmarks, nudging enterprises to migrate their mission-critical stacks upward. Capital costs are mitigated by modular designs that allow operators to phase in investment while achieving Tier 4 credentials from day one. In parallel, hybrid-cloud architects push for standardized Tier 3 footprints at secondary sites to simplify disaster-recovery blueprints without incurring the full expense of a Tier 4 footprint. The net result is a stratified uptime landscape where premium fault tolerance coexists with pragmatic redundancy tiers, collectively broadening the India data center market share for operators that offer clear service-level differentiation.
The India Data Center Market Report is Segmented by Data Center Size (Large, Massive, Medium, Mega, and Small), Tier Type (Tier 1 and 2, Tier 3, and Tier 4), Data Center Type (Hyperscale/Self-built, Enterprise/Edge, and Colocation), End User (BFSI, IT and ITES, E-Commerce, Government, Manufacturing, Media and Entertainment, Telecom, and More), and Hotspot. The Market Forecasts are Provided in Terms of IT Load Capacity (MW).
List of Companies Covered in this Report:
- NTT Ltd
- CtrlS Datacenters Ltd
- AdaniConneX Private Limited
- STT Telemedia Global Data Centres India Private Limited
- Amazon Web Services Inc
- Princeton Digital Group Limited
- Sify Technologies Limited
- Colt Data Centre Services Holdings Limited
- Nxtra Data Limited
- SAP SE
- Yotta Infrastructure Solutions LLP
- RackBank Datacenters Private Limited
- MilesWeb Internet Services Pvt Ltd
- Pi DATACENTERS Pvt Ltd
- Reliance Communications Limited
- Equinix Inc
- Digital Realty Trust Inc
- Web Werks India Pvt Ltd
- Tata Communications Limited
- Bridge Data Centres India Private Limited
Additional Benefits:
- The market estimate (ME) sheet in Excel format
- 3 months of analyst support
TABLE OF CONTENTS
1 INTRODUCTION
2 RESEARCH METHODOLOGY
3 EXECUTIVE SUMMARY
4 MARKET LANDSCAPE
- 4.1 Market Overview
- 4.2 Market Drivers
- 4.2.1 Explosive growth in hyperscale cloud deployments post-Digital India incentives
- 4.2.2 Escalating domestic OTT video traffic driving edge node demand
- 4.2.3 Mandated data localisation under RBI and MeitY policies
- 4.2.4 Availability-linked power-purchase agreements for captive solar-wind hybrid energy
- 4.2.5 Submarine cable landing expansions boosting international bandwidth supply
- 4.2.6 Rising AI-ML workload intensity requiring GPU-dense racks
- 4.3 Market Restraints
- 4.3.1 Inter-state power tariff differentials eroding cost competitiveness
- 4.3.2 Land acquisition delays in coastal high-demand hubs
- 4.3.3 Slow clearances for diesel-based backup generators in urban cores
- 4.3.4 Shortage of specialised data center construction labour
- 4.4 Market Outlook
- 4.4.1 IT Load Capacity
- 4.4.2 Raised Floor Space
- 4.4.3 Colocation Revenue
- 4.4.4 Installed Racks
- 4.4.5 Rack Space Utilization
- 4.4.6 Submarine Cable
- 4.5 Key Industry Trends
- 4.5.1 Smartphone Users
- 4.5.2 Data Traffic Per Smartphone
- 4.5.3 Mobile Data Speed
- 4.5.4 Broadband Data Speed
- 4.5.5 Fiber Connectivity Network
- 4.5.6 Regulatory Framework
- 4.6 Value Chain and Distribution Channel Analysis
- 4.7 Porter's Five Forces Analysis
- 4.7.1 Threat of New Entrants
- 4.7.2 Bargaining Power of Buyers
- 4.7.3 Bargaining Power of Suppliers
- 4.7.4 Threat of Substitutes
- 4.7.5 Competitive Rivalry
5 MARKET SIZE AND GROWTH FORECASTS (MEGAWATT)
- 5.1 By Data Center Size
- 5.1.1 Large
- 5.1.2 Massive
- 5.1.3 Medium
- 5.1.4 Mega
- 5.1.5 Small
- 5.2 By Tier Type
- 5.2.1 Tier 1 and 2
- 5.2.2 Tier 3
- 5.2.3 Tier 4
- 5.3 By Data Center Type
- 5.3.1 Hyperscale / Self-built
- 5.3.2 Enterprise / Edge
- 5.3.3 Colocation
- 5.3.3.1 Non-Utilized
- 5.3.3.2 Utilized
- 5.3.3.2.1 Retail Colocation
- 5.3.3.2.2 Wholesale Colocation
- 5.4 By End User
- 5.4.1 BFSI
- 5.4.2 IT and ITES
- 5.4.3 E-Commerce
- 5.4.4 Government
- 5.4.5 Manufacturing
- 5.4.6 Media and Entertainment
- 5.4.7 Telecom
- 5.4.8 Other End Users
- 5.5 By Hotspot
- 5.5.1 Bengaluru
- 5.5.2 Chennai
- 5.5.3 Hyderabad
- 5.5.4 Mumbai
- 5.5.5 Delhi-NCR
- 5.5.6 Rest of India
6 COMPETITIVE LANDSCAPE
- 6.1 Market Concentration
- 6.2 Strategic Moves
- 6.3 Market Share Analysis
- 6.4 Company Profiles (includes Global level Overview, Market level overview, Core Segments, Financials as available, Strategic Information, Market Rank/Share for key companies, Products and Services, and Recent Developments)
- 6.4.1 NTT Ltd
- 6.4.2 CtrlS Datacenters Ltd
- 6.4.3 AdaniConneX Private Limited
- 6.4.4 STT Telemedia Global Data Centres India Private Limited
- 6.4.5 Amazon Web Services Inc
- 6.4.6 Princeton Digital Group Limited
- 6.4.7 Sify Technologies Limited
- 6.4.8 Colt Data Centre Services Holdings Limited
- 6.4.9 Nxtra Data Limited
- 6.4.10 SAP SE
- 6.4.11 Yotta Infrastructure Solutions LLP
- 6.4.12 RackBank Datacenters Private Limited
- 6.4.13 MilesWeb Internet Services Pvt Ltd
- 6.4.14 Pi DATACENTERS Pvt Ltd
- 6.4.15 Reliance Communications Limited
- 6.4.16 Equinix Inc
- 6.4.17 Digital Realty Trust Inc
- 6.4.18 Web Werks India Pvt Ltd
- 6.4.19 Tata Communications Limited
- 6.4.20 Bridge Data Centres India Private Limited
7 MARKET OPPORTUNITIES AND FUTURE OUTLOOK
- 7.1 White-space and unmet-need assessment