


|
시장보고서
상품코드
1693412
실란트 시장 : 점유율 분석, 산업 동향, 통계, 성장 예측(2025-2030년)Sealants - Market Share Analysis, Industry Trends & Statistics, Growth Forecasts (2025 - 2030) |
||||||
■ 보고서에 따라 최신 정보로 업데이트하여 보내드립니다. 배송일정은 문의해 주시기 바랍니다.
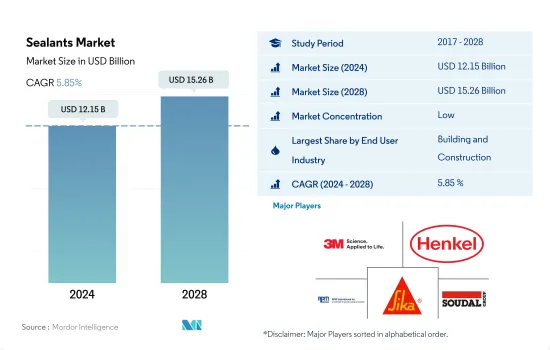
실란트 시장 규모는 2024년에 121억 5,000만 달러에 달했고, 2028년에는 152억 6,000만 달러에 이를 것으로 예상되며, 시장 예측 기간(2024-2028년)동안 CAGR 5.85%로 성장할 것으로 예측됩니다.

방수와 균열 실링의 용도 확대가 수요를 견인
- 실란트는 방수, 내후성 실링, 균열 실링 등의 용도가 있기 때문에 건설 산업에서 널리 사용되고 있습니다. 인도, 미국, 인도네시아 등의 국가들이 건설 전체의 성장의 58.3%를 차지할 것으로 예상되고 있기 때문에 건설용 실란트가 세계의 실란트 시장 점유율의 금액 기준으로 최대의 점유율을 차지하고 있습니다.
- 실란트는 유리, 금속, 플라스틱, 도장면 등의 표면에 적용할 수 있기 때문에 자동차 산업에서 널리 사용되고 있으며, 그 특징은 극단적인 내후성, 내구성, 오래 지속되는 등 자동차 산업에서 유용합니다. 이것들은 엔진과 자동차 개스킷에 사용되고 있습니다. 자동차 산업의 전기자동차 부문은 성장 경제권에서 수요 증가에 의해 예측 기간 중에 세계에서 17.75%의 연평균 복합 성장률(CAGR)로 성장할 것으로 예상됩니다.
- 다양한 실란트는 전자기기나 전기기기의 제조에 널리 사용되고 있으며, 이들은 센서나 케이블의 씰에 사용됩니다.
- 실란트는 의료 산업에 있어서, 의료기기 부품의 조립이나 씰등의 용도에 사용되고 있습니다.세계의 의료 투자 증가는 예측 기간중 수요 증가로 연결됩니다.
아시아태평양 건설 산업에 대한 투자가 시장을 견인
- 아시아태평양, 유럽, 북미는 세계의 실란트 시장에서 가장 중요한 지역입니다. 이 세 지역을 합치면 세계의 실란트 시장의 90.2%를 차지합니다. 하지만 2020년에는 COVID-19의 대유행에 의한 다양한 조업 제한으로 인해 실란트 수요는 감소했습니다.
- 아시아태평양은 건축 및 건설산업과 자동차산업 증가에 따라 실란트의 소비량에 있어서 최대의 지역이 되고 있습니다. 중국은 세계 최대 건설 산업으로, 2022년부터 2030년까지 연평균 8.6%의 성장률로 성장할 것으로 예측되고 있습니다.
- 유럽은 자동차 산업 수요가 증가함에 따라 실란트 소비량에서 2위를 차지하고 있습니다. 55''법에서는 2030년까지 자동차의 CO2 배출량을 55%, 밴의 CO2 배출량을 50% 삭감한다는 목표가 설정되어 있습니다.
세계 실란트 시장 동향
주택 인프라 개발의 진전에 의한 건설 섹터의 번영
- 건축 및 건설산업은 꾸준한 성장을 보였으며, 2017-2019년의 CAGR은 2.6%를 나타냈습니다. COVID-19 팬데믹은 세계의 건축 및 건설 산업에 큰 영향을 주었습니다. 노동력 공급의 제약, 건설 재정과 공급 체인의 혼란, 경제의 불확실성이 세계의 건축 및 건설 산업에 부정적인 영향을 주었습니다.
- 2021년에는 플러스 성장을 나타낸 것, 유통에 의한 공급 체인에 대한 영향은 원료 가격의 상승을 초래해, 여전히 산업을 괴롭히고 있습니다. 태평양의 나라들은 지원 제도를 제공하는 것으로, 경제 사이클을 재기동시키기 위해 건설 산업을 이용해 왔습니다.
- 아시아태평양은 건설활동량이 가장 많아 중국, 인도, 일본, 인도네시아, 한국 등의 나라에서 엄청난 인구, 도시화의 진전, 인프라 개척에 대한 투자 증가로 2028년까지 최대 건설시장이 될 것으로 예측됩니다.
- 그린빌딩의 중시가 높아져, 세계의 건설 활동으로부터의 배출을 삭감하는 대처가 진행됨으로써, 예측 기간중, 더 지속 가능한 운영 절차로 이어질 것으로 예상됩니다.
전기자동차를 촉진하는 유리한 정부 시책이 자동차 산업을 뒷받침
- 2021년 이후 세계 자동차 산업은 안정적으로 성장할 것으로 예상되지만, 그 페이스는 둔화하고 있습니다.
- 2020년에는 코로나19 팬데믹의 영향으로 자동차 판매 대수가 감소했으나, 자동차 시장이 각국 GDP에 크게 기여하는 경향이 있어 각국 정부가 경제 지원책을 강구하면서 2021년에는 급속히 회복되었습니다. 자동차 판매 대수는 2019년 승용차 9천만 대에서 2020년에는 7천8백만 대로 줄었습니다.
- 세계의 전기자동차 도입은 저가의 에너지 비용, 친환경성, 효율적인 모빌리티 기능으로 세계 자동차 시장 전체의 수익에 크게 공헌하고 있습니다. IEA(국제에너지기구)의 지속가능 시나리오에 따르면 2030년까지 2억 3,000만대의 전기자동차가 연소 연료를 사용하는 자동차를 대체해야 합니다. 2021년, 최대 전기차 제조업체인 Tesla는 전기차 제조 대수가 157% 증가했습니다.
실란트 산업 개요
실란트 시장은 세분화되어 있어 상위 5개사에서 22.90%를 차지하고 있습니다. 이 시장의 주요 기업은 3M, Henkel AG & Co. KGaA, RPM International Inc., Sika AG, Soudal Holding NV 등입니다.
기타 혜택
- 엑셀 형식 시장 예측(ME) 시트
- 3개월의 애널리스트 서포트
목차
제1장 주요 요약과 주요 조사 결과
제2장 보고서 제안
제3장 소개
- 조사의 전제조건과 시장 정의
- 조사 범위
- 조사 방법
제4장 주요 산업 동향
- 최종 사용자 동향
- 항공우주
- 자동차
- 건축 및 건설
- 규제 프레임워크
- 아르헨티나
- 호주
- 브라질
- 캐나다
- 중국
- EU
- 인도
- 인도네시아
- 일본
- 말레이시아
- 멕시코
- 러시아
- 사우디아라비아
- 싱가포르
- 남아프리카
- 한국
- 태국
- 미국
- 밸류체인과 유통채널 분석
제5장 시장 세분화
- 최종 사용자 산업
- 항공우주
- 자동차
- 건축 및 건설
- 의료
- 기타
- 수지
- 아크릴
- 에폭시
- 폴리우레탄
- 실리콘
- 기타
- 지역
- 아시아태평양
- 호주
- 중국
- 인도
- 인도네시아
- 일본
- 말레이시아
- 싱가포르
- 한국
- 태국
- 기타 아시아태평양
- 유럽
- 프랑스
- 독일
- 이탈리아
- 러시아
- 스페인
- 영국
- 기타 유럽
- 중동 및 아프리카
- 사우디아라비아
- 남아프리카
- 기타 중동 및 아프리카
- 북미
- 캐나다
- 멕시코
- 미국
- 기타 북미
- 남미
- 아르헨티나
- 브라질
- 기타 남미
- 아시아태평양
제6장 경쟁 구도
- 주요 전략 동향
- 시장 점유율 분석
- 기업 상황
- 기업 프로파일
- 3M
- Arkema Group
- Dow
- HB Fuller Company
- Henkel AG & Co. KGaA
- Illinois Tool Works Inc.
- MAPEI SpA
- Momentive
- RPM International Inc.
- 신에츠 케미컬(주)
- Sika AG
- Soudal Holding NV
- THE YOKOHAMA RUBBER CO., LTD.
- ThreeBond Holdings Co., Ltd.
- Wacker Chemie AG
제7장 CEO에 대한 주요 전략적 질문
제8장 부록
- 세계의 접착제 및 실란트 산업 개요
- 개요
- Five Forces 분석 프레임워크(산업 매력도 분석)
- 세계의 밸류체인 분석
- 성장 촉진요인, 억제요인, 기회
- 정보원과 참고문헌
- 도표 일람
- 주요 인사이트
- 데이터 팩
- 용어집
The Sealants Market size is estimated at 12.15 billion USD in 2024, and is expected to reach 15.26 billion USD by 2028, growing at a CAGR of 5.85% during the forecast period (2024-2028).
Increasing applications of waterproofing and crack sealing to drive the demand
- Sealants are widely used in the construction industry because of their applications, such as waterproofing, weather-sealing, and crack sealing. The global construction industry is expected to grow at 3.5% per annum up to 2030. Countries such as China, India, the United States, and Indonesia are expected to cover 58.3% of overall construction growth, due to which construction sealants cover the largest share of the global sealants market share by value.
- Sealants are widely used in the automotive industry because of their applicability to surfaces, such as glass, metal, plastic, and painted surfaces, and their features are helpful in the automotive industry, such as extreme weather resistance, durability, and long-lasting. These are used in engines and car gaskets. The electric vehicles segment of the automotive industry is expected to register a CAGR of 17.75% globally in the forecast period because of the increase in demand for the same in growing economies. This will increase the demand for automotive silicone sealants in the forecast period.
- Different sealants are widely used in electronics and electrical equipment manufacturing. They are used for sealing sensors and cables. The electronics and household appliances industries are expected to register a CAGR of 2.51% and 5.77%, respectively, globally, which will lead to an increase in demand for silicone sealants during the forecast period (2022-2028).
- Sealants are used in the healthcare industry for applications such as assembling and sealing medical device parts. The increase in healthcare investments globally will lead to an increase in their demand in the forecast period.
Considerable investment in construction industry specifically in Asia-Pacific region will drive the market
- Asia-Pacific, Europe, and North America are the most significant regions in the global sealants market. Combined, these three regions account for 90.2% of the global sealants market. Sealants registered growth rates of 2.35% and 3.52% in 2018 and 2019, respectively, across all the major global regions. However, the demand for sealants declined in 2020 due to various operational restrictions because of the COVID-19 pandemic. In 2021, as the restrictions eased, the global market for sealants started recovering. It is now expected to outgrow the pre-pandemic levels.
- Asia-Pacific is the largest region in terms of the consumption of sealants, owing to the rising building and construction industry and the automotive industry in the area. Around 45% of the total construction-based investment in the world comes from this region. China is the world's largest construction industry, and it is expected to register a CAGR of 8.6% from 2022 to 2030. In Japan, the number of housing constructions in 2021 was 856.48 thousand units, which was 4.8% more than the number in 2020. The growing Asia-Pacific construction industry will drive the demand for sealants in the coming years.
- Europe is the second-largest region in terms of the consumption of sealants due to the rising demand from the automotive industry. As part of the European Commission's climate goals to reduce greenhouse emissions by at least 55% by 2030, the ''Fit for 55'' legislation has set targets to reduce CO2 emissions from cars by 55% and vans by 50% by 2030. This regulation has boosted the demand for electric vehicles, which is expected to increase the demand for PU, acrylic, and silicone-based sealants during the forecast period, as they can also be used in automotive electronics.
Global Sealants Market Trends
Growing residential and infrastructural development to thrive the construction sector
- The building and construction industry witnessed steady growth, with a CAGR of 2.6% from 2017 to 2019. This growth was driven by the upswing in global economic activity and increasing demand for single-family homes. In 2020, the COVID-19 pandemic had a major impact on the global building and construction industry. Constraints in labor supply, disruptions in construction finances and the supply chain, and economic uncertainty negatively impacted the global building and construction industry.
- Though the industry showed positive growth in 2021, the pandemic's effect on supply chains, which resulted in a hike in raw material prices, is still plaguing the industry. However, as the construction industry heavily influences a nation's economy, countries in Europe, North America, and Asia-Pacific have used the construction industry to restart their economic cycles by offering support schemes. Some support schemes include the Homebuilder Programme in Australia and the economic recovery plan of EU countries.
- The Asia-Pacific region experiences the highest volume of construction activities, and it is expected to remain the largest construction market till 2028 due to its huge population, increasing urbanization, and increasing investments in infrastructural development in countries like China, India, Japan, Indonesia, and South Korea.
- Increasing emphasis on green buildings and efforts to reduce emissions from global construction activities are expected to result in more sustainable operational procedures during the forecast period. For example, France has sanctioned EUR 7.5 billion for the construction industry to transform itself into a low-carbon energy economy.
Favorable government policies to promote electric vehicles will propel automotive industry
- Since 2021, the global automotive industry has been expected to grow steadily but at a slower pace because of the decline in consumers' preferences for individual ownership of passenger vehicles and their increased preference for shared mobility in transportation. The global automotive industry is expected to experience a growth rate of 2% annually, with an expected value addition of USD 1.5 trillion in total revenue during the forecast period.
- In 2020, due to the impact of the COVID-19 pandemic, vehicle sales declined but recovered rapidly in 2021 because the governments of various countries took measures to support their economies, as automotive markets usually contribute majorly to their GDP. Vehicle sales declined from 90 million units of passenger vehicles in 2019 to 78 million units in 2020.
- The introduction of electric vehicles worldwide has contributed significantly to the overall revenue of the global automotive market because of their cheaper energy costs, environmentally benign nature, and efficient mobility features. Various government policies and standards also work as driving factors to increase EV production. For instance, the EU standards for CO2 emissions increased the demand for electric vehicles in 2021. As per the IEA's Sustainable Scenario, 230 million electric vehicles are required to replace combustion fuel-based vehicles by 2030. In 2021, Tesla, the largest EV manufacturer, recorded a rise of 157% in the number of electric vehicles manufactured. This growing trend of consumers preferring electric vehicles is expected to rise further during the forecast period (2022-2028).
Sealants Industry Overview
The Sealants Market is fragmented, with the top five companies occupying 22.90%. The major players in this market are 3M, Henkel AG & Co. KGaA, RPM International Inc., Sika AG and Soudal Holding N.V. (sorted alphabetically).
Additional Benefits:
- The market estimate (ME) sheet in Excel format
- 3 months of analyst support
TABLE OF CONTENTS
1 EXECUTIVE SUMMARY & KEY FINDINGS
2 REPORT OFFERS
3 INTRODUCTION
- 3.1 Study Assumptions & Market Definition
- 3.2 Scope of the Study
- 3.3 Research Methodology
4 KEY INDUSTRY TRENDS
- 4.1 End User Trends
- 4.1.1 Aerospace
- 4.1.2 Automotive
- 4.1.3 Building and Construction
- 4.2 Regulatory Framework
- 4.2.1 Argentina
- 4.2.2 Australia
- 4.2.3 Brazil
- 4.2.4 Canada
- 4.2.5 China
- 4.2.6 EU
- 4.2.7 India
- 4.2.8 Indonesia
- 4.2.9 Japan
- 4.2.10 Malaysia
- 4.2.11 Mexico
- 4.2.12 Russia
- 4.2.13 Saudi Arabia
- 4.2.14 Singapore
- 4.2.15 South Africa
- 4.2.16 South Korea
- 4.2.17 Thailand
- 4.2.18 United States
- 4.3 Value Chain & Distribution Channel Analysis
5 MARKET SEGMENTATION (includes market size in Value in USD and Volume, Forecasts up to 2028 and analysis of growth prospects)
- 5.1 End User Industry
- 5.1.1 Aerospace
- 5.1.2 Automotive
- 5.1.3 Building and Construction
- 5.1.4 Healthcare
- 5.1.5 Other End-user Industries
- 5.2 Resin
- 5.2.1 Acrylic
- 5.2.2 Epoxy
- 5.2.3 Polyurethane
- 5.2.4 Silicone
- 5.2.5 Other Resins
- 5.3 Region
- 5.3.1 Asia-Pacific
- 5.3.1.1 Australia
- 5.3.1.2 China
- 5.3.1.3 India
- 5.3.1.4 Indonesia
- 5.3.1.5 Japan
- 5.3.1.6 Malaysia
- 5.3.1.7 Singapore
- 5.3.1.8 South Korea
- 5.3.1.9 Thailand
- 5.3.1.10 Rest of Asia-Pacific
- 5.3.2 Europe
- 5.3.2.1 France
- 5.3.2.2 Germany
- 5.3.2.3 Italy
- 5.3.2.4 Russia
- 5.3.2.5 Spain
- 5.3.2.6 United Kingdom
- 5.3.2.7 Rest of Europe
- 5.3.3 Middle East & Africa
- 5.3.3.1 Saudi Arabia
- 5.3.3.2 South Africa
- 5.3.3.3 Rest of Middle East & Africa
- 5.3.4 North America
- 5.3.4.1 Canada
- 5.3.4.2 Mexico
- 5.3.4.3 United States
- 5.3.4.4 Rest of North America
- 5.3.5 South America
- 5.3.5.1 Argentina
- 5.3.5.2 Brazil
- 5.3.5.3 Rest of South America
- 5.3.1 Asia-Pacific
6 COMPETITIVE LANDSCAPE
- 6.1 Key Strategic Moves
- 6.2 Market Share Analysis
- 6.3 Company Landscape
- 6.4 Company Profiles (includes Global Level Overview, Market Level Overview, Core Business Segments, Financials, Headcount, Key Information, Market Rank, Market Share, Products and Services, and Analysis of Recent Developments).
- 6.4.1 3M
- 6.4.2 Arkema Group
- 6.4.3 Dow
- 6.4.4 H.B. Fuller Company
- 6.4.5 Henkel AG & Co. KGaA
- 6.4.6 Illinois Tool Works Inc.
- 6.4.7 MAPEI S.p.A.
- 6.4.8 Momentive
- 6.4.9 RPM International Inc.
- 6.4.10 Shin-Etsu Chemical Co., Ltd.
- 6.4.11 Sika AG
- 6.4.12 Soudal Holding N.V.
- 6.4.13 THE YOKOHAMA RUBBER CO., LTD.
- 6.4.14 ThreeBond Holdings Co., Ltd.
- 6.4.15 Wacker Chemie AG
7 KEY STRATEGIC QUESTIONS FOR ADHESIVES AND SEALANTS CEOS
8 APPENDIX
- 8.1 Global Adhesives and Sealants Industry Overview
- 8.1.1 Overview
- 8.1.2 Porter's Five Forces Framework (Industry Attractiveness Analysis)
- 8.1.3 Global Value Chain Analysis
- 8.1.4 Drivers, Restraints, and Opportunities
- 8.2 Sources & References
- 8.3 List of Tables & Figures
- 8.4 Primary Insights
- 8.5 Data Pack
- 8.6 Glossary of Terms


샘플 요청 목록