
|
시장보고서
상품코드
1693512
베트남의 특수 비료 시장 : 시장 점유율 분석, 산업 동향 및 통계, 성장 예측(2025-2030년)Vietnam Specialty Fertilizer - Market Share Analysis, Industry Trends & Statistics, Growth Forecasts (2025 - 2030) |
||||||
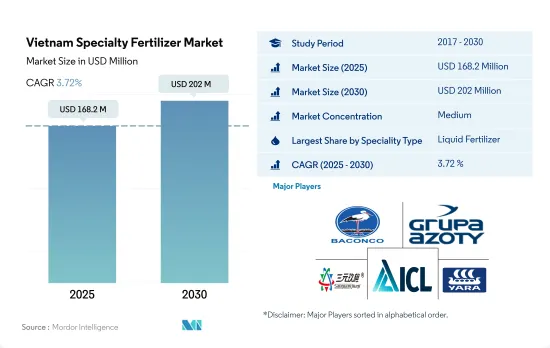
베트남의 특수 비료 시장 규모는 2025년에 1억 6,820만 달러로 추정되고, 2030년에는 2억 200만 달러에 이를 것으로 예측되며, 예측 기간인 2025-2030년 CAGR 3.72%로 성장할 전망입니다.
고효율 비료에 대한 수요 증가가 특수 비료 수요 촉진
- 베트남의 특수 비료 시장에서는 수용성 비료가 2022년에 6,590만 달러에 달한 것으로 확인되었습니다. 수용성 비료는 농가가 식물의 성장 사이클에 맞춰 영양소의 농도를 조정할 수 있는 유연성을 제공합니다. 식물의 뿌리 근처에 가용성 비료를 사용하는 것으로, 농가는 생육기 전체에 걸쳐 넓은 면적에 집중적으로 시비하는 것보다 비용을 절약할 수 있습니다. 이러한 이점이 베트남의 수용성 비료 수요를 뒷받침하고 있습니다.
- 2020년 베트남 특수 비료 시장 규모는 1,510만 달러 감소했지만, 이것은 주로 COVID-19의 봉쇄에 의한 국제 무역의 혼란이 원인입니다. 이 감소는 전년의 동향에 이은 것이었습니다. 또한 시장은 기온 변동, 불규칙한 강우, 가뭄 등의 과제에 직면했습니다.
- 베트남의 특수 비료 시장은 액체 비료가 지배적입니다. 작물의 품질 향상, 수출 규격 적합, 정밀 농업의 채택이 중시되면서 이 분야의 원예 작물 금액은 2023-2030년 CAGR 4.6%를 기록할 것으로 예측됩니다.
- 방출 조절 비료(CRF)와 슬로우 릴리스 비료(SRF)는 일정한 속도로 점진적으로 영양소를 방출하고 토양 조건의 영향을 받으면서 시즌을 통해 작물의 요구에 부응합니다. CRF와 SRF의 이러한 독특한 특징은 비료 사용량과 환경 악화를 줄일 뿐만 아니라 농부들에게 경제적 이익을 제공합니다. 그 결과 이러한 비료 시장은 2023-2030년 크게 성장할 전망입니다.
베트남의 특수 비료 시장 동향
베트남 정부는 생산 비용을 줄이는 정책을 추진하고 있으며, 이로 인해 농작물의 재배 면적이 증가할 것으로 예상됩니다.
- 베트남은 농작물에 많은 토지를 할당하고 있으며, 쌀, 옥수수 및 기타 주식이 주요 대상입니다. 다양한 기후와 지형으로 베트남에서는 다양한 작물을 재배할 수 있습니다. 그러나 조사 기간 동안 농작물 재배 면적은 6.6% 감소했습니다.
- 쌀은 주식이기 때문에 베트남 주요 농작물의 중심을 차지합니다. 총 재배 면적의 81.8%를 차지하고, 옥수수가 10.2%로 이어집니다. 2022년 베트남의 쌀 생산량은 약 4,390만 톤에 달했고, 세계 최고의 수출국으로서의 지위를 굳혔습니다.
- 베트남은 겨울부터 봄(조장), 여름부터 가을(중반), 가을부터 겨울(긴 우기)의 3가지 명확한 작기를 경험합니다. 베트남의 주요 농업 거점은 홍하 델타, 메콩강 델타, 남부 테라스입니다. 쌀은 3개 지역 모두에서 주요 작물이 되고 있으며, 메콩 델타만으로 베트남의 쌀 수출의 절반을 차지하고 있습니다.
- 베트남 정부는 생산 비용 절감을 목적으로 한 정책을 실시했습니다. 이러한 시책에는 비료나 농약의 사용량 삭감, 현지산 비료의 보급, 밭작물의 생산성, 품질, 수익성의 향상에서 비료의 역할 강조 등이 포함됩니다. 영양 부족에 의한 흉작이 증가하고 있는 것이나, 식물의 왜소화에 대항하기 위해서 고효율 비료가 필요한 것도, 베트남의 비료 시장을 강화하고 있는 요인입니다.
질소는 다양한 농작물에 필수적인 영양소이며, 그 적용량은 현저하게 증가하고 있습니다.
- 2022년 베트남의 농작물의 1차 양분의 평균 시용량은 1 헥타르 당 123.94 kg이었습니다. 이 분야에서는 곡물 및 곡류가 비료의 최대 소비자로 떠올랐습니다. 특히, 쌀, 밀, 옥수수는 베트남의 곡물 작물 중 1위이며, 동년의 1차 양분의 평균 시용량은 각각 155.49kg/ha, 228.90kg/ha, 148.49kg/ha였습니다.
- 1차 양분 중에서는 질소가 가장 많았고, 농작물의 평균 시용량은 221.43kg/헥타르였습니다. 이렇게 질소가 중시되는 것은 경작, 잎 면적 개발, 알갱이 형성, 충전, 단백질 합성 등 작물 성장의 다양한 측면을 강화하는 역할에서 유래합니다. 질소는 또한 수확량과 품질 모두에 좋은 영향을 미칩니다. 밀이 492.06kg/ha로 가장 높은 질소 시용량의 영관에 올랐고, 그 다음으로 쌀이 328.04kg/ha였습니다.
- 베트남의 Vinh Phuc성에서는 토양의 상당 부분이 열화에 시달리고 있으며, 유기물이 적고, 전체 이용 가능 질소가 0.08% 이하, 전체 인이 0.04% 이하, 전체 칼륨이 1.0% 이하인 것이 특징입니다. 또한 이용 가능한 인은 10ppm을 밑돌고 있습니다. 이러한 결핍이 베트남의 비료 소비량을 급증시켜 1969년 49.2kg/ha에서 2018년 415.3kg/ha로 증가했으며 CAGR 6.71%로 나타났습니다.
- 베트남 인구의 43%가 농업에 종사하고 있음에도 불구하고, 이 부문의 GDP에 대한 기여는 작고 약 12.36%에 불과합니다. 그러나 국가가 농업 안정을 추구하는 가운데 비료 수요는 증가 일로를 걷고 있어 2023-2030년 베트남 비료 시장의 성장을 뒷받침하고 있습니다.
베트남의 특수 비료 산업 개요
베트남의 특수 비료 시장은 적당히 통합되어 있으며 주요 5개사에서 60.32%를 차지하고 있습니다. 이 시장 주요 기업은 다음과 같습니다. Baconco, Grupa Azoty S.A.(Compo Expert), Hebei Sanyuanjiuqi Fertilizer, ICL Group Ltd and Yara International ASA.(알파벳순 정렬)
기타 혜택
- 엑셀 형식 시장 예측(ME) 시트
- 3개월의 애널리스트 서포트
목차
제1장 주요 요약 및 주요 조사 결과
제2장 보고서 제안
제3장 서문
- 조사의 전제조건 및 시장 정의
- 조사 범위
- 조사 방법
제4장 주요 산업 동향
- 주요 작물의 작부 면적
- 농작물
- 원예작물
- 평균 양분 시용률
- 미량영양소
- 농작물
- 원예작물
- 1차 영양소
- 농작물
- 원예작물
- 2차 다량 영양소
- 농작물
- 원예작물
- 미량영양소
- 관개 농지
- 규제 프레임워크
- 밸류체인 및 유통채널 분석
제5장 시장 세분화
- 스페셜리티 유형별
- CRF
- 폴리머 코트
- 폴리머 유황 코팅
- 기타
- 액체 비료
- SRF
- 수용성
- CRF
- 시비 모드별
- 시비
- 잎면 살포
- 토양
- 작물 유형별
- 농작물
- 원예작물
- 잔디 및 관상용
제6장 경쟁 구도
- 주요 전략 동향
- 시장 점유율 분석
- 기업 상황
- 기업 프로파일
- Baconco
- Grupa Azoty SA(Compo Expert)
- Haifa Group
- Hebei Sanyuanjiuqi Fertilizer Co., Ltd.
- ICL Group Ltd
- Yara International ASA
제7장 CEO에 대한 주요 전략적 질문
제8장 부록
- 세계 개요
- 개요
- Porter's Five Forces 분석 프레임워크
- 세계의 밸류체인 분석
- 시장 역학(DROs)
- 정보원 및 참고문헌
- 도표 일람
- 주요 인사이트
- 데이터 팩
- 용어집
The Vietnam Specialty Fertilizer Market size is estimated at 168.2 million USD in 2025, and is expected to reach 202 million USD by 2030, growing at a CAGR of 3.72% during the forecast period (2025-2030).
The rising demand for highly efficient fertilizers is driving the demand for specialty fertilizers
- The Vietnamese specialized fertilizer market witnessed water-soluble fertilizers reaching a value of USD 65.9 million in 2022. These fertilizers offer farmers the flexibility to adjust nutrient concentrations as per the evolving needs of plants during their growth cycle. By applying soluble fertilizers near the plant's root zone, farmers can save costs compared to intensive fertilization across a large area for the entire growing season. These advantages are fueling the demand for water-soluble fertilizers in Vietnam.
- The year 2020 saw the Vietnam specialty fertilizer market value decline by USD 15.1 million, primarily due to disruptions in international trade caused by the COVID-19 lockdown. This decline followed a trend from the previous year. Additionally, the market faced challenges from temperature fluctuations, erratic rainfall, and droughts.
- Liquid fertilizers dominate the specialty fertilizer market in Vietnam. With a growing emphasis on improving crop quality, meeting export standards, and adopting precision farming, the value of horticulture crops in this segment is projected to register a CAGR of 4.6% from 2023 to 2030.
- Control-release fertilizers (CRFs) and slow-release fertilizers (SRFs) gradually release nutrients at a consistent pace, catering to crop needs throughout the season, influenced by soil conditions. This unique feature of CRFs and SRFs not only reduces fertilizer usage and environmental degradation but also brings economic benefits to farmers. Consequently, the market for these fertilizers is poised for significant growth during 2023-2030.
Vietnam Specialty Fertilizer Market Trends
The Vietnamese government has been promoting policies to reduce production costs, which is expected to increase the cultivation area under field crops
- Vietnam allocates significant land to field crops, with major focuses on rice, maize (corn), and other staples. Owing to its diverse climate and topography, Vietnam can cultivate a wide array of crops. However, the country witnessed a 6.6% decline in the area dedicated to field crop cultivation during the study period.
- Rice takes center stage as Vietnam's primary field crop, given its status as a staple food. It dominates the cultivation landscape, accounting for 81.8% of the total area, followed by corn at 10.2%. In 2022, Vietnam's rice production reached around 43.9 million metric tons, solidifying its position as a leading global exporter.
- Vietnam experiences three distinct cropping seasons: winter-spring (early season), summer-autumn (midseason), and autumn-winter (longer rainy season). Key agricultural hubs in the country encompass the Red River Delta, Mekong River Delta, and Southern Terrace. Rice stands as the primary crop across all three regions, with the Mekong Delta alone contributing to half of Vietnam's rice exports.
- The Vietnamese government has implemented policies aimed at reducing production costs. These measures include cutting back on fertilizer and pesticide usage, promoting locally-sourced fertilizers, and emphasizing their role in enhancing field crop productivity, quality, and profitability. The increase in crop failures due to nutrient deficiencies and the need for high-efficiency fertilizers to combat plant dwarfism are additional factors bolstering Vietnam's fertilizers market.
Nitrogen is a vital nutrient required for a range of field crops, and its application is notably higher
- In 2022, field crops in Vietnam saw an average application rate of 123.94 kg per hectare for primary nutrients. Within this segment, grains and cereals emerged as the largest consumers of fertilizers. Notably, rice, wheat, and maize stood out as the top cereal crops in Vietnam, with average primary nutrient application rates of 155.49 kg/ha, 228.90 kg/ha, and 148.49 kg/ha, respectively, in the same year.
- Among the primary nutrients, nitrogen took the lead, with an average application rate of 221.43 kg/hectare for field crops. This emphasis on nitrogen stems from its role in bolstering various aspects of crop growth, such as tillering, leaf area development, grain formation, filling, and protein synthesis. It also positively impacts both yield and quality. Wheat took the crown for the highest nitrogen application rate at 492.06 kg/ha, followed by rice at 328.04 kg/ha.
- In Vietnam's Vinh Phuc province, significant portions of soil suffer from degradation, characterized by low organic matter, total available nitrogen below 0.08%, total phosphorus below 0.04%, and total potassium below 1.0%. Additionally, available phosphorus falls below 10 ppm. These deficiencies have contributed to a surge in fertilizer consumption in Vietnam, rising from 49.2 kg/ha in 1969 to 415.3 kg/ha by 2018, marking an average annual growth rate of 6.71%.
- Despite 43% of Vietnam's population being involved in agriculture, the sector's contribution to the country's GDP remains modest, accounting for only about 12.36%. However, as the nation strives for agricultural stability, the demand for fertilizers continues to rise, propelling the growth of Vietnam's fertilizers market during 2023-2030.
Vietnam Specialty Fertilizer Industry Overview
The Vietnam Specialty Fertilizer Market is moderately consolidated, with the top five companies occupying 60.32%. The major players in this market are Baconco, Grupa Azoty S.A. (Compo Expert), Hebei Sanyuanjiuqi Fertilizer Co., Ltd., ICL Group Ltd and Yara International ASA (sorted alphabetically).
Additional Benefits:
- The market estimate (ME) sheet in Excel format
- 3 months of analyst support
TABLE OF CONTENTS
1 EXECUTIVE SUMMARY & KEY FINDINGS
2 REPORT OFFERS
3 INTRODUCTION
- 3.1 Study Assumptions & Market Definition
- 3.2 Scope of the Study
- 3.3 Research Methodology
4 KEY INDUSTRY TRENDS
- 4.1 Acreage Of Major Crop Types
- 4.1.1 Field Crops
- 4.1.2 Horticultural Crops
- 4.2 Average Nutrient Application Rates
- 4.2.1 Micronutrients
- 4.2.1.1 Field Crops
- 4.2.1.2 Horticultural Crops
- 4.2.2 Primary Nutrients
- 4.2.2.1 Field Crops
- 4.2.2.2 Horticultural Crops
- 4.2.3 Secondary Macronutrients
- 4.2.3.1 Field Crops
- 4.2.3.2 Horticultural Crops
- 4.2.1 Micronutrients
- 4.3 Agricultural Land Equipped For Irrigation
- 4.4 Regulatory Framework
- 4.5 Value Chain & Distribution Channel Analysis
5 MARKET SEGMENTATION (includes market size in Value in USD and Volume, Forecasts up to 2030 and analysis of growth prospects)
- 5.1 Speciality Type
- 5.1.1 CRF
- 5.1.1.1 Polymer Coated
- 5.1.1.2 Polymer-Sulfur Coated
- 5.1.1.3 Others
- 5.1.2 Liquid Fertilizer
- 5.1.3 SRF
- 5.1.4 Water Soluble
- 5.1.1 CRF
- 5.2 Application Mode
- 5.2.1 Fertigation
- 5.2.2 Foliar
- 5.2.3 Soil
- 5.3 Crop Type
- 5.3.1 Field Crops
- 5.3.2 Horticultural Crops
- 5.3.3 Turf & Ornamental
6 COMPETITIVE LANDSCAPE
- 6.1 Key Strategic Moves
- 6.2 Market Share Analysis
- 6.3 Company Landscape
- 6.4 Company Profiles
- 6.4.1 Baconco
- 6.4.2 Grupa Azoty S.A. (Compo Expert)
- 6.4.3 Haifa Group
- 6.4.4 Hebei Sanyuanjiuqi Fertilizer Co., Ltd.
- 6.4.5 ICL Group Ltd
- 6.4.6 Yara International ASA
7 KEY STRATEGIC QUESTIONS FOR FERTILIZER CEOS
8 APPENDIX
- 8.1 Global Overview
- 8.1.1 Overview
- 8.1.2 Porter's Five Forces Framework
- 8.1.3 Global Value Chain Analysis
- 8.1.4 Market Dynamics (DROs)
- 8.2 Sources & References
- 8.3 List of Tables & Figures
- 8.4 Primary Insights
- 8.5 Data Pack
- 8.6 Glossary of Terms
