
|
시장보고서
상품코드
1693537
남미의 특수 비료 시장 : 점유율 분석, 산업 동향 및 통계, 성장 예측(2025-2030년)South America Specialty Fertilizer - Market Share Analysis, Industry Trends & Statistics, Growth Forecasts (2025 - 2030) |
||||||
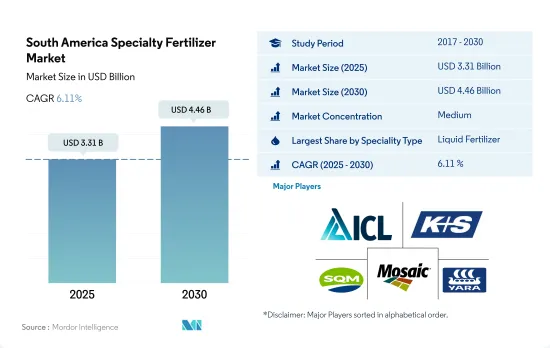
남미의 특수 비료 시장 규모는 2025년 33억 1,000만 달러로 추정되고, 2030년에는 44억 6,000만 달러에 이르고, 예측기간 중(2025-2030년) CAGR 6.11%로 성장할 것으로 예측됩니다.

수용성 비료는 다양한 농업 시스템에 적합하기 때문에 시장을 독점
- 2022년 남미의 특수 비료 시장에서는 수용성 비료가 42.3%의 압도적 점유율을 차지했습니다.
- 2022년 남미의 특수 비료 시장에서는 액체 비료가 51.6%의 점유율을 차지했습니다. 이러한 비료는 토양에 침투하기 쉽고, 식물에 의한 양분의 흡수가 빠를 뿐만 아니라, 낭비를 최소한으로 억제할 수 있습니다.
- 2022년 남미의 방출 제어형 비료 시장 점유율은 2.8%로 소폭이었습니다. 이 시장은 혁신적이고 환경친화적인 방출제어형 비료의 개발에 대한 관심이 높아지고 있습니다.
- 시간이 지남에 서서히 영양소를 방출하는 완효성 비료는 남미의 특수 비료 시장의 2.4%에 그쳤습니다. 특수 비료 시장 잠재력이 확대되고 있기 때문에 완효성 부문은 2023-2030년간 크게 성장할 전망입니다.
브라질은 면적이 넓고 농업의 잠재력이 크기 때문에 시장을 독점하고 있습니다.
- 2022년에는 세계 농업 부문의 중요한 국가인 브라질은 쌀, 옥수수, 콩, 커피 등 상품의 주요 수출국으로 서 있었습니다.
- 아르헨티나는 농업 부문에 크게 의존하고 있으며, 밀, 옥수수, 대두가 주요 작물입니다.
- 이 지역의 특수 비료 소비량은 2017년 이후 증가 경향에 있으며, 28만 9,600톤에서 2022년에는 43만 200톤으로 급증했습니다. 따라서 무역과 공급망이 혼란한 2019년까지 일관된 성장을 보였습니다.
- 칠레, 콜롬비아, 페루, 볼리비아, 파라과이를 포함한 나머지 남미 국가들은 2022년에는 합계로 이 지역의 특수 비료 소비량의 25.9%를 차지했습니다.
- 경작 면적이 확대되어 가뭄이나 열파와 같은 기후 리스크가 높아지고 있기 때문에 남미의 특수 비료 시장은 성장의 태세를 정돈하고 있습니다. 이러한 과제가, 보다 효율적인 비료의 채용을 뒷받침하고 있습니다.
남미의 특수 비료 시장 동향
작물 생산의 자급자족을 목표로 하는 브라질 정부의 대처
- 남미에서 농작물의 재배면적은 12.8% 증가했으며, 2017년 1억 1,160만ha에서 2022년에는 1억 2,610만ha로 증가했습니다. 이 제배 면적 급증은 이 지역의 비료 수요를 밀어 올릴 것으로 예측됩니다.
- 남미에서는 브라질과 아르헨티나가 재배 면적의 64.4%, 26.1%를 차지하고, 대두 재배의 톱에 군림하고 있습니다. 하지만 이 지역에는 장기적인 가뭄에 고통받고 있으며, 그 결과 주요 하천의 수위가 매우 저하되어 있습니다. 이것은 심각한 영향을 미치고, 수확과 중요한 여름 작물, 특히 대두의 수송의 양쪽 모두에 지장을 초래하고 있습니다.
- 메르코스르 지역에서는 최근 왕성한 세계 수요와 매력적인 수익성을 배경으로 대두 재배가 급증하고 있습니다.
남미 지역에서 농작물의 1차 양분 시용량의 평균은 약 172.73kg/헥타르입니다.
- 남미는 대두, 옥수수, 밀, 메이즈 등의 밭작물의 주요 생산국입니다. 지난 20년간, 경작지 증가와 고수량을 달성하기 위한 노력에 의해 이러한 작물의 생산량은 대폭 증가했습니다. 브라질과 같은 국가의 생산자가 경작지를 계속 확대하고 있기 때문에 작물 생산은 더욱 증가할 것으로 예상되며 나아가 비료 소비량 증가로 이어질 가능성이 있습니다.
- 영양소는 식물의 건강, 성장, 농작물의 생산량에 중요한 역할을 합니다. 남미에서 밭 작물의 1차 양분의 평균 시용량은 2022년에는 약 172.7kg/헥타르였습니다.
- 모든 농작물 중에서 밀, 쌀, 옥수수의 평균 양분 시용률이 가장 높을 것으로 예측되고 있습니다. 남미에서는 인구 증가에 의해 밭작물 수요가 증가하고 있어 주요한 식용 작물의 수확 면적이 증가하고 있습니다.
남미의 특수 비료 산업의 개요
남미의 특수 비료 시장은 적당히 통합되어 있으며 상위 5개사에서 58.59%를 차지하고 있습니다. 이 시장 주요 기업은 ICL Group Ltd, K+S Aktiengesellschaft, Sociedad Quimica y Minera de Chile SA, The Mosaic Company, Yara International ASA(알파벳순) 입니다.
기타 혜택
- 엑셀 형식 시장 예측(ME) 시트
- 3개월의 애널리스트 서포트
목차
제1장 주요 요약과 주요 조사 결과
제2장 보고서 제안
제3장 소개
- 조사의 전제조건과 시장 정의
- 조사 범위
- 조사 방법
제4장 주요 산업 동향
- 주요 작물의 작부 면적
- 밭 작물
- 원예 작물
- 평균 양분 시용률
- 미량 영양소
- 밭 작물
- 원예 작물
- 1차 영양소
- 밭 작물
- 원예 작물
- 2차 다량 영양소
- 밭 작물
- 원예 작물
- 미량 영양소
- 관개 농지
- 규제 프레임워크
- 밸류체인과 유통채널 분석
제5장 시장 세분화
- 스페셜리티 유형
- CRF
- 폴리머 코트
- 폴리머 유황 코팅
- 기타
- 액체 비료
- SRF
- 수용성
- CRF
- 시비 모드
- 시비
- 엽면 살포
- 토양
- 작물 유형
- 밭작물
- 원예작물
- 잔디 및 관상용
- 생산국
- 아르헨티나
- 브라질
- 기타 남미
제6장 경쟁 구도
- 주요 전략 동향
- 시장 점유율 분석
- 기업 상황
- 기업 프로파일
- EuroChem Group
- Grupa Azoty SA(Compo Expert)
- Haifa Group
- ICL Group Ltd
- KS Aktiengesellschaft
- Sociedad Quimica y Minera de Chile SA
- The Mosaic Company
- TIMAC Agro
- Yara International ASA
제7장 CEO에 대한 주요 전략적 질문
제8장 부록
- 세계 개요
- 개요
- Porter's Five Forces 분석 프레임워크
- 세계의 밸류체인 분석
- 시장 역학(DROs)
- 정보원과 참고문헌
- 도표 일람
- 주요 인사이트
- 데이터 팩
- 용어집
The South America Specialty Fertilizer Market size is estimated at 3.31 billion USD in 2025, and is expected to reach 4.46 billion USD by 2030, growing at a CAGR of 6.11% during the forecast period (2025-2030).
Water soluble fertilizers dominated the market due to their suitability for various agricultural systems
- In 2022, water-soluble fertilizers held a dominant share of 42.3% in South America's specialty fertilizer market. Water soluble fertilizers (WSF) simplify nutrition management because nutrient levels are not affected by leaching or erosion. Fertigation, a key component of modern agricultural systems like hydroponics and drip irrigation, is made user-friendly with water-soluble fertilizers.
- Liquid fertilizers took the lion's share of 51.6% in South America's specialty fertilizer market in 2022. Growers in the region are increasingly recognizing the benefits of liquid fertilizers. These fertilizers not only penetrate the soil easily, enabling faster nutrient absorption by plants, but also minimize waste. They can be applied to both the ground and foliage, presenting a significant growth opportunity in South America.
- The controlled-release fertilizer market in South America held a modest share of 2.8% in 2022. Among controlled-release fertilizers, polymer-coated variants dominated, commanding a 76.3% share. This market is being propelled by a rising interest in developing innovative and environmentally friendly controlled-release fertilizers. Projections indicate a 6.7% CAGR for the controlled-release fertilizer market in the coming years.
- Slow-release fertilizers, which gradually release nutrients over time, accounted for a modest 2.4% of South America's specialty fertilizer market. These fertilizers, influenced by water, heat, sunlight, and soil microbes, gradually break down and decompose, enriching the soil. Given the expanding market potential for specialty fertilizers, the slow-release segment is poised for significant growth from 2023 to 2030.
Brazil dominated the market owing to the larger area and greater agricultural potential.
- In 2022, Brazil, a significant player in the global agricultural sector, stood as a key exporter of commodities such as rice, maize, soybean, and coffee. The specialty fertilizer market in Brazil was valued at USD 1.8 billion, and it witnessed a consumption of 2.0 million metric ton in the same year.
- Argentina heavily relies on its agricultural sector, with wheat, corn, and soybean being prominent crops. The country's fertilizer consumption is notable, with an average application rate of 259.4 kg/ha. In 2022, Argentina accounted for 14.1% of the region's specialty fertilizer consumption.
- Specialty fertilizer consumption in the region has been on the rise since 2017, surging from 289.6 thousand metric ton to 430.2 thousand metric ton in 2022. The market value showed consistent growth until 2019 when the COVID-19 pandemic disrupted trade and supply chains. Given the region's reliance on fertilizer imports, prices saw an upward trend during the period.
- The remaining South American countries, including Chile, Colombia, Peru, Bolivia, and Paraguay, collectively represented 25.9% of the region's specialty fertilizer consumption in 2022. These countries boast a diverse agricultural landscape, spanning from cereals to fruits and vegetables, with agriculture serving as a primary income source for their populations.
- With an expanding cultivation area and escalating climate risks like droughts and heatwaves, the South American specialty fertilizer market is poised for growth. These challenges are driving the adoption of more efficient fertilizers.
South America Specialty Fertilizer Market Trends
The Brazilian government's initiatives to achieve self-sufficiency in crop production
- The cultivation area for field crops in South America witnessed a 12.8% increase, rising from 111.6 million ha in 2017 to 126.1 million ha in 2022. This surge in cultivation area is projected to drive up the demand for fertilizers in the region. Field crops dominated the landscape, occupying a significant 96.8% share. In 2022, Brazil held the lion's share of the market at 56.9%, with Argentina trailing at 29.3%. Brazil, renowned as the global leader in soy production and exports, saw its soy output reach nearly 135 million tonnes in 2021. Out of this, a substantial 105.5 million tonnes of soy products were exported, with 82% in raw soybean form, 16% as soybean cake, and 2% as soybean oil.
- Soybean cultivation reigns supreme in South America, with Brazil and Argentina leading the pack, accounting for 64.4% and 26.1% of the cultivated area, respectively. However, the region is grappling with an extended drought, resulting in alarmingly low water levels in major rivers. This has severe repercussions, hampering both harvests and the transportation of crucial summer crops, especially soybeans. Consequently, the prevailing conditions are amplifying the demand for increased fertilizer application in South America.
- The Mercosur region has witnessed a surge in soybean cultivation, driven by robust global demand and the crop's attractive profitability in recent years. The surge in commodity prices, including soy, has incentivized producers to expand their operations, investing in new lands and equipment to enhance scale and efficiency. As a result, the field crop cultivation area in the region is poised to expand in tandem with the growing domestic and international markets.
The average rate of primary nutrient application for field crops in the South American region is about 172.73 kg/hectare
- South America is a major producer of field crops such as soybeans, corn, wheat, and maize. Over the last two decades, the production of these crops has experienced a significant rise due to an increase in cultivated land and efforts to achieve higher yields. As growers in countries like Brazil continue to expand their cultivated areas, it is expected that crop production will further increase, which, in turn, may lead to a rise in fertilizer consumption.
- Nutrients play a crucial role in plant health, growth, and crop production output. Primary nutrients, in particular, are essential for field crops as they provide the basic building blocks for plant development. These nutrients include nitrogen, phosphorus, and potassium, and a deficiency in any of them can have a significant impact on crop yield and quality. The average rate of primary nutrient application for field crops in South America was about 172.7 kg/hectare in 2022. Among all the primary nutrients, nitrogen had the highest application rate of 193.8 kg/hectare, followed by potassium with 181.9 kg/hectare, while phosphorous had an application rate of 142.4 kg/hectare.
- Among all the field crops, wheat, rice, and corn/maize are predicted to have the highest average nutrient application rate. Specifically, wheat is projected to have an average nutrient application rate of 231 kg/ha, while rice and corn/maize are estimated to have average rates of 156 kg/ha and 149 kg/ha, respectively. In South America, the demand for field crops has been on the rise due to the growing population, leading to an increase in the area harvested under major food crops. As a result, the use of primary nutrients in field crops is expected to increase significantly in the coming years.
South America Specialty Fertilizer Industry Overview
The South America Specialty Fertilizer Market is moderately consolidated, with the top five companies occupying 58.59%. The major players in this market are ICL Group Ltd, K+S Aktiengesellschaft, Sociedad Quimica y Minera de Chile SA, The Mosaic Company and Yara International ASA (sorted alphabetically).
Additional Benefits:
- The market estimate (ME) sheet in Excel format
- 3 months of analyst support
TABLE OF CONTENTS
1 EXECUTIVE SUMMARY & KEY FINDINGS
2 REPORT OFFERS
3 INTRODUCTION
- 3.1 Study Assumptions & Market Definition
- 3.2 Scope of the Study
- 3.3 Research Methodology
4 KEY INDUSTRY TRENDS
- 4.1 Acreage Of Major Crop Types
- 4.1.1 Field Crops
- 4.1.2 Horticultural Crops
- 4.2 Average Nutrient Application Rates
- 4.2.1 Micronutrients
- 4.2.1.1 Field Crops
- 4.2.1.2 Horticultural Crops
- 4.2.2 Primary Nutrients
- 4.2.2.1 Field Crops
- 4.2.2.2 Horticultural Crops
- 4.2.3 Secondary Macronutrients
- 4.2.3.1 Field Crops
- 4.2.3.2 Horticultural Crops
- 4.2.1 Micronutrients
- 4.3 Agricultural Land Equipped For Irrigation
- 4.4 Regulatory Framework
- 4.5 Value Chain & Distribution Channel Analysis
5 MARKET SEGMENTATION (includes market size in Value in USD and Volume, Forecasts up to 2030 and analysis of growth prospects)
- 5.1 Speciality Type
- 5.1.1 CRF
- 5.1.1.1 Polymer Coated
- 5.1.1.2 Polymer-Sulfur Coated
- 5.1.1.3 Others
- 5.1.2 Liquid Fertilizer
- 5.1.3 SRF
- 5.1.4 Water Soluble
- 5.1.1 CRF
- 5.2 Application Mode
- 5.2.1 Fertigation
- 5.2.2 Foliar
- 5.2.3 Soil
- 5.3 Crop Type
- 5.3.1 Field Crops
- 5.3.2 Horticultural Crops
- 5.3.3 Turf & Ornamental
- 5.4 Country
- 5.4.1 Argentina
- 5.4.2 Brazil
- 5.4.3 Rest of South America
6 COMPETITIVE LANDSCAPE
- 6.1 Key Strategic Moves
- 6.2 Market Share Analysis
- 6.3 Company Landscape
- 6.4 Company Profiles
- 6.4.1 EuroChem Group
- 6.4.2 Grupa Azoty S.A. (Compo Expert)
- 6.4.3 Haifa Group
- 6.4.4 ICL Group Ltd
- 6.4.5 K+S Aktiengesellschaft
- 6.4.6 Sociedad Quimica y Minera de Chile SA
- 6.4.7 The Mosaic Company
- 6.4.8 TIMAC Agro
- 6.4.9 Yara International ASA
7 KEY STRATEGIC QUESTIONS FOR FERTILIZER CEOS
8 APPENDIX
- 8.1 Global Overview
- 8.1.1 Overview
- 8.1.2 Porter's Five Forces Framework
- 8.1.3 Global Value Chain Analysis
- 8.1.4 Market Dynamics (DROs)
- 8.2 Sources & References
- 8.3 List of Tables & Figures
- 8.4 Primary Insights
- 8.5 Data Pack
- 8.6 Glossary of Terms
