


|
시장보고서
상품코드
1693515
인도의 요소 시장 : 시장 점유율 분석, 산업 동향 및 통계, 성장 예측(2025-2030년)India Urea - Market Share Analysis, Industry Trends & Statistics, Growth Forecasts (2025 - 2030) |
||||||
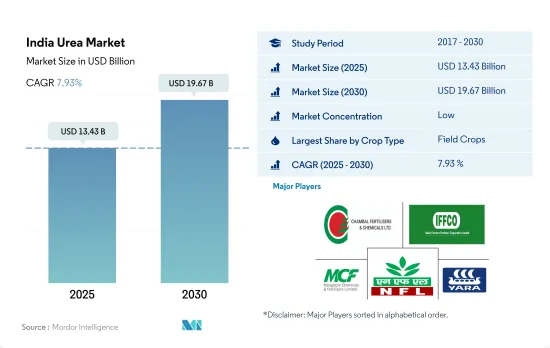
인도의 요소 시장 규모는 2025년에 134억 3,000만 달러로 추정되고, 2030년에는 196억 7,000만 달러에 이를 것으로 예측되며, 예측 기간(2025-2030년) 중 CAGR 7.93%로 성장할 전망입니다.
모든 작물 종에서 요소 소비량이 증가하고 고효율 비료에 대한 수요가 높아지고 있다는 것이 요소 비료 시장을 밀어올릴 것으로 예상됩니다.
- 인도에서는 농작물만이 요소 비료 시장 전체의 약 89.3%의 금액 점유율을 차지하고, 저비용으로 국내에서 널리 이용 가능하기 때문에 2022년에는 기존의 요소 비료의 약 89.7%가 소비되었습니다. 그러나 농작물에서는 그 높은 효율로부터 특수 요소 비료를 채용하는 경향이 강해지고 있습니다. 따라서 그 시장 가치는 2023-2030년 CAGR 7.8%를 기록할 것으로 예측되고 있습니다.
- 원예 작물은 요소 비료 시장 전체의 약 10.2%를 차지하고, 2022년 시장 규모는 12억 달러였습니다. 인도는 세계 2위의 과일 및 채소 생산국으로 바나나, 망고, 레몬, 파파야, 오크라가 1위입니다. 과일 및 채소에 대한 수요의 고조와 재배 면적 확대가 맞물려 시장의 성장을 견인할 것으로 예상되고 있습니다.
- 지난 수십년간 질소 시용량 증가와 질소 이용 효율의 저하가 보입니다. 인도에서는 2050년까지 비료 소비량이 배증할 것으로 추정되고 있어 비료의 이용 효율을 높이는 것이 급선무가 되고 있습니다. 방출 조절 비료는 특히 원예 작물에서 비료 사용 효율을 개선하고 비료 오염을 감소시킬 수 있습니다. 이러한 요인 때문에, 향후 수년간 모든 작물 분야에서 방출 조절 비료의 성장이 촉진될 것으로 예상됩니다.
- 화훼 재배는 최근 성장하고 있는 산업의 하나입니다. 예를 들면, 2020-2021년 이 나라는 1만 5,600톤, 총액 780만 달러의 화훼 제품을 수출했습니다. 국내외 화훼 수요 증가로 잔디 및 관상용 작물의 시장 가치는 2023-2030년 CAGR 7.1%로 증가할 것으로 예상됩니다.
인도의 요소 시장 동향
망간 결핍은 유럽 국가에서 흔히 발견되는 문제로 pH가 6 이상인 모래 토양과 유기질 토양에서 가장 자주 발생합니다.
- 이 나라에서의 농작물의 재배 면적은 2017-2022년 사이에 3.5% 증가했습니다. 국내외 소비자 수요의 증가에 의한 이 나라의 곡물, 콩류, 지방종자의 재배 확대가, 재배 면적 증가의 주된 원동력이 되고 있습니다.
- 작물 유형별로는 쌀, 밀, 대두의 재배 면적이 가장 크고, 2022년에는 4,700만ha, 3,110만ha, 1,230만ha를 차지했습니다. 쌀은 인도에서 가장 중요한 식용 작물이며, 작부 면적의 약 4분의 1을 차지해 인도 인구의 약 절반에 식량을 공급하고 있습니다. 서벵골주, 우타르프라데시주, 안도라프라데시주, 펀자브주, 타밀나두주를 중심으로 거의 전 국토에서 재배되고 있습니다.
- 이에 따라 이 나라의 쌀 소비량은 2016년의 9,580만 톤에서 2022년에는 1억 700만 톤으로 증가했으며, 이 나라에서의 작물에 대한 수요 증가를 보여주었습니다. 이 동향은 2023-2030년 비료 수요를 더욱 끌어올릴 것으로 예상됩니다. 마찬가지로 국내 밀 재배는 2017년 9,850만 톤에서 2020년 1억 760만 톤으로 증가했습니다. 펀자브 주, 서벵골 주, 하리아나 주, 라자스탄 주에서 주로 재배되고 있습니다. 밀은 인도에서 두 번째로 중요한 곡물 작물이며, 이 나라의 식량 및 영양 안전 보장에 있어서 중요한 역할을 하고 있습니다. 그 때문에, 이 나라에서는 곡물의 재배가 번성하고 있으며, 국내외 수요의 고조와 맞물려 2023-2030년 인도의 비료 시장을 견인할 것으로 예상되고 있습니다.
1차 영양소 중에서 질소는 농작물에서 가장 많이 적용되는 영양소입니다.
- 2022년의 1차 영양소의 평균 시용량은 125.1kg/ha였습니다. 특기할 만한 것은 질소로 평균 시용량은 223.5kg/ha로 1위를 차지했습니다. 1차 양분으로서의 중요성을 생각하면, 질소는 국내에서 널리 재배되고 있는 쌀과 같은 고수량 작물을 지탱하는데 있어서 매우 중요한 역할을 하고 있습니다. 그러나 양분, 특히 질소의 결핍이 전국 벼의 생산성을 방해하고 있습니다. 바이오비료와 유기비료 현황 보고서에서 강조된 것처럼 인도 토양의 건전성은 우려 요인입니다. 이에 따르면 화학 비료에 대한 의존도가 높아지고 있으며 검사한 토양의 97.0%, 83.0%, 71.0%가 각각 질소, 인, 칼륨의 부족을 나타내고 있습니다.
- 주요 작물에서는 밀, 쌀, 옥수수가 2022년의 양분 시용량의 1위로, 각각 평균 231kg/ha, 156kg/ha, 149kg/ha였습니다. 밀과 쌀은 국내에서도 세계적으로 주식이지만 여러 양분 부족으로 인한 과제에 직면해 있습니다. 질소, 인, 칼륨 외에 이 작물들은 최적의 생육을 위해 황, 붕소, 철, 아연 등의 미량영양소도 필요로 합니다. 효과적인 양분 관리는 작물 생산을 높이기 위해 매우 중요하며, 그에 따라 시장 성장에 박차를 가하고 있습니다.
- 농작물, 특히 곡물 및 곡류는 1 차 영양소, 특히 질소 비료를 탐욕스럽게 필요로 합니다. 인도에서는 이러한 작물이 널리 재배되고 있기 때문에 토양의 양분은 급속히 고갈되고 있습니다. 그 결과 농가들은 그 격차를 메우기 위해 점점 더 비료에 의존하게 되고 있으며, 이 동향이 2023-2030년 시장을 견인할 것으로 예측되고 있습니다.
인도의 요소 산업 개요
인도의 요소 시장은 세분화되어 있으며 주요 5개사에서 12.09%를 차지하고 있습니다. 이 시장 주요 기업은 다음과 같습니다. Chambal Fertilizers & Chemicals Ltd, Indian Farmers Fertiliser Cooperative Limited, Mangalore Chemicals & Fertilizers Ltd., National Fertilizers Ltd and Yara International ASA.(알파벳순 정렬)
기타 혜택
- 엑셀 형식 시장 예측(ME) 시트
- 3개월의 애널리스트 서포트
목차
제1장 주요 요약 및 주요 조사 결과
제2장 보고서 제안
제3장 서문
- 조사의 전제조건 및 시장 정의
- 조사 범위
- 조사 방법
제4장 주요 산업 동향
- 주요 작물의 작부 면적
- 농작물
- 원예작물
- 평균 양분 시용률
- 주요 양분
- 농작물
- 원예작물
- 주요 양분
- 관개 설비가 있는 농지
- 규제 프레임워크
- 밸류체인 및 유통 채널 분석
제5장 시장 세분화
- 스페셜리티 유형별
- CRF
- 폴리머 코트
- 폴리머 유황 코팅
- 기타
- 액체 비료
- SRF
- 수용성
- CRF
- 작물 유형별
- 농작물
- 원예작물
- 잔디 및 관상용
- 형태별
- 종래
- 특수작물
제6장 경쟁 구도
- 주요 전략적 움직임
- 시장 점유율 분석
- 기업 상황
- 기업 프로파일
- Chambal Fertilizers & Chemicals Ltd
- Coromandel International Ltd.
- Gujarat Narmada Valley Fertilizers & Chemicals Ltd
- Indian Farmers Fertiliser Cooperative Limited
- Mangalore Chemicals & Fertilizers Ltd.
- National Fertilizers Ltd
- Yara International ASA
- Zuari Agro Chemicals Ltd
제7장 CEO에 대한 주요 전략적 질문
제8장 부록
- 세계 개요
- 개요
- Porter's Five Forces 분석 프레임워크
- 세계의 밸류체인 분석
- 시장 역학(DROs)
- 정보원 및 참고문헌
- 도표 일람
- 주요 인사이트
- 데이터 팩
- 용어집
The India Urea Market size is estimated at 13.43 billion USD in 2025, and is expected to reach 19.67 billion USD by 2030, growing at a CAGR of 7.93% during the forecast period (2025-2030).

The rising consumption of urea in all crop types and increasing demand for highly efficient fertilizers are expected to boost the urea fertilizer market
- In India, field crops alone account for about 89.3% value share of the total urea fertilizer market and consumed about 89.7% of conventional urea fertilizers in 2022 due to their low cost and widespread availability in the country. However, in field crops, there is an increasing trend in adopting specialty urea fertilizers due to their efficiency. Due to this, its market value is projected to register a CAGR of 7.8% between 2023 and 2030.
- Horticulture crops account for about 10.2% of the total urea fertilizer market, which was valued at USD 1.2 billion in 2022. India is the world's second-largest producer of fruits and vegetables, and the country ranks first in banana, mango, lemon, papaya, and okra. The rising demand for fruits and vegetables, coupled with the expansion of cultivation area, is anticipated to drive the growth of the market.
- Since the last few decades, there has been an increase in nitrogen application rates and a decrease in nitrogen use efficiency. It is estimated that fertilizer consumption in India may double by 2050, and there is an urgent need to improve the country's fertilizer use efficiency. The controlled-release fertilizers can improve fertilizer use efficiency and decrease fertilizer pollution, particularly in horticultural crops. These factors are anticipated to fuel the growth of control-release fertilizers in all crop segments in the coming years.
- The floriculture has been one of the growing industries in recent years. For instance, in 2020-21, the country exported 15.6 thousand metric tons of floriculture products for a total value of USD 7.8 million. The rising domestic and international demand for flowers is expected to increase the market value of turf and ornamental crops at 7.1% CAGR from 2023 to 2030.
India Urea Market Trends
Manganese deficiency is a common problem in European countries, which most frequently affects sandy and organic soils with a pH above 6
- The area under field crop cultivation in the country increased by 3.5% during 2017-2022. The increased cultivation of cereals, pulses, and oilseeds in the country due to the rising consumer demand domestically and internationally is the major driving factor for the rising acreage.
- By crop type, rice, wheat, and soybean occupied the largest area under cultivation in the country, accounting for 47 million ha, 31.1 million ha, and 12.3 million ha in 2022. Rice is the most important food crop of India, covering about one-fourth of the total cropped area and providing food to about half of the Indian population. It is cultivated in almost all the states of the country, mainly in West Bengal, Uttar Pradesh, Andhra Pradesh, Punjab, and Tamil Nadu.
- Accordingly, rice consumption in the country increased from 95.8 million tons in 2016 to 107 million tons in 2022, which shows the rising demand for the crop in the country. This trend is further anticipated to drive the demand for fertilizers during 2023-2030. Similarly, wheat cultivation in the country increased from 98.5 million tons in 2017 to 107.6 million tons in 2020. It is cultivated majorly in Punjab, West Bengal, Haryana, and Rajasthan. Wheat is the second most important cereal crop in India and plays a vital role in the food and nutritional security of the country. Therefore, the intense cereal cultivation in the country, coupled with rising domestic and international demand, is anticipated to drive the Indian fertilizer market during 2023-2030.
Among the primary nutrients, nitrogen is the most-applied nutrient in field crops.
- In 2022, the average application rate for primary nutrients stood at 125.1 kg/ha. Notably, nitrogen topped the list with an average application rate of 223.5 kg/ha. Given its significance as a primary nutrient, nitrogen plays a pivotal role in supporting high-yield crops like rice, which is extensively cultivated in the country. However, nutrient deficiencies, particularly in nitrogen, are hampering rice productivity nationwide. The soil health in India, as highlighted in the State of Biofertilizers and Organic Fertilizers report, is a cause for concern. It reveals a rising reliance on chemical fertilizers, with 97.0%, 83.0%, and 71.0% of tested soils showing deficiencies in nitrogen, phosphorous, and potassium, respectively.
- Among the major crops, wheat, rice, and corn/maize led the pack in nutrient application rates in 2022, averaging 231, 156, and 149 kg/ha, respectively. Wheat and rice, being staple foods both domestically and globally, face challenges due to multiple nutrient deficiencies. Apart from nitrogen, phosphorous, and potassium, these crops also require micronutrients like sulfur, boron, iron, and zinc for optimal growth. Effective nutrient management is crucial for boosting crop production, thereby fueling market growth.
- Field crops, especially grains and cereals, have a voracious appetite for primary nutrients, particularly nitrogen fertilizers. Given the extensive cultivation of these crops in India, the soil's nutrient content is rapidly depleting. Consequently, farmers are increasingly relying on fertilizers to bridge the gap, a trend projected to drive the market from 2023 to 2030.
India Urea Industry Overview
The India Urea Market is fragmented, with the top five companies occupying 12.09%. The major players in this market are Chambal Fertilizers & Chemicals Ltd, Indian Farmers Fertiliser Cooperative Limited, Mangalore Chemicals & Fertilizers Ltd., National Fertilizers Ltd and Yara International ASA (sorted alphabetically).
Additional Benefits:
- The market estimate (ME) sheet in Excel format
- 3 months of analyst support
TABLE OF CONTENTS
1 EXECUTIVE SUMMARY & KEY FINDINGS
2 REPORT OFFERS
3 INTRODUCTION
- 3.1 Study Assumptions & Market Definition
- 3.2 Scope of the Study
- 3.3 Research Methodology
4 KEY INDUSTRY TRENDS
- 4.1 Acreage Of Major Crop Types
- 4.1.1 Field Crops
- 4.1.2 Horticultural Crops
- 4.2 Average Nutrient Application Rates
- 4.2.1 Primary Nutrients
- 4.2.1.1 Field Crops
- 4.2.1.2 Horticultural Crops
- 4.2.1 Primary Nutrients
- 4.3 Agricultural Land Equipped For Irrigation
- 4.4 Regulatory Framework
- 4.5 Value Chain & Distribution Channel Analysis
5 MARKET SEGMENTATION (includes market size in Value in USD and Volume, Forecasts up to 2030 and analysis of growth prospects)
- 5.1 Speciality Type
- 5.1.1 CRF
- 5.1.1.1 Polymer Coated
- 5.1.1.2 Polymer-Sulfur Coated
- 5.1.1.3 Others
- 5.1.2 Liquid Fertilizer
- 5.1.3 SRF
- 5.1.4 Water Soluble
- 5.1.1 CRF
- 5.2 Crop Type
- 5.2.1 Field Crops
- 5.2.2 Horticultural Crops
- 5.2.3 Turf & Ornamental
- 5.3 Form
- 5.3.1 Conventional
- 5.3.2 Speciality
6 COMPETITIVE LANDSCAPE
- 6.1 Key Strategic Moves
- 6.2 Market Share Analysis
- 6.3 Company Landscape
- 6.4 Company Profiles
- 6.4.1 Chambal Fertilizers & Chemicals Ltd
- 6.4.2 Coromandel International Ltd.
- 6.4.3 Gujarat Narmada Valley Fertilizers & Chemicals Ltd
- 6.4.4 Indian Farmers Fertiliser Cooperative Limited
- 6.4.5 Mangalore Chemicals & Fertilizers Ltd.
- 6.4.6 National Fertilizers Ltd
- 6.4.7 Yara International ASA
- 6.4.8 Zuari Agro Chemicals Ltd
7 KEY STRATEGIC QUESTIONS FOR FERTILIZER CEOS
8 APPENDIX
- 8.1 Global Overview
- 8.1.1 Overview
- 8.1.2 Porter's Five Forces Framework
- 8.1.3 Global Value Chain Analysis
- 8.1.4 Market Dynamics (DROs)
- 8.2 Sources & References
- 8.3 List of Tables & Figures
- 8.4 Primary Insights
- 8.5 Data Pack
- 8.6 Glossary of Terms
