|
시장보고서
상품코드
1911711
요소 시장 : 시장 점유율 분석, 산업 동향 및 통계, 성장 예측(2026-2031년)Urea - Market Share Analysis, Industry Trends & Statistics, Growth Forecasts (2026 - 2031) |
||||||
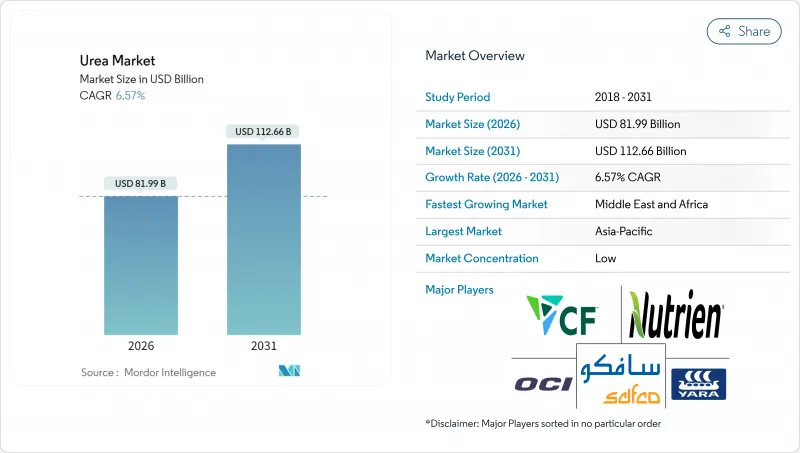
요소 시장은 2025년에 769억 5,000만 달러로 평가되었고, 2026년 819억 9,000만 달러로 성장할 전망이며, 2031년까지 1,126억 6,000만 달러에 이를 것으로 예측됩니다.
예측 기간(2026-2031년) CAGR은 6.57%로 성장이 전망됩니다.

곡물 제작 면적의 급속한 확대 및 최초의 상업 규모 그린 수소 프로젝트가 생산 경제성을 재구축하면서 수요는 상승 경향을 유지하고 있습니다. 장기 천연가스 계약을 맺은 생산자는 가격 상승 시 이익률을 보호할 수 있지만, 분산형 항만 플랜트와 신재생 에너지 이용 암모니아 제조 설비가 지역별 비용 곡선 재구축을 시작하고 있습니다. 병행하여 정부의 유출 규제 강화로 평균 판매 가격이 높은 코팅 및 안정화 제품에 대한 수요가 유도되고 있습니다. 이러한 시너지 효과는 원료 조달의 전략적 헤지, 물류 자산과의 깊은 통합, 고효율 비료 배합의 연구개발 가속을 촉진하고 있습니다.
세계의 요소 시장 동향 및 전망
세계 곡물 경작 면적 확대
2030년까지 28%의 생산 증가를 목표로 하는 농가들의 질소 수요는 세계 곡물 경작 면적이 확대됨에 따라 견조하게 증가하고 있습니다. 인도, 중국, 아프리카 일부 지역의 고수량 밀, 쌀 및 옥수수 프로그램에서는 GPS 유도 살포기에 대응한 입상 요소가 대량으로 소비되고 있습니다. 인도의 나노 요소 도입 사례는 시비량 최적화를 통해 영양 공급량을 줄이지 않고 환경부하를 줄일 수 있음을 보여줍니다. 사하라 이남 아프리카의 정부 투입 자재 보조금은 시비율을 더욱 밀어 올리는 것과 동시에 질소 방출을 지연시키는 피복 제품을 소규모 농가에게 보급하고 있습니다. 브라질의 '국가비료계획'은 대두 및 옥수수 제작 면적 확대를 지원하면서 수입 의존도를 억제하기 위한 국내 생산 능력을 뒷받침하고 있습니다. 유리한 상품 가격은 제작 면적 증가를 지속하고 요소 시장의 장기적인 소비 기반을 강화하고 있습니다.
비료에서 질소의 중요성
세계적으로, 옥수수, 나타, 면화, 설탕, 쌀, 밀, 콩 등의 작물은 필수 영양소의 주요 소비자입니다. 2024년, 이러한 주요 작물은 영양 요구량이 다르고, 주요 영양소의 평균 적용량은 120.97kg/ha에서 255.75kg/ha의 범위입니다. 이러한 영양소는 식물의 대사 과정과 세포, 막, 엽록소와 같은 필수 조직의 발달을 지원하는 데 매우 중요합니다. 질소는 여전히 가장 널리 적용되는 영양소이며 평균 적용량은 224.6kg/ha입니다. 특히 남미와 아시아태평양에서 밭작물의 재배 면적이 계속 확대되는 가운데 영양 부족에 직면하는 유럽과 북미 등 지역에서는 그 효율성으로 요소 특수 비료의 채용이 점점 진행되고 있습니다.
천연가스 가격 변동으로 생산 비용 상승
원료비는 공장 통과 요소 가격의 최대 80%를 차지합니다. 2022년 유럽의 지표 가스 가격이 MWh당 300유로(324달러)를 돌파했을 때, 복수의 플랜트는 적자 운영을 피해 조업 정지를 선택했습니다. 사우디아라비아의 SABIC 등 업스트림 부문을 통합한 생산자는 자사 가스 공급으로 수익성을 유지하고 있습니다. 다른 기업들은 헤지 프로그램을 도입하고 있지만, 스팟 가격의 급등이 헤지 범위를 넘어서면서도 자금 유출에 직면하고 있습니다. 이러한 변동성은 안정적인 가스 공급 지역으로의 전환을 가속화하고, 모듈식 플랜트를 위한 암모니아 수입의 채용을 촉진하며, 전력 요금이 감소함에 따라 재생 가능 수소에 대한 관심을 재연합니다.
부문 분석
수용성 요소 비료는 특수 요소 비료 시장에서 주요 부문으로서 대두해, 2025년에는 40.35% 시장 점유율을 차지할 전망입니다. 질소를 풍부하게 포함해 수용성이 뛰어난 요소는 식물 근부의 질소 흡수를 대폭 촉진하여 성장을 가속합니다. 이 부문의 이점은 주로 세계의 가뭄, 열파, 물 부족의 심각화와 같은 기후 변화의 영향으로 토양에서 질소 이용 가능성이 저하되었기 때문입니다. 농부들은 질소 유출과 휘발과 그에 따른 환경 오염과 지하수 오염의 위험을 줄이면서 안정적인 질소 공급을 보장하는 수용성 요소 비료를 점점 더 선호하고 있습니다. 제어 방출 요소는 2026년에서 2031년 사이의 예측 기간 동안 CAGR 7.28%로 가장 빠르게 성장하는 부문입니다. 이는 질소 손실을 줄이고 지속가능성 기준에 부합하기 위해 농부와 농업 관련 기업이 효율성 향상 자재의 도입을 확대하고 있기 때문입니다. 고분자 코팅 및 고분자 유황 코팅 제제는 영양소의 서방형을 높이고 침출과 휘발을 최소화하면서 적용 빈도를 줄여 노동 효율을 향상시킵니다. 이 성장은 영양 관리에 관한 규제 요건과 곡물, 지방종자, 특수 작물에서 방출 조절 비료의 사용 증가에 의해 더욱 촉진되고 있습니다. 생산성 향상과 환경 부하 저감을 목표로 하는 생산자 수요에 따라 서방형 요소 수요는 해마다 가속화되고 있습니다.
본 요소 시장 보고서에서는 업계를 이하의 부문으로 분류하고 있습니다. 특수 유형별(서방형 요소 비료, 액체 비료, 서방형 입상 요소, 수용성 요소), 작물 유형별(밭작물, 원예 작물, 잔디 및 관상 식물), 형태별(기존 및 특수형), 지역별(아시아태평양, 유럽, 중동 및 아프리카,) 시장 규모는 금액(달러)과 수량(메트릭톤)으로 제공됩니다.
지역별 분석
아시아태평양은 중국과 인도의 곡물 재배 집약을 배경으로 2025년 수익의 44.92%를 차지했습니다. 베트남, 인도네시아, 필리핀에서는 경작 면적의 확대 및 기계화 시비 설비의 도입이 진행되어, 새로운 성장을 지지하고 있습니다. 중국에서는 비료 삭감 의무화에 의해 나노요소나 피복 제품의 사용이 촉진되고, 총 영양소 톤수는 안정되어 있는 반면, 헥타르당 지출이 증가하고 있습니다. 인도에서는 보조금 개혁에 의해 균형 잡힌 영양 관리가 추진되어 범용 입상 비료보다 고부가가치의 배합 비료에 대한 수요가 높아지고 있습니다. 또한 ASEAN 수소 로드맵은 저탄소 암모니아 수입을 위한 준비를 진행하고 있으며, 미래의 녹색 요소 생산을 지원할 수 있습니다.
중동 및 아프리카는 예측 CAGR이 9.17%로 가장 급성장하고 있는 지역입니다. 이 성장은 사우디아라비아, 아랍에미리트(UAE), 나이지리아에서 생산 능력을 확대하여 수출 경쟁력을 높이는 저비용 가스에 의해 지원되고 있습니다. 또한 현지 농업 보조금 프로그램도 내륙부 수요를 끌어올리고 있습니다. 나이지리아 던고트 컴플렉스는 국내 시장과 서아프리카 시장 모두에 서비스를 제공하고 있으며, 해외에서 수입에 대한 의존도를 줄이고 있습니다. 걸프 협력 회의(GCC) 회원국은 그린 암모니아 생산을 위한 태양광 발전에 의한 전해 장치를 모색하고 있으며, 유럽과 아시아의 탄소 의식이 높은 구매자를 끌어들이는 입장을 확립하려고 합니다. 그러나 사하라 이남 아프리카의 일부 지역에서는 인프라의 격차와 정정 불안이 과제가 되고 있지만, 기증자가 지원하는 농업 보급 프로그램이 비료의 채용을 계속 지원하고 있습니다.
북미와 유럽은 성숙하지만 꾸준한 성장 궤도를 보여줍니다. 북미에서는 셰일 가스를 통해 비료 공장은 비용면에서 상위 25%의 생산자로 계속 라틴아메리카로의 수출 흐름을 유지하고 있습니다. 유럽에서는 영양소의 상한에 대한 보다 엄격한 농업 정책으로 입상 코팅 제품을 채택하고 있습니다. 독일과 벨기에의 수입 터미널은 조달 대상의 선택을 확대하고 있으며 가스 가격이 상승하는 기간에는 북아프리카와 중동에서 암모니아 수입이 현지 생산 감소를 보완하고 있습니다.
기타 혜택 :
- 엑셀 형식 시장 예측(ME) 시트
- 애널리스트에 의한 3개월간의 지원
자주 묻는 질문
목차
제1장 서론
- 조사의 전제조건 및 시장 정의
- 조사 범위
- 조사 방법
제2장 보고서 제공
제3장 주요 요약 주요 조사 결과
제4장 주요 산업 동향
- 주요 작물류의 작부 면적
- 밭작물
- 원예작물
- 평균 시비량
- 미량 영양소
- 밭작물
- 원예작물
- 미량 영양소
- 주요 영양소
- 밭작물
- 원예작물
- 관개 설비를 갖춘 농지
- 규제 프레임워크
- 밸류체인 및 유통 채널 분석
- 시장 성장 촉진요인
- 곡물 작물의 재배 확대
- 비료에 있어서 질소의 주요 영양소로서의 의존도
- 요소의 다른 질소 비료에 대한 비용 우위성
- 정밀 농업에 있어서 입상 요소의 선호성 고조
- 재생 가능 수소계 그린 요소의 생산 능력 증강
- 항만을 따라 모듈식 요소 플랜트에 의한 물류 비용 절감
- 시장 성장 억제요인
- 천연가스 가격 변동에 따른 생산비용 상승
- 질소 사용에 관한 유출 규제 및 온실 효과 가스 규제의 강화
- 질산암모늄 및 UAN에 의한 대체품의 위협
- 지정학적 무역 루트의 혼란
제5장 시장 규모 및 성장 예측(금액 및 수량)
- 전문 분야 유형별
- CRF
- 폴리머 코팅
- 폴리머 및 유황 코팅
- 기타
- 액체 비료
- SRF
- 수용성
- CRF
- 작물 유형별
- 밭작물
- 원예작물
- 잔디 및 관상용 식물
- 형상별
- 기존
- 특수
- 지역별
- 아시아태평양
- 호주
- 방글라데시
- 중국
- 인도
- 인도네시아
- 일본
- 파키스탄
- 필리핀
- 태국
- 베트남
- 기타 아시아태평양
- 유럽
- 프랑스
- 독일
- 이탈리아
- 네덜란드
- 러시아
- 스페인
- 우크라이나
- 영국
- 기타 유럽
- 중동 및 아프리카
- 나이지리아
- 사우디아라비아
- 남아프리카
- 튀르키예
- 기타 중동 및 아프리카
- 북미
- 캐나다
- 멕시코
- 미국
- 기타 북미
- 남미
- 아르헨티나
- 브라질
- 기타 남미
- 아시아태평양
제6장 경쟁 구도
- 주요 전략적 움직임
- 시장 점유율 분석
- 기업 개요
- 기업 프로파일
- CF Industries Holdings, Inc.
- Coromandel International Ltd.
- EuroChem Group
- Indian Farmers Fertiliser Cooperative Limited
- Koch Industries Inc.
- Nutrien Ltd.
- OCI NV
- SABIC Agri-Nutrients Co.
- Yara International ASA
- Qatar Fertiliser Company(QAFCO)
- PT Pupuk Kalimantan Timur
- Rashtriya Chemicals and Fertilizers Limited
- Acron Group(Acron PJSC)
- BASF SE
- URALCHEM Holding PLC
- The Mosaic Company
제7장 CEO에 대한 주요 전략적 질문
AJY 26.01.30The urea market was valued at USD 76.95 billion in 2025 and estimated to grow from USD 81.99 billion in 2026 to reach USD 112.66 billion by 2031, at a CAGR of 6.57% during the forecast period (2026-2031).
Rapid cereal acreage expansion and the first commercial green hydrogen projects are reshaping production economics while keeping demand on an upward trajectory. Producers with long-term natural gas contracts protect margins during price spikes, yet distributed port-side plants and renewable-powered ammonia units are beginning to reset regional cost curves. In parallel, governments tighten runoff rules, which steer demand toward coated and stabilized products that command higher average selling prices. These converging forces encourage strategic hedging in feedstock sourcing, deeper integration with logistics assets, and accelerated R&D in enhanced-efficiency fertilizer formulations.
Global Urea Market Trends and Insights
Intensifying Cereal Crop Cultivation Worldwide
Escalating global cereal acreage keeps nitrogen demand on a solid climb as farmers strive to meet a 28% production increase by 2030. High-yield wheat, rice, and maize programs in India, China, and parts of Africa absorb large volumes of granular urea that are compatible with GPS-guided spreaders. India's nano urea rollout shows how dosage optimization can reduce environmental load without cutting nutrient supply. Government input subsidies in Sub-Saharan Africa further lift application rates and introduce smallholder farmers to coated products that slow nitrogen release. Brazil's Plano Nacional de Fertilizantes backs domestic capacity to curb import reliance while supporting expanding soybean and corn acreages. Favorable commodity prices sustain acreage gains, strengthening long-run consumption fundamentals for the urea market.
Fertilizers reliance on nitrogen as a key nutrient
Globally, crops such as corn, rapeseed, cotton, sorghum, rice, wheat, and soybeans are major consumers of essential nutrients. In 2024, these key crops exhibit varying nutritional requirements, with an average application rate of primary nutrients ranging from 120.97 kg/ha to 255.75 kg/ha. These nutrients are critical for supporting plant metabolic processes and the development of essential tissues, including cells, membranes, and chlorophyll. Nitrogen remains the most widely applied nutrient, with an average application rate of 224.6 kg/ha. As the cultivation area for field crops continues to expand, particularly in South America and the Asia-Pacific regions, regions such as Europe and North America, facing nutrient deficiencies, are increasingly adopting urea specialty fertilizers due to their efficiency.
Natural Gas Price Volatility Raising Production Costs
Feedstock accounts for up to 80% of ex-works urea pricing. When European benchmark gas cleared EUR 300 per MWh (USD 324 per MWh) in 2022, several plants idled rather than operate at negative margins. Producers with upstream integration, such as SABIC in Saudi Arabia, preserve profitability through captive gas. Others deploy hedging programs, yet still confront cash burn when spot spikes surpass hedge coverage. This volatility quickens the shift toward regions with stable gas supply, stimulates adoption of ammonia imports for modular plants, and rekindles interest in renewable hydrogen at declining power tariffs.
Other drivers and restraints analyzed in the detailed report include:
- Cost Advantage of Urea Versus Other Nitrogen Fertilizers
- Growing Preference for Granular Urea in Precision Farming
- Tightening Runoff and Greenhouse Gas Regulations on Nitrogen Use
For complete list of drivers and restraints, kindly check the Table Of Contents.
Segment Analysis
Water-soluble urea fertilizers have emerged as the dominant segment in the specialty urea fertilizers market, commanding 40.35% market share in 2025. Urea, being rich in nitrogen and easily soluble in water, significantly enhances nitrogen uptake by plant roots, thereby stimulating growth. The segment's dominance is primarily driven by shifting climatic patterns, including droughts, heatwaves, and escalating water scarcity worldwide, which have curtailed nitrogen availability in soils. Farmers increasingly prefer water-soluble urea fertilizers as they ensure a consistent nitrogen supply while mitigating nitrogen leaching, volatilization, and associated risks of environmental pollution and groundwater contamination.Controlled-release urea is the fastest-growing segment with a CAGR of 7.28% during the forecast period 2026-2031, as farmers and agribusinesses increasingly adopt efficiency-enhancing inputs to reduce nitrogen losses and comply with sustainability standards. Polymer-coated and polymer sulfur-coated formulations provide extended nutrient release, minimizing leaching and volatilization while improving labor efficiency through reduced application frequency. This growth is further driven by regulatory requirements for nutrient management and the rising use of controlled-release fertilizers in cereals, oilseeds, and specialty crops. The demand for controlled-release urea is accelerating year-on-year as growers aim to achieve higher productivity with reduced environmental impact.
The Urea Market Report Segments the Industry Into Speciality Type (CRF, Liquid Fertilizer, SRF, and Water Soluble), Crop Type (Field Crops, Horticultural Crops, and Turf & Ornamental), Form (Conventional and Speciality), and Region (Asia-Pacific, Europe, Middle East & Africa, North America, and South America). The Market Size is Provided in Terms of Value(USD) and Volume(Metric Tons).
Geography Analysis
Asia-Pacific accounted for 44.92% of 2025 revenue, driven by intensive cereal cultivation in China and India. Growth is further supported by expanding acreage and the adoption of mechanized fertilizing equipment in Vietnam, Indonesia, and the Philippines. In China, fertilizer reduction mandates are encouraging the use of nano urea and coated products, leading to higher spending per hectare despite stable total nutrient tonnage. In India, subsidy reforms promote balanced nutrient management, increasing demand for higher-value formulations over generic prills. Additionally, the ASEAN hydrogen roadmap is preparing the region for low-carbon ammonia imports, which could support future green urea production.
The Middle East and Africa are the fastest-growing regions, with a projected CAGR of 9.17%. Growth is driven by capacity expansions in Saudi Arabia, the UAE, and Nigeria, supported by low-cost gas that enhances export competitiveness. Local farm subsidy programs are also boosting demand in inland areas. Nigeria's Dangote complex serves both domestic and West African markets, reducing dependency on offshore imports. Gulf Cooperation Council countries are exploring solar-powered electrolyzers for green ammonia production, positioning themselves to attract carbon-conscious buyers in Europe and Asia. However, infrastructure gaps and political instability in parts of Sub-Saharan Africa pose challenges, though donor-backed agronomic extension programs continue to support fertilizer adoption.
North America and Europe exhibit mature but steady growth trajectories. In North America, shale gas ensures that fertilizer plants remain among the first-quartile cost producers, sustaining export flows to Latin America. In Europe, stricter farm policies on nutrient caps are driving the adoption of granular coated products. Import terminals in Germany and Belgium are expanding sourcing options, with ammonia imports from North Africa and the Middle East compensating for reduced local production during periods of high gas prices.
- CF Industries Holdings, Inc.
- Coromandel International Ltd.
- EuroChem Group
- Indian Farmers Fertiliser Cooperative Limited
- Koch Industries Inc.
- Nutrien Ltd.
- OCI NV
- SABIC Agri-Nutrients Co.
- Yara International ASA
- Qatar Fertiliser Company (QAFCO)
- PT Pupuk Kalimantan Timur
- Rashtriya Chemicals and Fertilizers Limited
- Acron Group (Acron PJSC)
- BASF SE
- URALCHEM Holding P.L.C.
- The Mosaic Company
Additional Benefits:
- The market estimate (ME) sheet in Excel format
- 3 months of analyst support
TABLE OF CONTENTS
1 INTRODUCTION
- 1.1 Study Assumptions & Market Definition
- 1.2 Scope of the Study
- 1.3 Research Methodology
2 REPORT OFFERS
3 EXECUTIVE SUMMARY & KEY FINDINGS
4 KEY INDUSTRY TRENDS
- 4.1 Acreage Of Major Crop Types
- 4.1.1 Field Crops
- 4.1.2 Horticultural Crops
- 4.2 Average Nutrient Application Rates
- 4.2.1 Micronutrients
- 4.2.1.1 Field Crops
- 4.2.1.2 Horticultural Crops
- 4.2.1 Micronutrients
- 4.3 Primary Nutrients
- 4.3.1 Field Crops
- 4.3.2 Horticultural Crops
- 4.4 Agricultural Land Equipped For Irrigation
- 4.5 Regulatory Framework
- 4.6 Value Chain & Distribution Channel Analysis
- 4.7 Market Drivers
- 4.7.1 Intensifying cereal crop cultivation
- 4.7.2 Fertilizers reliance on nitrogen as a key nutrient
- 4.7.3 Cost advantage of urea versus other nitrogen fertilizers
- 4.7.4 Growing preference for granular urea in precision farming
- 4.7.5 Renewable-hydrogen-based green urea capacity additions
- 4.7.6 Port-side modular urea plants lowering logistics costs
- 4.8 Market Restraints
- 4.8.1 Natural gas price volatility raising production costs
- 4.8.2 Tightening runoff and greenhouse gas regulations on nitrogen use
- 4.8.3 Substitution threat from ammonium nitrate and UAN
- 4.8.4 Geopolitical trade-route disruptions
5 MARKET SIZE AND GROWTH FORECASTS (VALUE AND VOLUME)
- 5.1 Speciality Type
- 5.1.1 CRF
- 5.1.1.1 Polymer Coated
- 5.1.1.2 Polymer-Sulfur Coated
- 5.1.1.3 Others
- 5.1.2 Liquid Fertilizer
- 5.1.3 SRF
- 5.1.4 Water Soluble
- 5.1.1 CRF
- 5.2 Crop Type
- 5.2.1 Field Crops
- 5.2.2 Horticultural Crops
- 5.2.3 Turf & Ornamental
- 5.3 Form
- 5.3.1 Conventional
- 5.3.2 Speciality
- 5.4 Region
- 5.4.1 Asia-Pacific
- 5.4.1.1 Australia
- 5.4.1.2 Bangladesh
- 5.4.1.3 China
- 5.4.1.4 India
- 5.4.1.5 Indonesia
- 5.4.1.6 Japan
- 5.4.1.7 Pakistan
- 5.4.1.8 Philippines
- 5.4.1.9 Thailand
- 5.4.1.10 Vietnam
- 5.4.1.11 Rest of Asia-Pacific
- 5.4.2 Europe
- 5.4.2.1 France
- 5.4.2.2 Germany
- 5.4.2.3 Italy
- 5.4.2.4 Netherlands
- 5.4.2.5 Russia
- 5.4.2.6 Spain
- 5.4.2.7 Ukraine
- 5.4.2.8 United Kingdom
- 5.4.2.9 Rest of Europe
- 5.4.3 Middle East & Africa
- 5.4.3.1 Nigeria
- 5.4.3.2 Saudi Arabia
- 5.4.3.3 South Africa
- 5.4.3.4 Turkey
- 5.4.3.5 Rest of Middle East & Africa
- 5.4.4 North America
- 5.4.4.1 Canada
- 5.4.4.2 Mexico
- 5.4.4.3 United States
- 5.4.4.4 Rest of North America
- 5.4.5 South America
- 5.4.5.1 Argentina
- 5.4.5.2 Brazil
- 5.4.5.3 Rest of South America
- 5.4.1 Asia-Pacific
6 COMPETITIVE LANDSCAPE
- 6.1 Key Strategic Moves
- 6.2 Market Share Analysis
- 6.3 Company Landscape
- 6.4 Company Profiles (Includes Global Level Overview, Market Level Overview, Core Business Segments, Financials, Headcount, Key Information, Market Rank, Market Share, Products and Services, and Analysis of Recent Developments).
- 6.4.1 CF Industries Holdings, Inc.
- 6.4.2 Coromandel International Ltd.
- 6.4.3 EuroChem Group
- 6.4.4 Indian Farmers Fertiliser Cooperative Limited
- 6.4.5 Koch Industries Inc.
- 6.4.6 Nutrien Ltd.
- 6.4.7 OCI NV
- 6.4.8 SABIC Agri-Nutrients Co.
- 6.4.9 Yara International ASA
- 6.4.10 Qatar Fertiliser Company (QAFCO)
- 6.4.11 PT Pupuk Kalimantan Timur
- 6.4.12 Rashtriya Chemicals and Fertilizers Limited
- 6.4.13 Acron Group (Acron PJSC)
- 6.4.14 BASF SE
- 6.4.15 URALCHEM Holding P.L.C.
- 6.4.16 The Mosaic Company