|
시장보고서
상품코드
1693755
북미의 바이오 농약 시장 : 시장 점유율 분석, 산업 동향 및 통계, 성장 예측(2025-2030년)North America Biopesticides - Market Share Analysis, Industry Trends & Statistics, Growth Forecasts (2025 - 2030) |
||||||
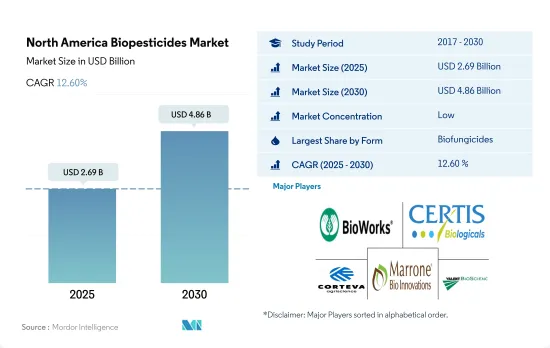
북미의 바이오 농약 시장 규모는 2025년에 26억 9,000만 달러로 추정되고, 2030년에는 48억 6,000만 달러에 이를 것으로 예측되며, 예측 기간(2025-2030년) 중 CAGR 12.60%로 성장할 전망입니다.

- 바이오 농약은 병원성 진균에 의한 질병을 예방하기 위해 식물에 살포되는 물질입니다. 바이오 농약에는 미생물 유래의 것과 식물 유래의 것이 있습니다. 북미의 바이오 농약 시장 규모는 2022년에 8억 9,120만 달러가 되었으며, 같은 해의 시장 점유율은 46.7%로, 가장 인기 있는 바이오 농약 유형이 되었습니다. 바실러스균, 트리코델마균, 슈도모나스균 등의 미생물종이 시장에서 가장 많이 이용되고 있는 바이오 농약입니다.
- 북미의 바이오 농약 시장은 2022년에 5억 6,500만 달러가 되었고, 점유율은 29.6%로, 2번째로 소비량이 많은 바이오 농약이 되고 있습니다. 또한 유기농 재배면적이 가장 큰 밭작물이 2022년 바이오 농약 사용량의 73.5%를 차지했습니다. 원예작물이 21.4%, 환금작물이 5%로 뒤를 이었습니다.
- 기타 바이오 농약에는 살선충제, 살서제, 살진균제, 연체동물 구제제 등의 생물 유래 제품이 포함되어 있습니다. 이들 바이오 농약은 2022년 16.08%의 점유율을 차지했으며, 생물살균제, 생물살충제에 이어 3위를 차지했습니다.
- 바이오 제초제의 2022년 시장 규모는 1억 4,440만 달러로, 같은 해의 소비량은 9,900톤이었습니다. 바이오 제초제란 잡초의 성장을 억제하거나 잡초의 씨앗을 발아시킴으로써 작물의 생장과 경쟁하는 잡초를 관리하는 데 사용되는 미생물, 식물 추출물 또는 기타 식물 독을 말합니다.
- 농업 종사자에게 농약의 과잉 사용에 대한 의식의 고조나, 지속가능한 농법이나 유기 농업을 지원하는 정부의 대처에 의해 바이오 농약 수요가 증가하고 있습니다. 따라서 바이오 농약 시장은 2023-2029년 확대될 것으로 예상됩니다.
- 북미의 바이오 농약 시장은 미국이 크게 지배하고 있으며, 2022년 시장 매출의 68.9%를 차지했습니다. 이 성장은, 이 나라의 광대한 유기 재배 면적에 기인하고 있어, 이 지역의 유기작물 총재배 면적의 39.5%를 차지하고 있습니다. 연작작물도 중요한 역할을 하고 있으며 2022년 시장 금액의 50.5%를 차지했습니다.
- 캐나다는 이 지역에서 2번째로 큰 바이오 농약 시장으로 2022년 시장 점유율은 23.7%였습니다. 이 나라의 유기농 작물 재배 면적은 확대되고 있으며, 2017년 40만ha에서 2022년 45만ha로 확대되었습니다. 이 동향은 앞으로도 계속될 것으로 예상되어 농업용 식물 바이오 농약 시장의 성장을 견인합니다.
- 멕시코는 북미에서 두 번째로 유기농업 면적이 크고, 2022년의 유기농작물 전체의 작부 면적은 54만 ha로, 2029년에는 61만 ha로 증가할 것으로 예상되고 있습니다. 이러한 유기농작물 작부 면적의 증가는 바이오 농약의 주요 수요 촉진요인입니다.
- 기타 북미는 2022년 바이오 농약 소비량의 1.15% 이하였습니다. 그러나 시장은 2017-2022년 2.9% 성장했습니다. 2023-2029년에는 CAGR 9.2%를 기록할 것으로 예측되고 있습니다.
- 북미의 바이오 농약 시장은 농업 종사자의 지속가능성에 대한 지식 증가와 유기농업을 추진하는 정부의 시책에 의해 다른 북미 국가보다 미국이 성장이 빠를 것으로 예측됩니다. 유기 제품과 지속 가능한 농업에 대한 수요가 증가함에 따라 향후 수년간 바이오 농약 시장의 성장을 가속할 수 있습니다.
북미의 바이오 농약 시장 동향
미국 등 주요 국가에서 유기농산물 수요 증가, 정부 지원으로 재배면적 증가
- FibL 통계가 제공한 데이터에 따르면, 북미에서 작물의 유기 재배 면적은 2021년에 150만 ha를 기록했습니다. 이 지역의 유기 재배 면적은 2017-2021년 13.5% 증가했습니다. 북미 국가 중에서는 미국이 압도적이고, 유기 재배의 농지 면적은 62만 3,000ha로, 캘리포니아주, 메인주, 뉴욕주가 농업을 실천하고 있는 주요주입니다.
- 미국에 이어 멕시코로, 2021년 유기농업 실시 면적은 53만 1,100ha입니다. 멕시코는 세계 유기농 식품 생산량의 상위 20 개에 있습니다. 세계의 커피 마스터스 데이터에 따르면 멕시코는 세계 최대의 유기 커피 수출국입니다. 이 나라의 유기 커피 생산자 수에서 본 유기 커피 생산 면적은 최대입니다. 국내 주요 유기농 식품 생산주는 치아파스, 오악사카, 미초아칸, 치와와, 게레로에서 국내 유기농 면적의 80.0%를 차지합니다. 전국 유기농업협회(National Association for Organic Agriculture) 등의 조직이 국내에서 유기농업을 추진하고 있으며, 보다 많은 농업 종사자가 유기농업에 임하는 동기부여가 될 것으로 기대되고 있습니다. 멕시코 정부는 자금 지원 외에도 유기농 농업을 지원하는 연구 개발 활동을 지원합니다.
- 캐나다의 유기농 작물 재배 면적은 2017년 40만 ha에서 2021년에는 45만 ha로 증가했습니다. 2021년에는 42만 ha로 열작물이 최대 면적을 차지했습니다. 캐나다 정부는 유기농업 종사자를 지원하기 위한 유기 개발 기금으로 2021년에 29만 7,330달러를 출연하겠다고 발표했습니다. 이러한 대처에 의해, 동지역의 유기 재배 면적의 증가가 기대됩니다.
국내 및 국제 시장에서 유기농산물 수요 증가, 유기농 식품에 대한 1인당 지출 증가
- 북미의 유기농 식품에 대한 1인당 평균 지출 금액은 2021년에는 109.7달러였습니다. 미국의 1인당 지출은 북미 국가 중 가장 높으며 2021년 평균 지출은 186.7달러였습니다. 유기농 타도협회에 따르면 미국의 유기농 제품 매출액은 2021년 630억 달러를 넘어 전년 대비 2.0% 증가했고 유기농 식품 매출액은 2021년 575억 달러로 나타났습니다. 유기농 과일 및 채소는 유기농 제품 매출액 전체의 15.0%를 차지하며 2021년 금액은 210억 달러였습니다.
- 캐나다 유기 연합이 보고한 데이터에 따르면 캐나다의 유기농 식품 매출은 2020년에 81억 달러에 이르렀습니다. 캐나다는 유기농 제품 세계 6위의 시장이며, 이 나라에서는 유기농 제품의 공급이 수요를 따라가지 못하고 있다고 보고되고 있습니다. 2021년 1인당 유기농 식품에 대한 평균 지출액은 142.6달러였습니다. 소매업체에 대한 정부의 지원이 증가함으로써 이 나라의 유기농 제품의 입수 가능성, 입수 용이성, 저렴한 가격이 높아질 것으로 예상됩니다. Organic Tarde Association은 캐나다의 유기농 제품 시장이 2021-2026년 사이에 CAGR 6.3%를 기록할 것으로 예측하고 있습니다.
- 2021년 멕시코의 유기농 제품 시장 규모는 6,300만 달러로 세계 랭크는 35위였습니다. 유기농 트레이드 협회에 따르면 2021-2026년 CAGR 7.2%를 기록할 것으로 추정되고 있습니다. 그러나 이 나라의 유기농 제품에 대한 1인당 지출액은 이 지역의 다른 나라들에 비해 적어 2021년에는 0.49달러를 차지했습니다. 멕시코 시장에 진입하는 기업이 늘어나면 이 나라의 유기농 제품 수요가 높아질 것으로 예상됩니다.
북미의 바이오 농약 산업 개요
북미의 바이오 농약 시장은 세분화되어 있으며 상위 5개사에서 6.36%를 차지하고 있습니다. 이 시장의 주요 기업은 Bioworks Inc., Certis USA LLC, Corteva Agriscience, Marrone Bio Innovations Inc., Valent Biosciences LLC 등입니다.
기타 혜택
- 엑셀 형식 시장 예측(ME) 시트
- 3개월의 애널리스트 서포트
목차
제1장 주요 요약 및 주요 조사 결과
제2장 보고서 제안
제3장 서문
- 조사의 전제조건 및 시장 정의
- 조사 범위
- 조사 방법
제4장 주요 산업 동향
- 유기 재배 면적
- 1인당 유기농 제품에 대한 지출
- 규제 프레임워크
- 캐나다
- 멕시코
- 미국
- 밸류체인 및 유통 채널 분석
제5장 시장 세분화
- 형태별
- 바이오 농약
- 바이오 제초제
- 바이오 농약
- 기타 바이오 농약
- 작물 유형별
- 환금작물
- 원예작물
- 경작작물
- 국가별
- 캐나다
- 멕시코
- 미국
- 기타 북미
제6장 경쟁 구도
- 주요 전략 동향
- 시장 점유율 분석
- 기업 상황
- 기업 프로파일
- AEF Global Biopesticides
- Andermatt Group AG
- BIOQUALITUM SA de CV
- Bioworks Inc.
- Certis USA LLC
- Corteva Agriscience
- Lallemand Inc.
- Marrone Bio Innovations Inc.
- Terramera Inc.
- Valent Biosciences LLC
제7장 CEO에 대한 주요 전략적 질문
제8장 부록
- 세계 개요
- 개요
- Porter's Five Forces 분석 프레임워크
- 세계의 밸류체인 분석
- 시장 역학(DROs)
- 정보원 및 참고문헌
- 도표 일람
- 주요 인사이트
- 데이터 팩
- 용어집
The North America Biopesticides Market size is estimated at 2.69 billion USD in 2025, and is expected to reach 4.86 billion USD by 2030, growing at a CAGR of 12.60% during the forecast period (2025-2030).
- Biofungicides are substances applied to plants to prevent diseases caused by pathogenic fungi. Biofungicides may be of microbial or botanical origin. In North America, the market for biofungicides was valued at USD 891.2 million in 2022, making them the most popular biopesticide type, with a 46.7% market share in the same year. Microbial species like Bacillus, Trichoderma, and Pseudomonas are the most available biofungicides in the market.
- The market for bioinsecticides in North America was valued at USD 565.0 million in 2022, with a share of 29.6%, making it the second most consumed biopesticide. Furthermore, the field crops with the largest area under organic agriculture accounted for 73.5% of bioinsecticide usage in 2022. Horticulture and cash crops followed with 21.4% and 5%, respectively, in the same year.
- Other biopesticides include products like nematicides, rodenticides, acaricides, and molluscicides of biological origin. These biological pesticides accounted for a share of 16.08% in 2022, occupying the third place after biofungicides and bioinsecticides.
- The market for biological herbicides was valued at USD 144.4 million in 2022, with a volume consumption of 9.9 thousand metric tons in the same year. Bioherbicides are microbes, plant extracts, or other phytotoxins used to manage weeds that compete with crops for growth by reducing weed growth or germinating weed seeds.
- The increasing awareness about the overuse of pesticides among farmers and the government initiatives to support sustainable agricultural practices and organic farming resulted in an increasing demand for biopesticides. Therefore, the market for biopesticides is anticipated to increase between 2023 and 2029.
- The North American biopesticides market is largely dominated by the United States, which accounted for 68.9% of the market value in 2022. This growth can be attributed to the country's vast organic cultivation area, which makes up 39.5% of the total organic crop area in the region. Row crops also play a significant role, which made up 50.5% of the market value in 2022.
- Canada was the second-largest biopesticides market in the region, with a market share of 23.7% in 2022. The country's organic crop farming area has been expanding, which grew from 400.0 thousand ha in 2017 to 450.0 thousand ha in 2022. This trend is expected to continue, driving growth in the agricultural plant biopesticides market.
- Mexico has the second-largest organic agricultural area in North America, with an overall organic crop area of 0.54 million ha in 2022, which is expected to increase to 0.61 million ha by 2029. This growth in organic crop areas is a key demand driver for biopesticides.
- The Rest of North America accounted for less than 1.15% of biopesticide consumption in 2022. However, the market grew by 2.9% between 2017 and 2022. It is projected to register a CAGR of 9.2% between 2023 and 2029.
- The North American biopesticides market is expected to grow faster in the United States than in other North American countries due to increased knowledge of sustainability among farmers and government measures promoting organic farming. The rising demand for organic products and sustainable agriculture practices may also drive growth in the biopesticides market in the coming years.
North America Biopesticides Market Trends
Organic produce demand grows in major countries like the United States, increasing cultivation area with government support
- The area under organic cultivation of crops in North America was recorded at 1.5 million ha in 2021, according to the data provided by FibL statistics. The area under organic cultivation in the region increased by 13.5% between 2017 and 2021. Among the North American countries, the United States is dominant, with 623.0 thousand ha of agricultural land under organic farming, with California, Maine, and New York being the major states practicing agriculture.
- The United States was followed by Mexico, with 531.1 thousand hectares of area under organic farming in 2021. Mexico is among the top 20 organic food producers in the world. Mexico is the largest exporter of organic coffee in the world, according to the Global Coffee Masters data. The country has the largest area under organic coffee production in terms of the number of organic coffee producers in the country. The major organic food-producing states in the country include Chiapas, Oaxaca, Michoacan, Chihuahua, and Guerrero, which account for 80.0% of the total organic area in the country. Organizations such as the National Association for Organic Agriculture are promoting organic agriculture in the country, which is expected to motivate more farmers to take up organic agriculture. In addition to financial assistance, the Mexican government supports research and development activities to help organic agriculture.
- Canada's area under organic crop cultivation increased from 0.4 million ha in 2017 to 0.45 million ha in 2021. Row crops occupied the maximum area with 0.42 million in 2021. The Canadian government announced a sum of USD 297,330 in 2021 as Organic Development Fund to support organic farmers. These initiatives are expected to increase the organic area in the region.
Growing demand for organic produce in domestic and international markets, rise in per capita spending on organic food
- The average per capita spending on organic food products in North America was USD 109.7 in 2021. The per capita spending in the United States is the highest among the North American countries, with average spending of USD 186.7 in 2021. The sales of organic products in the United States crossed USD 63.00 billion in 2021, according to the Organic Tarde Association, with a 2.0% increase over the previous year, with organic food sales standing at USD 57.5 billion in 2021. Organic fruits and vegetables accounted for 15.0% of the total organic product sales, with a value of USD 21.0 billion in 2021.
- Organic food sales in Canada reached a value of USD 8.10 billion in 2020, as per the data reported by the Organic Federation of Canada. It is reported that Canada is the sixth-largest market in the world for organic products, with the supply of organic products failing to keep up with the demand in the country. The average spending on organic food per person was USD 142.6 in 2021. Increasing government support to retailers is expected to increase the availability, accessibility, and affordability of organic products in the country. The Organic Tarde Association estimates that the organic products market in Canada is expected to register a CAGR of 6.3% between 2021 and 2026.
- In 2021, Mexico registered a market size of USD 63.0 million for organic products with a global rank of 35. According to the Organic Trade Association, it is estimated to register a CAGR of 7.2% between 2021 and 2026. However, the per capita spending on organic products in the country is less compared to other countries in the region, accounting for a value of USD 0.49 in 2021. More players entering the market in Mexico are expected to increase the demand for organic products in the country.
North America Biopesticides Industry Overview
The North America Biopesticides Market is fragmented, with the top five companies occupying 6.36%. The major players in this market are Bioworks Inc., Certis U.S.A. LLC, Corteva Agriscience, Marrone Bio Innovations Inc. and Valent Biosciences LLC (sorted alphabetically).
Additional Benefits:
- The market estimate (ME) sheet in Excel format
- 3 months of analyst support
TABLE OF CONTENTS
1 EXECUTIVE SUMMARY & KEY FINDINGS
2 REPORT OFFERS
3 INTRODUCTION
- 3.1 Study Assumptions & Market Definition
- 3.2 Scope of the Study
- 3.3 Research Methodology
4 KEY INDUSTRY TRENDS
- 4.1 Area Under Organic Cultivation
- 4.2 Per Capita Spending On Organic Products
- 4.3 Regulatory Framework
- 4.3.1 Canada
- 4.3.2 Mexico
- 4.3.3 United States
- 4.4 Value Chain & Distribution Channel Analysis
5 MARKET SEGMENTATION (includes market size in Value in USD and Volume, Forecasts up to 2030 and analysis of growth prospects)
- 5.1 Form
- 5.1.1 Biofungicides
- 5.1.2 Bioherbicides
- 5.1.3 Bioinsecticides
- 5.1.4 Other Biopesticides
- 5.2 Crop Type
- 5.2.1 Cash Crops
- 5.2.2 Horticultural Crops
- 5.2.3 Row Crops
- 5.3 Country
- 5.3.1 Canada
- 5.3.2 Mexico
- 5.3.3 United States
- 5.3.4 Rest of North America
6 COMPETITIVE LANDSCAPE
- 6.1 Key Strategic Moves
- 6.2 Market Share Analysis
- 6.3 Company Landscape
- 6.4 Company Profiles (includes Global Level Overview, Market Level Overview, Core Business Segments, Financials, Headcount, Key Information, Market Rank, Market Share, Products and Services, and Analysis of Recent Developments).
- 6.4.1 AEF Global Biopesticides
- 6.4.2 Andermatt Group AG
- 6.4.3 BIOQUALITUM SA de CV
- 6.4.4 Bioworks Inc.
- 6.4.5 Certis U.S.A. LLC
- 6.4.6 Corteva Agriscience
- 6.4.7 Lallemand Inc.
- 6.4.8 Marrone Bio Innovations Inc.
- 6.4.9 Terramera Inc.
- 6.4.10 Valent Biosciences LLC
7 KEY STRATEGIC QUESTIONS FOR AGRICULTURAL BIOLOGICALS CEOS
8 APPENDIX
- 8.1 Global Overview
- 8.1.1 Overview
- 8.1.2 Porter's Five Forces Framework
- 8.1.3 Global Value Chain Analysis
- 8.1.4 Market Dynamics (DROs)
- 8.2 Sources & References
- 8.3 List of Tables & Figures
- 8.4 Primary Insights
- 8.5 Data Pack
- 8.6 Glossary of Terms