


|
시장보고서
상품코드
1693829
아프리카의 엔지니어링 플라스틱 시장 : 시장 점유율 분석, 산업 동향 및 통계, 성장 예측(2024-2029년)Africa Engineering Plastics - Market Share Analysis, Industry Trends & Statistics, Growth Forecasts (2024 - 2029) |
||||||
■ 보고서에 따라 최신 정보로 업데이트하여 보내드립니다. 배송일정은 문의해 주시기 바랍니다.
가격
※ 부가세 별도
한글목차
영문목차
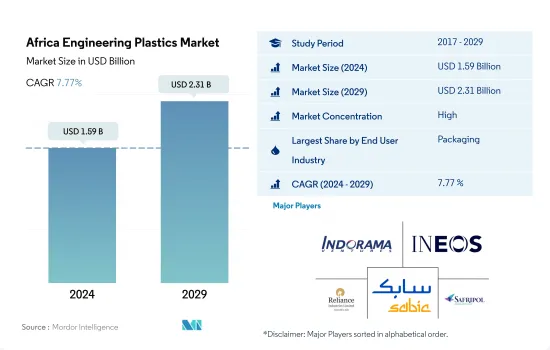
아프리카의 엔지니어링 플라스틱 시장 규모는 2024년에 15억 9,000만 달러에 달했고, 2029년에는 23억 1,000만 달러에 이를 것으로 예상되며, 예측 기간 중(2024-2029년) CAGR은 7.77%를 나타낼 것으로 전망됩니다.
향후 몇 년 동안 포장 산업이 시장을 독점
- 2022년, 아프리카의 엔지니어링 플라스틱 시장의 세계 점유율은 매출액에서 1.32%였습니다.
- 아프리카의 2022년 플라스틱 포장 생산량은 313만톤으로 전년대비 2.85%의 성장을 보였습니다. 식품 산업은 완제품 포장의 마케팅 측면에 대한 관심을 높일 수 있습니다. 제품의 유통 기한을 개선하고 편리한 라이프 스타일을 늘려야 할 필요성은 예측 기간 동안 시장을 주도하여 볼륨 측면에서 4.95 %의 CAGR을 나타낼 것으로 예상됩니다.
- 전기 및 전자산업은 이 지역에서 제2위입니다. 아프리카에서의 전기 및 전자기기 수요 증가나 LG가 수단에 세탁기 조립공장을 설치하기 위해 새롭게 투자하는 등 한국의 주요 전기 및 전자기기 브랜드가 제조시설 설치에 투자 따라서 이 지역의 전기 및 전자기기 생산에 따른 수익은 2022년에 320억 달러에 이르렀습니다. 그 결과, 이 지역의 엔지니어링 플라스틱 시장은 2023년부터 2029년까지 매출 기준으로 7.41%의 연평균 성장률을 나타낼 것으로 예상됩니다.
- 자동차산업은 예측기간(2023-2029년)의 CAGR(금액 기준)은 8.93%를 나타내 시장에서 가장 급성장하는 산업으로 예측됩니다.
남아프리카가 역내 최대 시장으로 계속
- 나이지리아와 남아프리카 등의 아프리카 국가에서는 엔지니어링 플라스틱이 자동차, 항공우주, 산업기계 등 다양한 산업에서 사용되고 있습니다.
- 남아프리카는 항공우주산업, 자동차산업, 산업기계산업이 발흥하고 있기 때문에 이 지역에서 가장 큰 엔지니어링 플라스틱 소비국입니다. 자동차 생산이 수량으로 약 44.3%였습니다. 이러한 산업이 다양한 수지 수요 증가를 견인하고 있습니다.
- 나이지리아에서는 자동차 생산 증가나 산업 및 기계 산업의 성장 등에 의해 각종 수지 수요가 대폭 증가하고 있습니다. 이 나라의 자동차 생산은 특히 이륜차로 확대되고 있습니다.
- 남아프리카는 자동차 생산 증가와 항공우주 산업 및 기타 산업의 성장으로 인해 2023-2029년 CAGR(매출 기준)이 6.45%를 나타내고, 아프리카에서 엔지니어링 플라스틱의 소비가 가장 급성장하는 나라가 될 것으로 예측됩니다. 예를 들어, 이 나라의 항공우주 부품 생산은 예측 기간 동안 매출 기준으로 5.48%의 연평균 성장률을 나타낼 것으로 예상되며 남아공 엔지니어링 플라스틱 시장을 견인할 것으로 전망됩니다.
아프리카의 엔지니어링 플라스틱 시장 동향
급증하는 수요에 대응하기 위해 제조업이 증가 중
- 남아프리카는 아프리카 유수의 제조 거점입니다. 제조 능력, 효율적인 물류 네트워크, 우대적인 지역 시장 액세스에 의해 남아프리카는 아프리카에의 제품 공급을 목표로 하는 일렉트로닉스 기업에 이상적인 입지가 되고 있습니다 남아프리카에는 전기기계, 소비자용 전자기기 제품, 통신기기에서 소비자용 전자기기에 이르기까지 다양한 전자 산업이 있습니다.
- 소비자 전자 산업은 여전히 수입에 크게 의존하고 있습니다.에서 감소했습니다. 피처폰의 부문에서는 벤더가 피처폰에서 엔트리 레벨의 스마트폰에의 이행을 진행했기 때문에 출하 대수는 전년대비 26.6% 감소의 2,190만대가 되었습니다.
- 정부는 국내제조의 촉진·지원, 연구개발, 전기 및 전자제조업의 안전기준 개발에 주력하고 있습니다.
아프리카의 엔지니어링 플라스틱 산업 개요
아프리카의 엔지니어링 플라스틱 시장은 상당히 통합되어 있으며 상위 5개 기업이 100%를 차지하고 있습니다.
기타 혜택
- 엑셀 형식 시장 예측(ME) 시트
- 3개월의 애널리스트 서포트
목차
제1장 주요 요약과 주요 조사 결과
제2장 보고서 제안
제3장 서론
- 조사의 전제조건과 시장 정의
- 조사 범위
- 조사 방법
제4장 주요 산업 동향
- 최종 사용자 동향
- 항공우주
- 자동차
- 건축 및 건설
- 전기 및 전자
- 포장
- 수출입 동향
- 불소수지 무역
- 폴리아미드(PA) 무역
- 폴리에틸렌 테레프탈레이트(PET) 무역
- 폴리메틸메타크릴레이트(PMMA) 무역
- 폴리옥시메틸렌(POM) 무역
- 스티렌 공중합체(ABS 및 SAN) 무역
- 가격 동향
- 재활용 개요
- 폴리아미드(PA) 재활용 동향
- 폴리카보네이트(PC) 재활용 동향
- 폴리에틸렌 테레프탈레이트(PET) 재활용 동향
- 스티렌 공중합체(ABS 및 SAN) 재활용 동향
- 규제 프레임워크
- 나이지리아
- 남아프리카
- 밸류체인과 유통채널 분석
제5장 시장 세분화
- 최종 사용자 산업
- 항공우주
- 자동차
- 건축 및 건설
- 전기 및 전자
- 산업 및 기계
- 포장
- 기타
- 수지 유형
- 불소수지
- 하위 수지 유형별
- 에틸렌테트라플루오로에틸렌(ETFE)
- 플루오르화 에틸렌-프로필렌(FEP)
- 폴리테트라플루오로에틸렌(PTFE)
- 폴리비닐플루오라이드(PVF)
- 폴리비닐리덴 플루오라이드(PVDF)
- 기타 하위 수지
- 액정 폴리머(LCP)
- 폴리아미드(PA)
- 하위 수지 유형별
- 아라미드
- 폴리아미드(PA) 6
- 폴리아미드(PA) 66
- 폴리프탈아미드
- 폴리부틸렌테레프탈레이트(PBT)
- 폴리카보네이트(PC)
- 폴리에테르에테르케톤(PEEK)
- 폴리에틸렌 테레프탈레이트(PET)
- 폴리이미드(PI)
- 폴리메틸메타크릴레이트(PMMA)
- 폴리옥시메틸렌(POM)
- 스티렌 공중합체(ABS 및 SAN)
- 불소수지
- 국가명
- 나이지리아
- 남아프리카
- 기타 아프리카
제6장 경쟁 구도
- 주요 전략 동향
- 시장 점유율 분석
- 기업 상황
- 기업 프로파일
- Alfa SAB de CV
- Covestro AG
- Far Eastern New Century Corporation
- Indorama Ventures Public Company Limited
- INEOS
- JBF Industries Ltd
- Reliance Industries Limited
- Rohm GmbH
- SABIC
- Safripol division of KAP Diversified Industrial(Pty) Ltd
제7장 CEO에 대한 주요 전략적 질문
제8장 부록
- 세계 개요
- 개요
- Five Forces 분석 프레임워크(산업 매력도 분석)
- 세계의 밸류체인 분석
- 시장 역학(DROs)
- 정보원과 참고문헌
- 도표 일람
- 주요 인사이트
- 데이터 팩
- 용어집
The Africa Engineering Plastics Market size is estimated at 1.59 billion USD in 2024, and is expected to reach 2.31 billion USD by 2029, growing at a CAGR of 7.77% during the forecast period (2024-2029).

Packaging industry to dominate the market in the coming years
- In 2022, the African engineering plastics market had a global share of 1.32% by revenue. One of the primary drivers of the increase in resin consumption is their increased use in the packaging, electrical, and electronics industries. The packaging and electrical and electronics industries accounted for around 37.5% of the revenue and 12.18% of the revenue of the overall engineering plastics market, respectively, in 2022.
- Africa's plastic packaging production had a volume of 3.13 million tons in 2022, a 2.85% growth compared to the previous year. This plastic packaging industry has developed in the region largely as a response to growth in the farming and food industries. The food industry is increasingly interested in the marketing aspect of packaging for their finished products. The need to improve the product's shelf-life and increase convenience lifestyle is expected to drive the market during the forecast period, registering a CAGR of 4.95% in terms of volume.
- The electrical and electronics industry is the second largest in the region. The region's revenue from electrical and electronics production was USD 32 billion in 2022, with increasing demand for electrical and electronics in Africa and major South Korean electrical and electronics brands investing in setting up their manufacturing facilities, like LG's new investment in setting up washing machine assembly plant in Sudan. As a result, the engineering plastics market in the region is expected to record a CAGR of 7.41%, by revenue, from 2023 to 2029.
- The automotive industry is projected to be the fastest-growing industry in the market, with a CAGR of 8.93%, by value, during the forecast period (2023-2029). This can be attributed to the growing automotive production in Morocco and South Africa.
South Africa to remain the largest market in the region
- Engineering plastics are used in African countries such as Nigeria and South Africa for various industries, including automotive, aerospace, and industrial machinery. In 2022, South Africa and Nigeria accounted for 30.15% and 10.69% of the values of various engineering plastic resins, respectively, in the region.
- South Africa is the largest consumer of engineering plastics in the region, owing to its rising aerospace, automotive, and industrial machinery industries. Aircraft components and vehicle production held a share of around 68.7% by revenue and 44.3% by volume compared at the regional level, respectively, in 2022. These industries are driving the increasing demand for various resins. The rising automotive, industrial, and machinery production due to increased climate-conscious policies is expected to drive the demand for resins in South Africa.
- The demand for various resins in Nigeria is increasing significantly due to rising vehicle production and growth in the industrial and machinery industry, among other factors. Nigeria is Africa's largest vehicle producer. In 2022, the country produced 394,449 units, translating to a 33% share of vehicle production in Africa. The production of vehicles in the country is expanding, especially of two-wheelers. The production of vehicles is expected to reach 584,350 units by 2029, recording a CAGR of 6.77%. These factors are expected to drive the demand for engineering plastics in the country.
- South Africa is expected to be the fastest-growing country in Africa for the consumption of engineering plastics, with a CAGR of 6.45%, by revenue, from 2023 to 2029, owing to increased vehicle production and growth in aerospace and other industries. For example, aerospace component production in the country is expected to record a CAGR of 5.48%, by revenue, during the forecast period, and it is expected to drive the South African engineering plastics market.
Africa Engineering Plastics Market Trends
Manufacturing on the rise to tackle the rapidly growing demand
- South Africa is the leading manufacturing hub in Africa. Its manufacturing capabilities, efficient logistics network, and preferential regional market access position the country as an ideal location for electronics companies seeking to supply their products to Africa. South Africa has a diverse electronics industry that ranges from electrical machinery, household appliances, and telecommunication equipment to consumer electronics. In 2022, the African region imported around 70% of its local electrical and electronics demand.
- The consumer electronics industry still relies heavily on imports. According to estimates, South Africa brought 60% of all consumer electronics into Africa in 2018. In 2020, the electrical and electronic production in the country decreased at a growth rate of around 3.2%, by revenue, compared to the previous year, owing to the widespread lockdown adopted by the government and the supply chain disruption faced due to the lockdown. In the feature phone space, shipments were down by 26.6% to 21.9 million units as vendors were transitioning away from these devices toward entry-level smartphones. All such factors led to a decrease in the production of electrical and electronic components in the region at a CAGR of -9.41% from 2020 to 2022.
- The government is focused on promoting and supporting domestic manufacturing, R&D, and developing safety standards for the electrical and electronics manufacturing industry. The output of electrical and electronic industrial components is anticipated to record a CAGR of 6.28% during the forecast period (2023-2029) to supply the emerging African middle-class population.
Africa Engineering Plastics Industry Overview
The Africa Engineering Plastics Market is fairly consolidated, with the top five companies occupying 100%. The major players in this market are Indorama Ventures Public Company Limited, INEOS, Reliance Industries Limited, SABIC and Safripol division of KAP Diversified Industrial (Pty) Ltd (sorted alphabetically).
Additional Benefits:
- The market estimate (ME) sheet in Excel format
- 3 months of analyst support
TABLE OF CONTENTS
1 EXECUTIVE SUMMARY & KEY FINDINGS
2 REPORT OFFERS
3 INTRODUCTION
- 3.1 Study Assumptions & Market Definition
- 3.2 Scope of the Study
- 3.3 Research Methodology
4 KEY INDUSTRY TRENDS
- 4.1 End User Trends
- 4.1.1 Aerospace
- 4.1.2 Automotive
- 4.1.3 Building and Construction
- 4.1.4 Electrical and Electronics
- 4.1.5 Packaging
- 4.2 Import And Export Trends
- 4.2.1 Fluoropolymer Trade
- 4.2.2 Polyamide (PA) Trade
- 4.2.3 Polyethylene Terephthalate (PET) Trade
- 4.2.4 Polymethyl Methacrylate (PMMA) Trade
- 4.2.5 Polyoxymethylene (POM) Trade
- 4.2.6 Styrene Copolymers (ABS and SAN) Trade
- 4.3 Price Trends
- 4.4 Recycling Overview
- 4.4.1 Polyamide (PA) Recycling Trends
- 4.4.2 Polycarbonate (PC) Recycling Trends
- 4.4.3 Polyethylene Terephthalate (PET) Recycling Trends
- 4.4.4 Styrene Copolymers (ABS and SAN) Recycling Trends
- 4.5 Regulatory Framework
- 4.5.1 Nigeria
- 4.5.2 South Africa
- 4.6 Value Chain & Distribution Channel Analysis
5 MARKET SEGMENTATION (includes market size in Value in USD and Volume, Forecasts up to 2029 and analysis of growth prospects)
- 5.1 End User Industry
- 5.1.1 Aerospace
- 5.1.2 Automotive
- 5.1.3 Building and Construction
- 5.1.4 Electrical and Electronics
- 5.1.5 Industrial and Machinery
- 5.1.6 Packaging
- 5.1.7 Other End-user Industries
- 5.2 Resin Type
- 5.2.1 Fluoropolymer
- 5.2.1.1 By Sub Resin Type
- 5.2.1.1.1 Ethylenetetrafluoroethylene (ETFE)
- 5.2.1.1.2 Fluorinated Ethylene-propylene (FEP)
- 5.2.1.1.3 Polytetrafluoroethylene (PTFE)
- 5.2.1.1.4 Polyvinylfluoride (PVF)
- 5.2.1.1.5 Polyvinylidene Fluoride (PVDF)
- 5.2.1.1.6 Other Sub Resin Types
- 5.2.2 Liquid Crystal Polymer (LCP)
- 5.2.3 Polyamide (PA)
- 5.2.3.1 By Sub Resin Type
- 5.2.3.1.1 Aramid
- 5.2.3.1.2 Polyamide (PA) 6
- 5.2.3.1.3 Polyamide (PA) 66
- 5.2.3.1.4 Polyphthalamide
- 5.2.4 Polybutylene Terephthalate (PBT)
- 5.2.5 Polycarbonate (PC)
- 5.2.6 Polyether Ether Ketone (PEEK)
- 5.2.7 Polyethylene Terephthalate (PET)
- 5.2.8 Polyimide (PI)
- 5.2.9 Polymethyl Methacrylate (PMMA)
- 5.2.10 Polyoxymethylene (POM)
- 5.2.11 Styrene Copolymers (ABS and SAN)
- 5.2.1 Fluoropolymer
- 5.3 Country
- 5.3.1 Nigeria
- 5.3.2 South Africa
- 5.3.3 Rest of Africa
6 COMPETITIVE LANDSCAPE
- 6.1 Key Strategic Moves
- 6.2 Market Share Analysis
- 6.3 Company Landscape
- 6.4 Company Profiles (includes Global Level Overview, Market Level Overview, Core Business Segments, Financials, Headcount, Key Information, Market Rank, Market Share, Products and Services, and Analysis of Recent Developments).
- 6.4.1 Alfa S.A.B. de C.V.
- 6.4.2 Covestro AG
- 6.4.3 Far Eastern New Century Corporation
- 6.4.4 Indorama Ventures Public Company Limited
- 6.4.5 INEOS
- 6.4.6 JBF Industries Ltd
- 6.4.7 Reliance Industries Limited
- 6.4.8 Rohm GmbH
- 6.4.9 SABIC
- 6.4.10 Safripol division of KAP Diversified Industrial (Pty) Ltd
7 KEY STRATEGIC QUESTIONS FOR ENGINEERING PLASTICS CEOS
8 APPENDIX
- 8.1 Global Overview
- 8.1.1 Overview
- 8.1.2 Porter's Five Forces Framework (Industry Attractiveness Analysis)
- 8.1.3 Global Value Chain Analysis
- 8.1.4 Market Dynamics (DROs)
- 8.2 Sources & References
- 8.3 List of Tables & Figures
- 8.4 Primary Insights
- 8.5 Data Pack
- 8.6 Glossary of Terms
