
|
시장보고서
상품코드
1842511
데이터 분류 : 시장 점유율 분석, 산업 동향, 통계, 성장 예측(2025-2030년)Data Classification - Market Share Analysis, Industry Trends & Statistics, Growth Forecasts (2025 - 2030) |
||||||
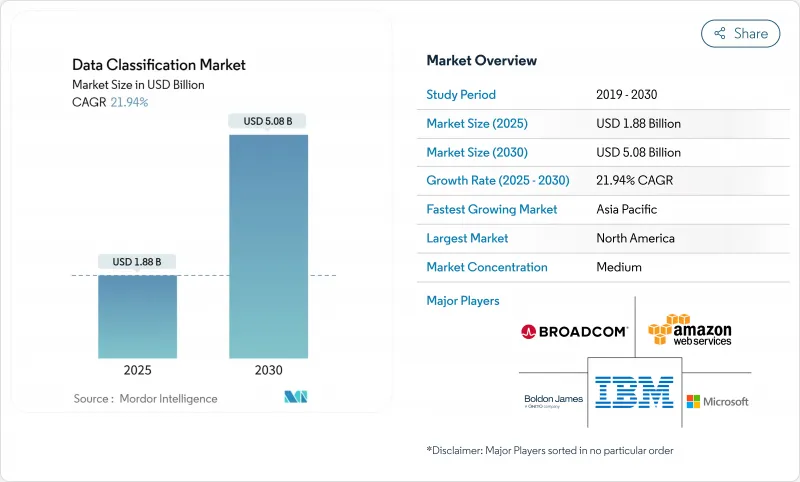
데이터 분류 시장 규모는 2025년에 18억 8,000만 달러를 창출하고, 2030년에는 50억 8,000만 달러에 이를 것으로 예상되며, CAGR은 21.9%에 달할 전망입니다.

매일 3억 2,877만 TB가 생성될 것으로 예상되는 급속한 데이터 증가와 세계 프라이버시 규제의 강화로 기업은 하이브리드 클라우드 전체에서 확장 가능한 실시간 AI 대응 데이터 라벨링의 채용을 추진하고 있습니다. 클라우드 네이티브 아키텍처에 내장된 AI 기반 분류 엔진은 비정형 리포지토리 전체의 기밀 정보를 감지하고 아시아태평양의 주요 클라우드 구상이 수요를 뒷받침하고 있습니다. 2024년에 에너지 부문의 정보 유출 평균 비용이 478만 달러에 달하는 위협 증가는 자동화된 거버넌스의 긴급성을 더욱 강조했습니다. AWS 및 Microsoft와 같은 하이퍼스케일러를 통한 지역 데이터센터 투자는 대기 시간을 낮추고 거주 규칙을 충족함으로써 기세를 늘리고 있습니다.
세계의 데이터 분류 시장 동향과 인사이트
확대하는 세계 프라이버시 의무
유럽의 DORA 규칙과 HIPAA 기준을 업데이트함으로써 규정 준수는 정기적인 감사에서 지속적인 검증으로 전환하고 기업은 분류 로직을 데이터 처리 워크 플로에 직접 통합해야합니다. 여러 법역에서 사업을 전개하는 다국적 기업에서는 가장 엄격한 세계 요건이 기준으로 적용되는 경우가 많으며, 통일된 분류 아키텍처의 도입이 가속화되고 있습니다. 금융기관은 돈세탁방지 보고를 몇 분 이내에 실시해야 하며, 정책 주도의 발견에 대한 수요가 높아지고 있습니다. GDPR(EU 개인정보보호규정)에 따른 라틴아메리카의 데이터 주권법에서도 비슷한 압력이 가해지고 있습니다. 이러한 의무화는 조달주기를 단축시켜 중견기업도 정책을 자동으로 업데이트하는 SaaS 기반 툴로 마이그레이션하게 됩니다.
비구조화된 데이터의 폭발적 증가와 침해 위험
비정형 리포지토리는 매년 62% 증가하고 있으며 보안 팀은 누가 기밀 기록을 보유하고 있는지 알지 못합니다. 회사는 파일 공유의 82%가 과도한 사용 권한을 설정했으며 귀중한 설계 및 고객 데이터가 유출되었다고 보고했습니다. 에너지 및 유틸리티 기업에서는 현재, 매주 1,100건의 사이버 공격이 발생하고 있어 정보 유출을 조사한 결과, 잘못된 분류의 문서가 근본적인 원인인 것이 판명되었습니다. 법률 사무소는 고객 파일이 라벨 없이 공유 드라이브에 저장되기 때문에 유사한 피해를 입습니다. 정적 규칙 세트는 동적 협업 플랫폼을 지원할 수 없기 때문에 AI의 패턴 인식이 점점 더 선택되고 있습니다.
업계를 통한 분류 기준 부족
금융 규제 당국은 의료 기관과 다른 위험 데이터를 분류하므로 공급업체는 산업별 규칙 라이브러리를 유지해야 합니다. 다국적 기업은 파일을 전송할 때 GDPR(EU 개인정보보호규정) 용어와 중국의 '중요 데이터' 정의를 조정해야 합니다. 이러한 단편화는 커스텀 코딩의 노력을 증가시키고, 벤더 락인의 우려를 증가시키고, 구매 결정을 늦춥니다. 업계 얼라이언스는 오픈 스키마의 제안을 초안하고 있지만 채용에는 여전히 변동이 있습니다. 결과적으로 통합자는 순수한 소프트웨어 라이선스가 아닌 매핑 워크숍에서 큰 수익을 얻었습니다.
부문 분석
소프트웨어가 계속해서 가장 높은 수익을 올리고 2024년 데이터 분류 시장의 68.5%를 차지했습니다. 라이선스 판매의 핵심은 정책 엔진, 검색 크롤러, SaaS 대시보드입니다. 그래도 전문 서비스와 관리 서비스는 CAGR 23.9%를 나타낼 전망입니다. 기업이 오랜 분류의 부채를 해소하기 위한 지도가 필요하기 때문입니다. 대부분의 경우 계약은 몇 페타바이트의 스캔으로 시작되어 복구 백로그를 갖고 사내 리소스를 압박합니다. 관리형 서비스 제공업체는 구독 기반의 모델 재교육, 법규 업데이트, 티켓 거래에 대응하여 기술 부족을 보완합니다. 이러한 계약은 수년에 걸쳐있을 수 있으며 지출은 일시적인 자본 지출에서 경상적인 OPEX로 이동합니다. 이 접근법은 예측 가능한 예산과 감사 대응 가능한 증거를 추구하는 이사회에 공명합니다. 전략적 중요성을 반영하고 2030년까지 데이터 분류 시장 규모의 21억 5,000만 달러를 서비스가 차지할 수 있습니다. 따라서 소프트웨어 벤더는 혜택을 보장하기 위해 권고 능력을 프리미엄 계층에 번들로 제공합니다.
2세대 구현은 매년 건강 검사가 아니라 지속적인 튜닝에 의존합니다. 서비스 파트너는 DevSecOps 파이프라인을 구축하고 새 데이터가 오브젝트 스토리지에 들어갈 때마다 분류를 시작합니다. 또한 사업 부문간에 공유되는 분류법을 성문화함으로써 기업 인수 시 도입 일정을 단축할 수도 있습니다. 중견기업은 희귀 전문가를 고용하는 대신 전문 지식을 빌릴 수 있기 때문에 이러한 추세는 데이터 분류 시장을 확대합니다. 공급업체의 마켓플레이스에는 ISO 27001, HIPAA 또는 PCI 템플릿에 따른 서비스 번들이 게재되고, 채용의 민주화가 더욱 진행되고 있습니다. 서비스 수익이 가속화되면서 시스템 통합사업자는 전문 분야의 지식을 강화하고 점유율을 확보하기 위해 부티크형 컨설턴트를 인수합니다.
컨텐츠 기반 검사는 정규식과 핑거프린팅을 활용하여 지적재산에 신고함으로써 2024년 지출액의 43.2%를 차지했습니다. 그러나 ML이 주도하는 시맨틱 모델은 수백만 개의 레이블이 지정된 문서에서 컨텍스트를 학습하여 CAGR 22.8%의 성장을 보여줍니다. 문장 구조를 분석하는 변압기 네트워크와 같은 패턴 블라인드 기능은 예상률을 높이고 잘못된 경고를 줄입니다. Microsoft Purview는 세계 원격 측정을 기반으로 학습하고 고객 액션 없이 정기적으로 모델을 업데이트합니다. Digital Guardian은 컨텐츠 단서에 위치 정보 및 장치 자세와 같은 컨텍스트 신호를 겹쳐 위험 가중치를 부여한 태그를 제공합니다. 이러한 접근 방식을 결합하면 관리자는 비즈니스를 중단하지 않고도 새로운 엔진을 단계적으로 도입할 수 있습니다.
ML을 조기에 도입한 기업은 인적 판정이 필요한 항목이 줄어들기 때문에 검토자의 생산성이 35% 향상되었다고 보고하고 있습니다. 다국어 아카이브가 있는 조직은 시맨틱 모델이 수동 키워드 목록보다 언어 차이를 잘 처리할 수 있으므로 측정 가능한 이점을 얻을 수 있습니다. 공급업체는 고객별 온톨로지를 통합하기 위한 API를 공개하고 있으며, 새로운 개발 없이 맞춤형 정확성을 제공합니다. 이 변화는 이전에 엘리트 능력이었던 것을 SaaS의 체크 박스로 바꾸므로 데이터 분류 시장을 뒷받침합니다. 그럼에도 불구하고 틈새 분야에서는 학습 데이터가 여전히 병목이되고 있으며 상호 이익 협정 하에서 익명화 된 코퍼스를 공유하는 기업도 나오고 있습니다. 향후 예측에서 ML의 도입으로 Time-to-Value는 몇 분기에서 몇 주로 단축되어 ML이 기본 기법으로 정착될 것으로 예측됩니다.
지역 분석
북미는 2024년 매출의 41.0%를 차지해 선두를 유지했습니다. 엄격한 규제와 조기 AI 도입이 디스커버리 프로그램의 근대화를 기업에 촉구했기 때문입니다. 2025년 BigID의 6,000만 달러의 자금 조달 라운드는 SEC의 새로운 정보 공개 규칙에 앞서 데이터 하이 진을 자동화하는 솔루션에 대한 벤처의 의욕을 보여줍니다. 금융기관은 하루 종일 보고에 대응하기 위해 라벨링을 도입하고, 의료 제공자는 진화하는 HIPAA 확장을 준수하기 위해 전자 의료 기록에 태그를 통합합니다. 캐나다 각 주의 개인정보보호법은 연방정부의 요구사항을 반영하여 일관된 수요를 강화하고 있습니다. 멕시코의 하이테크 클러스터는 USMCA의 데이터 이전 조항을 충족하기 위해 클라우드 호스팅 플랫폼을 채택하고 있지만, 도입은 다국적 자회사에 집중되어 있습니다.
아시아태평양은 22.5%의 연평균 복합 성장률(CAGR)로 가장 급성장하고 있으며, 이는 주권 클라우드의 의무화와 하이퍼스케일러에 의한 다액의 인프라 지출을 반영하고 있습니다. AWS는 말레이시아에 60억 달러, NTT는 방콕 데이터센터에 9,000만 달러의 투자를 약속하고 정책 엔진 대기 시간을 단축하는 로컬 컴퓨팅을 구축했습니다. 중국은 아웃바운드 데이터 승인 완화를 제안하지만 여전히 많은 데이터 세트를 '중요'로 삼고 이중 관리를 강력하게 하고 있습니다. 일본과 한국은 기업 비밀 보호를 위해 5G 제조에 분류를 도입. 인도의 IT서비스 수출업체는 고객 데이터를 분리하기 위해 멀티테넌트 태그를 요청하고 클라우드 가입자의 대응 가능한 풀을 확장하고 있습니다.
유럽은 2025년까지 지속적인 제어 테스트를 의무화하는 디지털 오퍼레이션 탄력성법(Digital Operational Resilience Act)에 힘입어 금액 기준으로 2위를 차지했습니다. 독일 Industry 4.0 공장에서는 지적 재산을 보호하고 공급망 보안 감사를 준수하기 위해 비즈니스 데이터에 태그를 지정합니다. 영국은 브렉짓 후의 타당성과 국내 혁신 규칙의 균형을 맞추고 기업은 이중 정책 하에서 국경을 넘는 흐름을 감시하고 있습니다. 프랑스는 공공 부문 워크로드를 호스팅하는 소블린 클라우드 존을 추진하고 이탈리아는 중요한 인프라 보호를 강화합니다. GDPR(EU 개인정보보호규정)을 신속하게 도입한 북유럽 국가에서는 클리어 텍스트를 공개하지 않고 인라인 태그를 가능하게 하는 기밀 컴퓨팅 칩을 시험적으로 도입하고 있으며, 이 지역을 다음 파에의 혁신에 자리잡고 있습니다.
기타 혜택 :
- 엑셀 형식 시장 예측(ME) 시트
- 3개월간의 애널리스트 지원
목차
제1장 서론
- 조사 전제조건과 시장 정의
- 조사 범위
제2장 조사 방법
제3장 주요 요약
제4장 시장 상황
- 시장 개요
- 시장 성장 촉진요인
- 세계의 프라이버시 보호의 의무화 확대
- 비구조화 데이터의 폭발적 증가와 유출 위험
- 클라우드 네이티브 데이터 분류 수요
- AI/ML을 활용한 자동 분류가 대규모 생산 체제 돌입
- 인라인으로 태그를 지정할 수 있는 컨피덴셜 컴퓨팅 칩셋
- 세밀한 데이터 라벨링을 필요로 하는 GenAI 안전성
- 시장 성장 억제요인
- 업계 횡단적인 분류 기준의 부족
- 레거시 자산의 높은 통합 비용
- 합성 데이터의 보급에 의한 데이터의 잘못된 분류
- 호모모픽 암호화에 의한 클리어 텍스트 검사 지연
- 밸류체인 분석
- 규제 상황
- 기술적 전망
- Porter's Porter's Five Forces
- 공급기업의 협상력
- 소비자의 협상력
- 신규 참가업체의 위협
- 대체품의 위협
- 경쟁 기업 간 경쟁 관계의 강도
- 거시 경제 동향이 시장에 미치는 영향 평가
제5장 시장 규모와 성장 예측
- 구성 요소별
- 소프트웨어
- 서비스
- 분류 방법별
- 컨텐츠 기반
- 컨텍스트 기반
- 사용자/역할 기반
- 머신러닝 및 의미론적
- 조직 규모별
- 대기업
- 중소기업(SME)
- 용도별
- 접근 제어 및 IAM
- 거버넌스 및 컴플라이언스
- 이메일 및 모바일 보호
- 업계별
- BFSI
- 헬스케어 및 생명과학
- 정부 및 방위
- IT 및 텔레콤
- 에너지 및 유틸리티
- 기타 업계별
- 지역별
- 북미
- 미국
- 캐나다
- 멕시코
- 유럽
- 독일
- 영국
- 프랑스
- 이탈리아
- 스페인
- 기타 유럽
- 아시아태평양
- 중국
- 일본
- 인도
- 한국
- 호주
- 기타 아시아태평양
- 남미
- 브라질
- 아르헨티나
- 기타 남미
- 중동 및 아프리카
- 중동
- 사우디아라비아
- 아랍에미리트(UAE)
- 튀르키예
- 기타 중동
- 아프리카
- 남아프리카
- 이집트
- 나이지리아
- 기타 아프리카
- 북미
제6장 경쟁 구도
- 시장의 집중
- 전략적인 동향
- 시장 점유율 분석
- 기업 프로파일
- Amazon Web Services
- Microsoft Corporation
- IBM Corporation
- Broadcom(Symantec)
- Google LLC
- OpenText(TITUS)
- Thales Group
- Fortra(Boldon James)
- SECLORE
- Digital Guardian
- Forcepoint
- Varonis Systems
- BigID Inc.
- Concentric AI
- Netwrix Corporation
- Spirion LLC
- Immuta Inc.
- OneTrust LLC
- PKWARE Inc.
- Palo Alto Networks
제7장 시장 기회와 전망
KTH 25.11.05The data classification market size is currently generating USD 1.88 billion in 2025 and is forecast to reach USD 5.08 billion by 2030, translating into a 21.9% CAGR.
Rapid data growth, estimated at 328.77 million TB created every day, and tougher global privacy mandates are pushing enterprises to adopt real-time, AI-enabled data labeling that scales across hybrid cloud estates. AI-powered classification engines embedded in cloud-native architectures now detect sensitive information across unstructured repositories, while sovereign-cloud initiatives in Asia-Pacific propel regional demand. The rising threat landscape, where the average energy-sector breach cost hit USD 4.78 million in 2024, further underscores the urgency of automated governance. Investments by hyperscalers such as AWS and Microsoft in regional data centers add momentum by lowering latency and meeting residency rules.
Global Data Classification Market Trends and Insights
Expanding Global Privacy Mandates
European DORA rules and updated HIPAA standards shift compliance from scheduled audits to continuous verification, obliging firms to embed classification logic directly into data processing workflows. Multinational enterprises operating in multiple jurisdictions often apply the strictest global requirement as the baseline, which accelerates deployment of unified classification architectures. Financial institutions must meet anti-money-laundering reporting within minutes, increasing demand for policy-driven discovery. Similar pressure comes from Latin American data sovereignty statutes that align with GDPR. Together these mandates shorten procurement cycles, nudging even mid-sized firms toward SaaS-based tools that update policies automatically.
Explosive Growth of Unstructured Data and Breach Risk
Unstructured repositories grow 62% each year, leaving security teams blind to who holds sensitive records. Enterprises report excessive permissions on 82% of file shares, which exposes valuable designs and customer data. Energy utilities now see 1,100 weekly cyberattacks, and breach investigations show mis-classified documents as a root cause. Law practices suffer similar exposure because client files sit in shared drives without labels. AI-driven pattern recognition is increasingly chosen because static rule sets cannot keep pace with dynamic collaboration platforms.
Lack of Cross-Industry Taxonomy Standards
Financial regulators classify risk data differently from medical authorities, forcing vendors to maintain sector-specific rule libraries. Multinationals must reconcile GDPR terminology with China's definition of "important data" when transferring files. This fragmentation drives custom coding effort, increases vendor lock-in fears, and slows purchasing decisions. Industry alliances are drafting open schema proposals but adoption remains uneven. As a result, integrators earn sizeable revenue from mapping workshops rather than from pure software licenses.
Other drivers and restraints analyzed in the detailed report include:
- Cloud-Native Data Classification Demand
- AI/ML-Powered Auto-Classification Hitting Production at Scale
- High Integration Cost in Legacy Estates
For complete list of drivers and restraints, kindly check the Table Of Contents.
Segment Analysis
Software continued to generate the highest revenue, translating into 68.5% of the data classification market in 2024. License sales centered on policy engines, discovery crawlers, and SaaS dashboards. Even so, professional and managed services are scaling at a 23.9% CAGR because enterprises need guidance to clear long-standing classification debt. Engagements often begin with multi-petabyte scans that feed remediation backlogs and stretch internal resources. Managed service providers supplement skill shortages by handling model retraining, regulatory updates, and ticket triage on a subscription basis. These contracts can span several years, which shifts spending from one-time capital expense to recurring OPEX. The approach resonates with boards seeking predictable budgets and audit-ready evidence. In monetary terms, services could represent USD 2.15 billion of the data classification market size by 2030, reflecting their strategic importance. Software vendors are therefore bundling advisory capacity into premium tiers to protect margins.
Second-generation implementations rely on continuous tuning rather than annual health checks. Service partners build DevSecOps pipelines that trigger classification whenever new data lands in object storage. They also codify shared taxonomies across business units, which compresses onboarding timelines for acquisitions. The trend broadens the data classification market because mid-tier firms can rent expertise instead of hiring scarce specialists. Vendor marketplaces now list curated service bundles that align to ISO 27001, HIPAA, or PCI templates, further democratizing adoption. As services revenue accelerates, system integrators are acquiring boutique consultancies to strengthen domain knowledge and secure wallet share.
Content-based inspection held 43.2% of spending in 2024 by leveraging regex and fingerprinting to flag intellectual property. Yet ML-driven and semantic models are compounding at a 22.8% CAGR by learning context from millions of labeled documents. Pattern-blind capabilities, such as transformer networks that analyze sentence structure, lift recall rates and cut false alerts. Microsoft Purview trains on global telemetry, which fuels regular model refreshes without customer action. Digital Guardian layers contextual signals like location and device posture on top of content clues, enabling risk-weighted tagging. Combined approaches now ship as pre-configured bundles so administrators can phase in new engines without business disruption.
Early adopters report that ML lifts reviewer productivity by 35%, as fewer items require human adjudication. Organizations with multilingual archives gain measurable benefit because semantic models handle language variance better than manual keyword lists. Vendors are opening APIs to integrate customer-specific ontologies, bringing bespoke accuracy without ground-up development. The shift boosts the data classification market because it turns what was once an elite capability into a SaaS checkbox. Training data nevertheless remains a bottleneck for niche domains, prompting some firms to share anonymized corpora under mutual-benefit agreements. Over the forecast horizon, ML adoption is expected to reduce time-to-value from quarters to weeks, cementing its role as the default methodology.
The Data Classification Market Report is Segmented by Component (Software and Services), Classification Method (Content-Based, Context-Based, and More), Organization Size (Large Enterprises and Small and Medium Enterprises (SMEs)), Application (Access Control and IAM, Governance and Compliance, and More), Industry Vertical (BFSI, and More), and Geography. The Market Forecasts are Provided in Terms of Value (USD).
Geography Analysis
North America retained leadership with 41.0% of 2024 revenue because stringent regulations and early AI adoption pushed enterprises to modernize discovery programs. BigID's USD 60 million funding round in 2025 exemplifies venture appetite for solutions that automate data hygiene ahead of new SEC disclosure rules. Financial institutions deploy labeling to meet intraday reporting, while healthcare providers integrate tags into electronic medical records to comply with evolving HIPAA expansions. Canada's provincial privacy acts mirror federal requirements, reinforcing consistent demand. Mexico's tech clusters adopt cloud-hosted platforms to meet USMCA data-transfer clauses, though uptake concentrates in multinational subsidiaries.
Asia-Pacific is the fastest-growing region with a 22.5% CAGR, reflecting sovereign-cloud mandates and heavy infrastructure spending by hyperscalers. AWS pledged USD 6 billion to Malaysia and NTT committed USD 90 million to Bangkok data centers, creating local compute that reduces latency for policy engines. China proposes easing outbound data approval but still labels many datasets as "important," forcing dual controls. Japan and South Korea deploy classification in 5G manufacturing to protect trade secrets. India's IT-services exporters demand multi-tenant tagging to segregate client data, expanding the addressable pool of cloud subscribers.
Europe ranks a solid second by value, propelled by the Digital Operational Resilience Act that requires continuous control testing by 2025. Germany's Industry 4.0 plants tag operational data to safeguard intellectual property and comply with supply-chain security audits. The United Kingdom balances post-Brexit adequacy with domestic innovation rules, so firms monitor cross-border flows under dual policies. France promotes sovereign cloud zones to host public-sector workloads, while Italy tightens critical-infrastructure protections. Nordic countries, early GDPR adopters, now pilot confidential-computing chips that enable inline tagging without exposing clear text, positioning the region for next-wave innovation.
- Amazon Web Services
- Microsoft Corporation
- IBM Corporation
- Broadcom (Symantec)
- Google LLC
- OpenText (TITUS)
- Thales Group
- Fortra (Boldon James)
- SECLORE
- Digital Guardian
- Forcepoint
- Varonis Systems
- BigID Inc.
- Concentric AI
- Netwrix Corporation
- Spirion LLC
- Immuta Inc.
- OneTrust LLC
- PKWARE Inc.
- Palo Alto Networks
Additional Benefits:
- The market estimate (ME) sheet in Excel format
- 3 months of analyst support
TABLE OF CONTENTS
1 INTRODUCTION
- 1.1 Study Assumptions and Market Definition
- 1.2 Scope of the Study
2 RESEARCH METHODOLOGY
3 EXECUTIVE SUMMARY
4 MARKET LANDSCAPE
- 4.1 Market Overview
- 4.2 Market Drivers
- 4.2.1 Expanding global privacy mandates
- 4.2.2 Explosive growth of unstructured data and breach risk
- 4.2.3 Cloud-native data classification demand
- 4.2.4 AI/ML-powered auto-classification hitting production at scale
- 4.2.5 Confidential-computing chipsets enabling inline tagging
- 4.2.6 GenAI safety requiring fine-grained data labeling
- 4.3 Market Restraints
- 4.3.1 Lack of cross-industry taxonomy standards
- 4.3.2 High integration cost in legacy estates
- 4.3.3 "Classification debt" from synthetic data proliferation
- 4.3.4 Homomorphic encryption delaying clear-text inspection
- 4.4 Value Chain Analysis
- 4.5 Regulatory Landscape
- 4.6 Technological Outlook
- 4.7 Porter's Five Forces Analysis
- 4.7.1 Bargaining Power of Suppliers
- 4.7.2 Bargaining Power of Consumers
- 4.7.3 Threat of New Entrants
- 4.7.4 Threat of Substitute Products
- 4.7.5 Intensity of Competitive Rivalry
- 4.8 Assessment of the Impact of Macroeconomic Trends on the Market
5 MARKET SIZE AND GROWTH FORECASTS (VALUE)
- 5.1 By Component
- 5.1.1 Software
- 5.1.2 Services
- 5.2 By Classification Method
- 5.2.1 Content-based
- 5.2.2 Context-based
- 5.2.3 User-/Role-based
- 5.2.4 ML-driven and Semantic
- 5.3 By Organization Size
- 5.3.1 Large Enterprises
- 5.3.2 Small and Medium Enterprises (SMEs)
- 5.4 By Application
- 5.4.1 Access Control and IAM
- 5.4.2 Governance and Compliance
- 5.4.3 Email and Mobile Protection
- 5.5 By Industry Vertical
- 5.5.1 BFSI
- 5.5.2 Healthcare and Life Sciences
- 5.5.3 Government and Defence
- 5.5.4 IT and Telecom
- 5.5.5 Energy and Utilities
- 5.5.6 Other Industry Verticals
- 5.6 By Geography
- 5.6.1 North America
- 5.6.1.1 United States
- 5.6.1.2 Canada
- 5.6.1.3 Mexico
- 5.6.2 Europe
- 5.6.2.1 Germany
- 5.6.2.2 United Kingdom
- 5.6.2.3 France
- 5.6.2.4 Italy
- 5.6.2.5 Spain
- 5.6.2.6 Rest of Europe
- 5.6.3 Asia-Pacific
- 5.6.3.1 China
- 5.6.3.2 Japan
- 5.6.3.3 India
- 5.6.3.4 South Korea
- 5.6.3.5 Australia
- 5.6.3.6 Rest of Asia-Pacific
- 5.6.4 South America
- 5.6.4.1 Brazil
- 5.6.4.2 Argentina
- 5.6.4.3 Rest of South America
- 5.6.5 Middle East and Africa
- 5.6.5.1 Middle East
- 5.6.5.1.1 Saudi Arabia
- 5.6.5.1.2 United Arab Emirates
- 5.6.5.1.3 Turkey
- 5.6.5.1.4 Rest of Middle East
- 5.6.5.2 Africa
- 5.6.5.2.1 South Africa
- 5.6.5.2.2 Egypt
- 5.6.5.2.3 Nigeria
- 5.6.5.2.4 Rest of Africa
- 5.6.1 North America
6 COMPETITIVE LANDSCAPE
- 6.1 Market Concentration
- 6.2 Strategic Moves
- 6.3 Market Share Analysis
- 6.4 Company Profiles (includes Global level Overview, Market level overview, Core Segments, Financials as available, Strategic Information, Market Rank/Share for key companies, Products and Services, and Recent Developments)
- 6.4.1 Amazon Web Services
- 6.4.2 Microsoft Corporation
- 6.4.3 IBM Corporation
- 6.4.4 Broadcom (Symantec)
- 6.4.5 Google LLC
- 6.4.6 OpenText (TITUS)
- 6.4.7 Thales Group
- 6.4.8 Fortra (Boldon James)
- 6.4.9 SECLORE
- 6.4.10 Digital Guardian
- 6.4.11 Forcepoint
- 6.4.12 Varonis Systems
- 6.4.13 BigID Inc.
- 6.4.14 Concentric AI
- 6.4.15 Netwrix Corporation
- 6.4.16 Spirion LLC
- 6.4.17 Immuta Inc.
- 6.4.18 OneTrust LLC
- 6.4.19 PKWARE Inc.
- 6.4.20 Palo Alto Networks
7 MARKET OPPORTUNITIES AND FUTURE OUTLOOK
- 7.1 White-Space and Unmet-Need Assessment