|
시장보고서
상품코드
1850247
분류 시스템 : 시장 점유율 분석, 산업 동향, 통계, 성장 예측(2025-2030년)Sortation Systems - Market Share Analysis, Industry Trends & Statistics, Growth Forecasts (2025 - 2030) |
||||||
분류 시스템 시장은 2025년에 59억 6,000만 달러로 평가되었고, 2030년에는 CAGR은 5.31%를 나타낼 것으로 예측되며, 77억 2,000만 달러로 성장할 전망입니다.

중간 수준이지만 꾸준한 확장은 해당 분야가 신개념 자동화에서 핵심 인프라로 전환 중임을 보여줍니다. 크로스 벨트 장비 역시 가장 빠르게 성장하는 분류 플랫폼으로, 프리미엄 틈새 시장에서의 위상이 사실상 표준으로 자리매김했음을 입증합니다. 시장 지배적 지위와 가속화된 확장의 융합은 크로스 벨트 기술이 다양한 패키지 형태와 중량을 탁월하게 처리하는 능력에 힘입어 프리미엄 솔루션에서 산업 표준으로 진화하고 있음을 시사합니다. 전자상거래 및 옴니채널 사업자가 수요를 주도하며, 소포 자동화가 여전히 성장 잠재력이 크다는 점을 보여줍니다. 하드웨어가 여전히 매출의 대부분을 차지하지만, 소프트웨어 중심의 가치 창출로의 전환은 경쟁 차별화가 기계적 속도뿐만 아니라 알고리즘 효율성에 점점 더 의존한다는 업계 인식을 반영합니다. 지리적으로 아시아태평양(APAC) 지역이 2024년 최대 점유율을 기록할 전망이며, 이는 중국의 크로스보더 전자상거래와 다이후쿠의 2025년 공장 가동으로 대표되는 인도의 자동화 투자에 힘입은 결과입니다.
세계의 분류 시스템 시장 동향 및 인사이트
전자상거래 소포 급증
소포 물량 증가가 처리 능력 계획 수립을 재편하고 있습니다. 미국의 연간 소포 물량은 2028년까지 280억 개에 달할 것으로 예상되며, 이는 연간 5% 증가율에 해당합니다. 중국 국경 간 판매업체들은 디지털화를 가속화하고 생성형 AI를 활용해 수요 예측을 개선함으로써 시설이 반응형 피크 운영에서 예측형 부하 분산으로 전환할 수 있도록 합니다. 물량 급증에 자동 조정되고 실시간으로 경로 규칙을 변경하는 분류기가 이제 성수기 대응력을 뒷받침합니다.
인건비 상승과 인력 부족
창고 인건비 상승과 기술자 부족으로 도입 일정이 압박받고 있습니다. 운영사 63%가 숙련된 인력 부족을 최대 장애물로 꼽았으며, 2025년까지 77만 개의 공급망 기술자 공석이 발생할 전망입니다. 구매 기준은 이제 명목 처리량만큼 원격 진단 및 간소화된 유지보수를 중시합니다.
고액 설비투자와 ROI 불확실성
대형 분류기는 수백만 달러의 투자와 시설 개조가 필요합니다. 18-24개월 내 투자 회수를 요구하는 운영사들은 도입을 미루는 경우가 많으며, ROI를 연장할 수 있지만 장기적 효율성을 저해하는 모듈형 추가 장비를 선호합니다. 이탈률 감소 및 고객 충성도 향상과 같은 간접적 수익을 정량화하는 것은 여전히 어려운 과제입니다.
부문 분석
크로스 벨트 유닛은 2024년 매출의 38%를 차지했으며 연간 7.8% 성장할 전망으로, 분류 시스템 시장 내 가장 크고 빠른 성장 경로를 보일 분류기 유형입니다. 시설들은 속도 저하 없이 불규칙한 패키지를 처리하는 능력을 선호합니다. 틸트 트레이 및 슬라이딩 슈 장비는 깨지기 쉬운 상품이나 균일한 카톤이 주를 이루는 곳에서 여전히 관련성이 있습니다. 좁은 벨트 설치는 바닥 면적이 제한된 기존 건물에서 지속됩니다. 운영사들이 더 높은 유연성과 가동 시간을 추구함에 따라 팝업 휠 및 다이버터 시스템은 계속해서 퇴출되고 있습니다.
크로스 벨트 플랫폼의 분류 시스템 시장 규모는 2030년까지 30억 달러를 넘어설 것으로 예상되며, 이는 틈새 시장에서 주류 시장으로의 확고한 전환을 반영합니다. 한편, 슬라이딩 슈 제품은 중간 단일 자릿수 분류 시스템 시장 점유율을 유지하며, 부드러운 흐름 제어가 필요한 의류 및 소포 허브에 적합함을 유지함에 따라 낮은 단일 자릿수 성장을 보이고 있습니다.
전자상거래 및 옴니채널 소매업체는 2024년 매출의 41.2%를 차지했으며 연간 7.4% 증가하고 있습니다. 우편 및 소포 운영사는 여전히 두 번째로 큰 집단이지만, 마진 압박으로 인해 자동화가 성장 촉매제가 아닌 비용 절감 수단으로 전환되고 있습니다. 공항은 허브가 수하물 루프를 현대화함에 따라 안정적인 프로젝트 기반 기회를 제공합니다. 식품, 음료 및 제약 라인은 규정 준수를 위해 고정밀 분류를 도입하며, 센서가 탑재된 크로스 벨트 및 고속 트레이 장치의 채택을 촉진하고 있습니다.
2030년까지 전자상거래 부문은 분류 시스템 시장 규모에서 30억 달러 이상을 차지할 것으로 예상됩니다. 공항 프로그램은 불규칙적이지만, 여객 및 화물 투자가 결합되면서 중간 단일 자릿수 CAGR을 달성할 수 있습니다.
세계의 분류 시스템 시장은 분류기 유형별(크로스 벨트 분류기, 틸트 트레이 분류기, 슬라이딩 슈 분류기 등), 최종 사용자 산업별(우편 및 소포, 전자상거래 및 옴니채널 소매, 공항 등), 제공 서비스별(하드웨어, 소프트웨어), 처리량 속도별(저속, 중속 등), 지역별로 분류되어 있습니다. 시장 예측은 금액(달러)으로 제공됩니다.
지역별 분석
아시아태평양(APAC) 지역은 2024년 시장 점유율 36.5%로 분류 시스템을 주도하며 8.6%의 연평균 복합 성장률(CAGR)로 확장 중입니다. 중국 물류 부문은 인공지능(AI)을 활용해 수거 효율 30%, 배송 효율 35%를 향상시켜 지능형 분류기 도입을 더욱 촉진하고 있습니다. 다이후쿠의 2025년 생산 단지 설립은 생산 현지화와 리드타임 단축을 목표로 하는 인도의 자동화 추진을 보여줍니다. 동남아시아 전자상거래 성장 역시 도시형 소형 물류 센터의 유연한 분류 시스템에 투자를 유도하고 있습니다.
북미는 공항 수하물 시스템 재구축 및 소포 센터 지속적 업그레이드로 핵심 수익 기둥을 유지합니다. 초기 시설 다수가 이미 자동화되어 지출이 개조, 소프트웨어, 지속가능성 업그레이드 중심으로 전환되면서 성장률은 4% 중반으로 완화됩니다. 유럽은 친환경 의무와 성능 사이에서 균형을 맞춘다. 운영사들은 EU 순환경제 목표에 부합하기 위해 에너지 효율형 모터와 재활용 벨트 소재를 선호합니다.
중동 및 아프리카 지역은 걸프 공항의 허브 역량 투자와 아프리카 전자상거래의 기존 소매업 도약으로 초기 단계이지만 수요가 증가하고 있습니다. 남미는 택배 물량과 노동력 인플레이션이 자본 지출을 정당화하는 대도시 회랑에서 선택적으로 도입되고 있습니다. 브라질과 칠레 정책 입안자들은 수출 지향적 물류 단지 내 분류기 도입을 간접적으로 지원하기 위해 통관 절차 간소화 의사를 표명했습니다.
기타 혜택 :
- 엑셀 형식 시장 예측(ME) 시트
- 3개월간의 애널리스트 지원
목차
제1장 서론
- 조사의 전제조건과 시장의 정의
- 조사 범위
제2장 조사 방법
제3장 주요 요약
제4장 시장 상황
- 시장 개요
- 시장 성장 촉진요인
- 전자상거래 소포의 급증
- 인건비 상승 및 인력 부족
- SKU 증가에 의해 정밀도가 요구
- 공항 수하물 취급 업그레이드
- AI 비전 기반 동적 분류기
- 지속가능성을 중시한 에너지 절약
- 시장 성장 억제요인
- 고액의 설비투자와 ROI의 불확실성
- 숙련 기술자의 부족
- 소프트웨어 계층 상호운용성 격차
- 도시 소음 규제 준수 한계
- 가치/공급망 분석
- 규제 상황
- 기술의 전망
- Porter's Five Forces
- 공급기업의 협상력
- 구매자의 협상력
- 신규 참가업체의 위협
- 대체품의 위협
- 경쟁 기업간 경쟁 관계
제5장 시장 규모와 성장 예측
- 분류기 유형별
- 크로스 벨트 분류기
- 틸트 트레이 분류기
- 슬라이딩 슈 분류기
- 좁은 벨트 분류기
- 푸시 트레이/분할 트레이 분류기
- 팝업 휠 & 다이버터 분류기
- 최종 사용자 업계별
- 우편 및 소포 배달업자
- 전자상거래 및 옴니채널 소매
- 공항(수하물 취급)
- 식품 및 음료
- 의약품 및 헬스케어
- 3PL 및 계약 물류
- 자동차 및 산업 제조
- 제공별
- 하드웨어
- 소프트웨어
- 서비스(설치, MRO)
- 스루풋 레이트별
- 저속(3k 미만)
- 중속(3-10k)
- 고속(10-25k)
- 초고속(25k 초과)
- 지역별
- 북미
- 미국
- 캐나다
- 멕시코
- 남미
- 브라질
- 아르헨티나
- 기타 남미
- 유럽
- 독일
- 영국
- 프랑스
- 이탈리아
- 스페인
- 네덜란드
- 기타 유럽
- 아시아태평양
- 중국
- 일본
- 인도
- 한국
- 호주 & 뉴질랜드
- 동남아시아
- 기타 아시아태평양
- 중동 및 아프리카
- GCC(구 사우디아라비아)
- 사우디아라비아
- 튀르키예
- 남아프리카
- 이스라엘
- 기타 중동 및 아프리카
- 북미
제6장 경쟁 구도
- 시장 집중도
- 전략적 동향
- 시장 점유율 분석
- 기업 프로파일
- Daifuku Co., Ltd.
- Vanderlande Industries
- Honeywell Intelligrated
- Siemens Logistics
- Beumer Group GmbH
- Interroll Holding AG
- Dematic Corporation(KION Group)
- Murata Machinery Ltd.
- KNAPP AG
- Bastian Solutions
- Viastore Systems Gmbh
- SSI Schaefer
- TGW Logistics
- Fives Intralogistics
- BOWE SYSTEC
- Pitney Bowes
- Equinox MHE
- Falcon Autotech
- GBI Intralogistics
- OPEX Corporation
- Okura Yusoki
- Zebra Technologies(Fetch Robotics)
제7장 시장 기회와 장래의 전망
HBR 25.11.19The sortation systems market reached USD 5.96 billion in 2025 and is projected to advance to USD 7.72 billion by 2030 at a 5.31% CAGR.
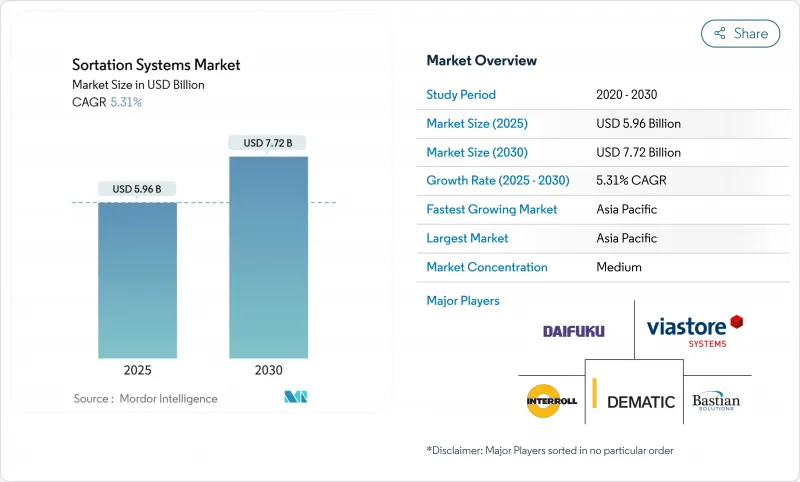
Moderate but steady expansion shows the field is transitioning from novel automation toward core infrastructure. Cross-belt equipment is also the fastest-expanding sorter platform, confirming a shift from premium niche toward de-facto standard. The convergence of dominant position and accelerated expansion signals cross-belt technology's evolution from premium solution to industry standard, driven by its superior handling of diverse package geometries and weights. E-commerce and omnichannel operators dominate demand, illustrating that parcel automation remains in a long runway. Hardware continues to account for majority of sales, yet the shift toward software-centric value creation reflects industry recognition that competitive differentiation increasingly depends on algorithmic efficiency rather than mechanical speed alone. Geographically, APAC leads highest share in 2024, fuelled by Chinese cross-border e-commerce and Indian automation investments exemplified by Daifuku's 2025 plant launch
Global Sortation Systems Market Trends and Insights
E-commerce parcel surge
Parcel growth reshapes capacity planning. United States annual parcel flow is forecast to hit 28 billion by 2028, a 5% yearly increase. Chinese cross-border sellers accelerate digitalisation and employ generative AI to improve demand forecasting, allowing facilities to move from reactive peaks to predictive load balancing.Sorters that self-adjust to volume spikes and shift routing rules on the fly now underpin peak-season resilience.
Labor-cost escalation & scarcity
Warehouse payroll inflation and technician shortages compress deployment timelines. A 63% majority of operators cite skilled labour gaps as the top obstacle, while 770,000 supply-chain technician vacancies are expected by mid-decade. Procurement criteria now weigh remote diagnostics and simplified maintenance as heavily as nominal throughput.
High capex & ROI uncertainty
Full-scale sorters require multimillion-dollar outlays plus facility remodelling. Operators demanding 18-24-month payback often delay adoption, favouring modular add-ons that can stretch ROI but impair long-term efficiency. Quantifying soft returns such as reduced churn and customer loyalty remains challenging.
Other drivers and restraints analyzed in the detailed report include:
- SKU proliferation demands accuracy
- Airport baggage-handling upgrades
- AI-vision powered dynamic sorters
- Sustainability-driven energy savings
- Skilled-technician shortage
For complete list of drivers and restraints, kindly check the Table Of Contents.
Segment Analysis
Cross-belt units generated 38% revenue in 2024 and are set to rise 7.8% annually, giving the sorter class the largest and fastest path within the sortation systems market. Facilities prefer its capability to handle irregular packages without speed loss. Tilt-tray and sliding-shoe equipment stay relevant where either fragile goods or uniform cartons dominate. Narrow-belt installations persist in legacy buildings with limited floor plates. Pop-up wheel and diverter systems continue to fade as operators pursue higher flexibility and uptime.
The sortation systems market size for cross-belt platforms is projected to exceed USD 3 billion by 2030, reflecting entrenched migration from niche to mainstream. Meanwhile, sliding-shoe products hold a mid-single-digit sortation systems market share and show low-single-digit expansion as they retain fit in apparel and parcel hubs demanding gentle flow control.
E-commerce and omnichannel retailers captured 41.2% of 2024 turnover and are increasing 7.4% annually. Post-and-parcel operators remain the second-largest cohort, yet margin pressure converts automation into a cost-containment lever rather than growth catalyst. Airports contribute stable, project-based opportunities as hubs modernise baggage loops. Food, beverage and pharma lines embrace high-accuracy sorting to honour compliance, fuelling adoption of sensor-laden cross-belt and high-speed tray units.
By 2030, the e-commerce segment is expected to command more than USD 3 billion of the sortation systems market size. Airport programmes, though lumpy, could achieve mid-single-digit CAGR on the back of combined passenger and cargo investments.
Global Sortation System Market is Segmented by Sorter Type (Cross-Belt Sorters, Tilt-Tray Sorters, Sliding-Shoe Sorters, and More), by End-User Industry (Post and Parcel, E-Commerce and Omnichannel Retail, Airport, and More), by Offering (Hardware, and Software), by Throughput Rate (Low-Speed, Medium-Speed, and More), and by Geography. The Market Forecasts are Provided in Terms of Value (USD).
Geography Analysis
APAC dominated the sortation systems market with 36.5% 2024 share and is expanding at 8.6% CAGR. China's logistics sector uses AI to lift collection efficiency 30% and delivery 35%, spurring further adoption of intelligent sorters. India's automation drive is illustrated by Daifuku's 2025 manufacturing complex designed to localise production and lower lead times. Southeast Asian e-commerce growth also channels investment into flexible sorting in urban micro-fulfilment nodes.
North America remains a core revenue pillar through airport baggage rebuilds and ongoing parcel-centre upgrades. Growth moderates to a mid-4% rate as many first-wave facilities are already automated, causing spend to pivot towards retrofits, software, and sustainability upgrades. Europe balances green mandates with performance. Operators favour energy-efficient motors and recyclable belt materials to align with EU circularity targets.
Middle East and Africa present nascent but rising demand as Gulf airports invest in hub capability and African e-commerce leapfrogs conventional retail. South America exhibits selective uptake in metropolitan corridors where parcel volumes and labour inflation justify capital outlays. Policymakers in Brazil and Chile have signalled intent to streamline customs processes, indirectly supporting sorter adoption in export-oriented logistics parks.
- Daifuku Co., Ltd.
- Vanderlande Industries
- Honeywell Intelligrated
- Siemens Logistics
- Beumer Group GmbH
- Interroll Holding AG
- Dematic Corporation (KION Group)
- Murata Machinery Ltd.
- KNAPP AG
- Bastian Solutions
- Viastore Systems Gmbh
- SSI Schaefer
- TGW Logistics
- Fives Intralogistics
- BOWE SYSTEC
- Pitney Bowes
- Equinox MHE
- Falcon Autotech
- GBI Intralogistics
- OPEX Corporation
- Okura Yusoki
- Zebra Technologies (Fetch Robotics)
Additional Benefits:
- The market estimate (ME) sheet in Excel format
- 3 months of analyst support
TABLE OF CONTENTS
1 INTRODUCTION
- 1.1 Study Assumptions and Market Definition
- 1.2 Scope of the Study
2 RESEARCH METHODOLOGY
3 EXECUTIVE SUMMARY
4 MARKET LANDSCAPE
- 4.1 Market Overview
- 4.2 Market Drivers
- 4.2.1 E-commerce parcel surge
- 4.2.2 Labor-cost escalation & scarcity
- 4.2.3 SKU proliferation demands accuracy
- 4.2.4 Airport baggage-handling upgrades
- 4.2.5 AI-vision powered dynamic sorters
- 4.2.6 Sustainability-driven energy savings
- 4.3 Market Restraints
- 4.3.1 High capex & ROI uncertainty
- 4.3.2 Skilled-technician shortage
- 4.3.3 Software-layer interoperability gaps
- 4.3.4 Urban-noise compliance limits
- 4.4 Value / Supply-Chain Analysis
- 4.5 Regulatory Landscape
- 4.6 Technological Outlook
- 4.7 Porter's Five Forces
- 4.7.1 Bargaining Power of Suppliers
- 4.7.2 Bargaining Power of Buyers
- 4.7.3 Threat of New Entrants
- 4.7.4 Threat of Substitutes
- 4.7.5 Competitive Rivalry
5 MARKET SIZE AND GROWTH FORECASTS (VALUE)
- 5.1 By Sorter Type
- 5.1.1 Cross-belt Sorters
- 5.1.2 Tilt-tray Sorters
- 5.1.3 Sliding-shoe Sorters
- 5.1.4 Narrow-belt Sorters
- 5.1.5 Push-tray / Split-tray Sorters
- 5.1.6 Pop-up Wheel & Diverter Sorters
- 5.2 By End-user Industry
- 5.2.1 Post & Parcel Operators
- 5.2.2 E-commerce & Omnichannel Retail
- 5.2.3 Airports (Baggage Handling)
- 5.2.4 Food & Beverages
- 5.2.5 Pharmaceuticals & Healthcare
- 5.2.6 3PL & Contract Logistics
- 5.2.7 Automotive & Industrial Manufacturing
- 5.3 By Offering
- 5.3.1 Hardware
- 5.3.2 Software
- 5.3.3 Services (Installation, MRO)
- 5.4 By Throughput Rate
- 5.4.1 Low-speed (<3k)
- 5.4.2 Medium-speed (3k-10k)
- 5.4.3 High-speed (10k-25k)
- 5.4.4 Ultra High-speed (>25k)
- 5.5 By Geography
- 5.5.1 North America
- 5.5.1.1 United States
- 5.5.1.2 Canada
- 5.5.1.3 Mexico
- 5.5.2 South America
- 5.5.2.1 Brazil
- 5.5.2.2 Argentina
- 5.5.2.3 Rest of South America
- 5.5.3 Europe
- 5.5.3.1 Germany
- 5.5.3.2 United Kingdom
- 5.5.3.3 France
- 5.5.3.4 Italy
- 5.5.3.5 Spain
- 5.5.3.6 Netherlands
- 5.5.3.7 Rest of Europe
- 5.5.4 APAC
- 5.5.4.1 China
- 5.5.4.2 Japan
- 5.5.4.3 India
- 5.5.4.4 South Korea
- 5.5.4.5 Australia & New Zealand
- 5.5.4.6 Southeast Asia
- 5.5.4.7 Rest of APAC
- 5.5.5 Middle East & Africa
- 5.5.5.1 GCC (ex-Saudi)
- 5.5.5.2 Saudi Arabia
- 5.5.5.3 Turkey
- 5.5.5.4 South Africa
- 5.5.5.5 Israel
- 5.5.5.6 Rest of Middle East & Africa
- 5.5.1 North America
6 COMPETITIVE LANDSCAPE
- 6.1 Market Concentration
- 6.2 Strategic Moves
- 6.3 Market Share Analysis
- 6.4 Company Profiles (includes Global level Overview, Market level overview, Core Segments, Financials as available, Strategic Information, Market Rank/Share, Products & Services, Recent Developments)
- 6.4.1 Daifuku Co., Ltd.
- 6.4.2 Vanderlande Industries
- 6.4.3 Honeywell Intelligrated
- 6.4.4 Siemens Logistics
- 6.4.5 Beumer Group GmbH
- 6.4.6 Interroll Holding AG
- 6.4.7 Dematic Corporation (KION Group)
- 6.4.8 Murata Machinery Ltd.
- 6.4.9 KNAPP AG
- 6.4.10 Bastian Solutions
- 6.4.11 Viastore Systems Gmbh
- 6.4.12 SSI Schaefer
- 6.4.13 TGW Logistics
- 6.4.14 Fives Intralogistics
- 6.4.15 BOWE SYSTEC
- 6.4.16 Pitney Bowes
- 6.4.17 Equinox MHE
- 6.4.18 Falcon Autotech
- 6.4.19 GBI Intralogistics
- 6.4.20 OPEX Corporation
- 6.4.21 Okura Yusoki
- 6.4.22 Zebra Technologies (Fetch Robotics)
7 MARKET OPPORTUNITIES AND FUTURE OUTLOOK
- 7.1 White-space & Unmet-need Assessment