
|
시장보고서
상품코드
1851027
서비스형 네트워크 시장 : 점유율 분석, 산업 동향, 통계, 성장 예측(2025-2030년)Network As A Service - Market Share Analysis, Industry Trends & Statistics, Growth Forecasts (2025 - 2030) |
||||||
서비스형 네트워크 시장 규모는 2025년에 332억 2,000만 달러, 2030년에는 1,153억 6,000만 달러에 이르고, 예측 기간 중 CAGR은 28.3%를 나타낼 전망입니다.

이 확장은 자본 집약적인 하드웨어 소유에서 운영 예산과 민첩성 요구를 일치시키는 소비 기반 서비스 모델로의 기업의 결정적인 변화를 반영합니다. 클라우드 퍼스트의 혁신 로드맵, SD-WAN 및 SASE의 급속한 배포, 평균 복구 시간을 5분 미만으로 단축하는 AI 주도 네트워크 보증 엔진으로 강력한 기세가 탄생했습니다. 북미는 견고한 기업의 디지털화와 성숙한 매니지드 서비스 에코시스템에 의해 우위성을 유지하고 있으며, 아시아태평양은 대규모 근대화 프로그램과 엄격한 데이터 주권 의무에 힘입어 급성장을 이루고 있습니다. 레거시 장비 공급업체가 서비스 포트폴리오를 중심으로 재배치하고 통신 캐리어가 사설 5G 슬라이싱을 수익화함에 따라 경쟁이 치열해지고 있습니다. 동시에 데이터 레지던시 규제, 벤더 인클로저 우려, IFRS 16호/ASC 842호의 복잡한 회계 처리 등이 단기적인 채택 전망을 약화시키고 있습니다.
세계 서비스형 네트워크 시장 동향과 통찰
기업의 '클라우드 퍼스트' 네트워크 변혁 로드맵
기업이 레거시 하드웨어를 폐지하고 인텐트 기반 자동화 및 통합 보안을 실현하는 클라우드 네이티브 소프트웨어 정의 플랫폼을 채택함으로써 현대화 프로그램은 인프라 소비를 재정의하고 있습니다. 시스코에 따르면 기술 담당 임원의 91%는 AI와 IoT 워크로드를 지원하기 위해 네트워킹 예산을 늘리고 통합 NaaS 프레임워크가 신속한 혁신을 실현하기 위한 바람직한 길로 부상하고 있습니다. 단일 운영 모델 하에서 연결성, 보안, 가관측성을 긴밀하게 결합함으로써 신속한 프로비저닝, 다운타임 단축, 멀티클라우드 에스테이트 간의 일관된 정책 적용이 가능합니다. 그 결과 네트워킹을 감가상각하는 자산이 아니라 탄력적인 유틸리티로 바꾸면 민첩성이 서비스로서 네트워크 시장을 강화하게 됩니다.
구독 예산으로 CapEx에서 OpEx로 전환
IFRS 16호와 회계기준 편찬서 842호를 통해 기업은 대차대조표에서 임대를 인식해야 하며 기존 하드웨어 조달의 경제성이 복잡해집니다. 소비 기반 네트워킹은 기업이 대규모 자본 배분을 피하고, 현금 흐름 프로파일을 평준화하고, 갱신 주기를 단축하는 데 도움이 되며, CFO가 주도하는 혁신 이니셔티브의 도입을 촉진합니다. 또한 매월 지출을 예측할 수 있기 때문에 기술 수명주기가 가속화되면 재무 위험이 줄어들고 구독 모델은 중견 시장 채택 기업에게 특히 매력적입니다.
근본적인 데이터 주권과 거주 규정 준수 장벽
유럽 데이터 법과 중국의 사이버 보안 법과 같은 지역적 의무화는 현지에서의 처리를 요구하며 국경을 넘는 이전 제한을 부과하고 있습니다. 이러한 틀은 세계 서비스의 통합을 복잡하게 하고, 공급자는 단편적인 실적의 전개를 강요하기 때문에 스케일 메리트가 희박해져, 조달 사이클이 길어져, 규제 분야에서의 서비스형 네트워크 시장의 성장이 둔화됩니다.
부문 분석
WAN-as-a-Service의 서비스형 네트워크 시장 규모는 2024년에 151억 달러에 달했고, 매출의 45.5%를 차지했습니다. 엔터프라이즈는 하이브리드 워크 및 클라우드 배포를 지원하는 탄력적인 용도 지원 연결을 선호합니다. 한편, Campus-Switch-as-a-Service는 2030년까지 연평균 복합 성장률(CAGR) 29.8%로 확대될 것으로 예측되고 있으며, 이는 고급 전력 관리와 RF 최적화를 필요로 하는 Wi-Fi 7의 배포를 뒷받침하고 있습니다.
공급업체는 스위칭, 액세스 포인트 및 보증 소프트웨어를 구독 계약에 번들하여 중형 캠퍼스에서 조달 장애물을 낮추고 있습니다. 향후 LAN-as-a-Service와 데이터센터 상호 연결 서비스는 캠퍼스, WAN 및 클라우드 패브릭을 통합 계약함으로써 점유율을 확대할 것으로 예측됩니다. 단일 플랫폼 운영의 추진으로 서비스 유형의 다양화가 서비스형 네트워크 시장 확대의 최전선에 위치할 것으로 보입니다.
가상 CPE는 2024년 42.8%의 점유율을 차지했습니다. 이는 기업이 하드웨어 라우터를 화이트 박스 장비에 호스팅되는 소프트웨어 이미지로 대체하기 때문입니다. 연결성과 위협 방어를 융합시킨 SASE 프레임워크에 대한 신뢰의 높아짐을 반영해, 통합 네트워크 서비스형 보안은 CAGR 29.3%로 가장 강한 궤적을 보입니다.
대역폭 온디맨드와 관리형 VPN은 계절적인 워크로드에 대응하는 동적인 용량 확장과 저대역폭 사이트에의 안전한 접속을 가능하게 하는 보완적인 존재로 남아있습니다. 2030년까지는 통합 보안이 가상 CPE를 추월할 것으로 예측됩니다. 이 동향은 서비스형 네트워크 시장 규모의 꾸준한 확대를 지원하고 있으며, 컴플라이언스, DDoS 방어, 관측 가능성을 단일 SLA에 통합한 다기능 서비스 계층에의 지출을 촉진하고 있습니다.
지역 분석
세련된 클라우드 에코시스템, SASE의 조기 도입, 기존 벤더 내의 기능을 통합하는 활발한 정세를 반영해 2024년에는 북미가 35.4%의 점유율을 차지합니다. HPE가 계획하고 있는 주니퍼 네트웍스의 140억 달러 규모 인수는 네트워킹의 수익 공헌을 두 배로 늘리기 위해 시스코의 우위에 도전하는 플랫폼 플레이를 시사합니다. 연방 및 주 데이터 프라이버시 규칙은 사내에 컴플라이언스 리소스가 없는 기업이 관리 서비스를 도입하는 데 더욱 박차를 가합니다.
아시아태평양은 2030년까지 연평균 복합 성장률(CAGR)이 28.9%에 달할 전망입니다. 이는 각국 정부가 디지털 인프라 구축에 자금을 제공하고, 통신사업자가 산업 캠퍼스용으로 프라이빗 5G 슬라이싱을 상용화하기 때문입니다. 중국의 데이터 현지화 의무화는 주권 클라우드의 NaaS 모델을 촉진하고 인도의 생산 연동 인센티브 프로그램은 공장의 디지털화를 자극하고 이 지역 수요를 뒷받침하고 있습니다.
유럽에서는 엄격한 규제에도 불구하고 여전히 비즈니스 기회가 풍부합니다. 오는 디지털 운영 탄력성 법(Digital Operational Resilience Act)은 은행과 보험 회사를 감사 대응 보고서를 통합 한 관리 연결성으로 향하게합니다. 서비스 제공업체는 GDPR(EU 개인정보보호규정), 데이터 액트 이식성 및 새로운 사이버 탄력성 벤치마크를 충족하도록 서비스를 조정하고 꾸준한 보급을 촉진하고 있습니다. 라틴아메리카, 중동 및 아프리카는 아직 시작되었지만 클라우드 서비스의 가용성이 높아지고 에너지 가격 변동이 예측 가능한 OpEx 소비 모델에 대한 수요를 증가시키면서 주목을 받고 있습니다.
기타 혜택 :
- 엑셀 형식 시장 예측(ME) 시트
- 3개월간의 애널리스트 서포트
목차
제1장 서론
- 조사의 전제조건과 시장의 정의
- 조사 범위
제2장 조사 방법
제3장 주요 요약
제4장 시장 상황
- 시장 개요
- 시장 성장 촉진요인
- 기업의 '클라우드 퍼스트' 네트워크 변혁 로드맵
- CapEx에서 OpEx로 구독 예산 편성 이동
- 매니지드 WAN의 쇄신을 가속하는 SD-WAN과 SASE의 융합
- Wi-Fi 7의 전력 스파이크에 대항하는 캠퍼스 LAN의 NaaS 수요
- AI에 의한 네트워크 보증으로 MTTR을 5분 이하로 단축
- CSP가 "as-a-service"에서 판매하는 사설 5G 네트워크 슬라이싱
- 시장 성장 억제요인
- 지속적인 데이터 주권 및 거주 규정 준수 장벽
- 독자적인 라이프사이클 플랫폼을 둘러싼 벤더 락인의 우려
- IFRS 제16호/ASC 제842호의 복잡한 리스 회계 규칙
- NaaS의 TCO에 영향을 주는 엣지 사이트의 전력 비용 변동
- 밸류체인 분석
- 규제 상황
- 기술의 전망
- Porter's Five Forces 분석
- 공급기업의 협상력
- 구매자의 협상력
- 신규 참가업체의 위협
- 대체품의 위협
- 경쟁 기업간 경쟁 관계
- 거시 경제 동향이 시장에 미치는 영향 평가
제5장 시장 규모와 성장 예측
- 유형별
- 서비스형 LAN
- 서비스형 WAN
- 서비스형 캠퍼스 전환
- 서비스형 데이터 센터
- 용도별
- 가상 CPE(vCPE)
- 온디맨드 대역폭(BoD)
- 서비스형 네트워크 보안 통합
- 가상 사설망(VPN)
- 기업 규모별
- 대기업
- 중소기업(SME)
- 업계별
- IT 및 텔레콤
- BFSI
- 헬스케어
- 제조업
- 소매 및 전자상거래
- 기타 업계별
- 지역별
- 북미
- 미국
- 캐나다
- 멕시코
- 유럽
- 독일
- 영국
- 프랑스
- 이탈리아
- 스페인
- 기타 유럽
- 아시아태평양
- 중국
- 일본
- 인도
- 한국
- 호주
- 기타 아시아태평양
- 남미
- 브라질
- 아르헨티나
- 기타 남미
- 중동 및 아프리카
- 중동
- 사우디아라비아
- 아랍에미리트(UAE)
- 튀르키예
- 기타 중동
- 아프리카
- 남아프리카
- 이집트
- 나이지리아
- 기타 아프리카
- 북미
제6장 경쟁 구도
- 시장 집중도
- 전략적 동향
- 시장 점유율 분석
- 기업 프로파일
- Cisco Systems Inc.
- Hewlett Packard Enterprise(Aruba/GreenLake)
- ATandT Inc.
- Verizon Communications Inc.
- IBM Corp.
- DXC Technology
- TD SYNNEX(Avnet)
- NEC Corp.
- Oracle Corp.
- GTT Communications
- VMware(Broadcom)
- Telstra Group
- Lumen Technologies
- Cato Networks
- Aryaka Networks
- Juniper Networks
- Nokia(Alcatel-Lucent Enterprise)
- Akamai Technologies
- Masergy(Comcast Business)
- Proofpoint/Meta Networks
- Extreme Networks
- Fortinet Inc.
제7장 시장 기회와 장래의 전망
SHW 25.11.11The Network as a Service market size is valued at USD 33.22 billion in 2025 and is forecast to reach USD 115.36 billion in 2030, registering a 28.3% CAGR over the period.
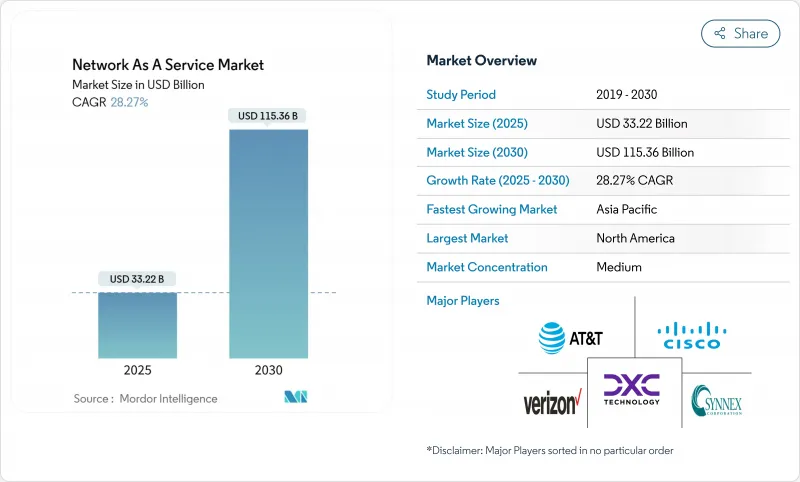
This expansion reflects a decisive enterprise shift from capital-intensive hardware ownership toward consumption-based service models that align operating budgets with agility needs. Strong momentum comes from cloud-first transformation roadmaps, rapid SD-WAN and SASE rollouts, and AI-driven network-assurance engines that cut mean time to repair to under five minutes. North America retains primacy through robust enterprise digitalization and a mature managed-services ecosystem, while Asia-Pacific posts the fastest growth, supported by large-scale modernization programs and strict data-sovereignty mandates. Competitive intensity is rising as legacy equipment vendors reposition around service portfolios and telecom carriers monetize private-5G slicing. At the same time, data-residency rules, vendor-lock-in anxieties, and IFRS 16/ASC 842 accounting complexity temper near-term adoption prospects.
Global Network As A Service Market Trends and Insights
Enterprises' "cloud-first" network-transformation roadmaps
Modernization programs are redefining infrastructure consumption as organizations retire legacy hardware in favor of cloud-native, software-defined platforms that deliver intent-based automation and integrated security. Cisco notes that 91% of technology executives have boosted networking budgets to underpin AI and IoT workloads, with unified NaaS frameworks emerging as the preferred path to rapid innovation. Tight coupling of connectivity, security, and observability under a single operational model enables quicker provisioning, lower downtime, and consistent policy enforcement across multi-cloud estates. The resulting agility strengthens the Network as a Service market by turning networking into an elastic utility rather than a depreciating asset.
Shift from CapEx to OpEx subscription budgeting pressure
IFRS 16 and ASC 842 compel enterprises to recognize leases on balance sheets, complicating traditional hardware-procurement economics. Consumption-based networking helps firms sidestep large capital allocations, smooth cash-flow profiles, and shorten refresh cycles, driving uptake among CFO-led transformation initiatives. Predictable monthly spend also reduces financial risk when technology lifecycles accelerate, making subscription models especially attractive for mid-market adopters.
Persistent data-sovereignty and residency compliance barriers
Regional mandates such as the European Data Act and China's cybersecurity law require local processing and impose cross-border transfer restrictions. These frameworks complicate global service uniformity, forcing providers to deploy fragmented footprints that dilute economies of scale and extend procurement cycles, thereby slowing the Network as a Service market in regulated sectors.
Other drivers and restraints analyzed in the detailed report include:
- SD-WAN and SASE convergence accelerating managed WAN refresh
- Campus-LAN NaaS demand to counter Wi-Fi 7 power spikes
- Vendor lock-in fears around proprietary lifecycle platforms
For complete list of drivers and restraints, kindly check the Table Of Contents.
Segment Analysis
The Network as a Service market size for WAN-as-a-Service reached USD 15.10 billion in 2024 and accounted for 45.5% of revenue. Enterprises prioritize resilient, application-aware connectivity that supports hybrid work and cloud adoption. Campus-Switch-as-a-Service, however, is forecast to expand at 29.8% CAGR to 2030, propelled by Wi-Fi 7 rollouts that demand sophisticated power-management and RF optimization.
Vendors bundle switching, access points, and assurance software into subscription contracts, flattening the procurement barrier for mid-sized campuses. Over the forecast horizon, LAN-as-a-Service and data-center interconnect offerings are expected to gain share as organizations converge campus, WAN, and cloud fabrics under unified contracts. The push toward single-platform operations will keep service-type diversification at the forefront of Network as a Service market expansion.
Virtual CPE held 42.8% share in 2024 as enterprises replaced hardware routers with software images hosted on white-box devices. Integrated network-security-as-a-service exhibits the strongest trajectory with a 29.3% CAGR, reflecting growing reliance on SASE frameworks that blend connectivity and threat defense.
Bandwidth-on-Demand and managed VPN remain complementary, enabling dynamic capacity scaling for seasonal workloads and secure connectivity to low-bandwidth sites. By 2030, integrated security is expected to overtake virtual CPE as enterprises regard secure connectivity as baseline. The trend underpins steady increases in Network as a Service market size, channeling spend toward multi-function service tiers that bake compliance, DDoS protection, and observability into a single SLA.
The Network As A Service Market Report is Segmented by Type (LAN-As-A-Service, WAN-As-A-Service, and More), Application (Virtual CPE (vCPE), Bandwidth-On-Demand (BoD), and More), Organization Size (Large Enterprises and Small and Medium Enterprises (SMEs)), Industry Vertical (IT and Telecom, BFSI, Healthcare, and More), and Geography. The Market Forecasts are Provided in Terms of Value (USD).
Geography Analysis
North America held the lion's share at 35.4% in 2024, reflecting a sophisticated cloud ecosystem, early SASE adoption, and an active MandA landscape that consolidates capabilities within incumbent vendors. HPE's planned USD 14 billion acquisition of Juniper Networks intends to double networking revenue contribution, signaling a platform play to challenge Cisco's dominance. Federal and state data-privacy rules further spur managed-service uptake by enterprises that lack compliance resources in-house.
Asia-Pacific is poised for a 28.9% CAGR through 2030 as governments fund digital-infrastructure build-outs and telcos commercialize private-5G slicing for industrial campuses. China's data-localization mandates encourage sovereign-cloud NaaS models, while India's Production-Linked Incentive program stimulates factory digitization, together bolstering regional demand.
Europe remains opportunity-rich despite tight regulations; the upcoming Digital Operational Resilience Act drives banks and insurers toward managed connectivity that embeds audit-ready reporting. Service providers tailor offerings to satisfy GDPR, data-act portability, and emerging cyber-resilience benchmarks, promoting steady uptake. Latin America, the Middle East, and Africa are still nascent but gaining traction as cloud-service availability rises and energy-price volatility increases appetite for predictable OpEx consumption models.
- Cisco Systems Inc.
- Hewlett Packard Enterprise (Aruba/GreenLake)
- ATandT Inc.
- Verizon Communications Inc.
- IBM Corp.
- DXC Technology
- TD SYNNEX (Avnet)
- NEC Corp.
- Oracle Corp.
- GTT Communications
- VMware (Broadcom)
- Telstra Group
- Lumen Technologies
- Cato Networks
- Aryaka Networks
- Juniper Networks
- Nokia (Alcatel-Lucent Enterprise)
- Akamai Technologies
- Masergy (Comcast Business)
- Proofpoint / Meta Networks
- Extreme Networks
- Fortinet Inc.
Additional Benefits:
- The market estimate (ME) sheet in Excel format
- 3 months of analyst support
TABLE OF CONTENTS
1 INTRODUCTION
- 1.1 Study Assumptions and Market Definition
- 1.2 Scope of the Study
2 RESEARCH METHODOLOGY
3 EXECUTIVE SUMMARY
4 MARKET LANDSCAPE
- 4.1 Market Overview
- 4.2 Market Drivers
- 4.2.1 Enterprises' "cloud-first" network transformation roadmaps
- 4.2.2 Shift from CapEx to OpEx subscription budgeting pressure
- 4.2.3 SD-WAN and SASE convergence accelerating managed WAN refresh
- 4.2.4 Campus-LAN NaaS demand to counter Wi-Fi 7 power spikes
- 4.2.5 AI-driven network assurance reducing MTTR below 5 min
- 4.2.6 Private-5G network slicing sold "as-a-service" by CSPs
- 4.3 Market Restraints
- 4.3.1 Persistent data-sovereignty and residency compliance barriers
- 4.3.2 Vendor lock-in fears around proprietary lifecycle platforms
- 4.3.3 Complex lease-accounting rules under IFRS 16/ASC 842
- 4.3.4 Edge-site power cost volatility impacting NaaS TCO
- 4.4 Value Chain Analysis
- 4.5 Regulatory Landscape
- 4.6 Technological Outlook
- 4.7 Porter's Five Forces Analysis
- 4.7.1 Bargaining Power of Suppliers
- 4.7.2 Bargaining Power of Buyers
- 4.7.3 Threat of New Entrants
- 4.7.4 Threat of Substitutes
- 4.7.5 Intensity of Competitive Rivalry
- 4.8 Assessment of the Impact of Macroeconomic Trends on the Market
5 MARKET SIZE AND GROWTH FORECASTS (VALUE)
- 5.1 By Type
- 5.1.1 LAN-as-a-Service
- 5.1.2 WAN-as-a-Service
- 5.1.3 Campus-Switch-as-a-Service
- 5.1.4 Data-Centre-Interconnect-as-a-Service
- 5.2 By Application
- 5.2.1 Virtual CPE (vCPE)
- 5.2.2 Bandwidth-on-Demand (BoD)
- 5.2.3 Integrated Network-Security-as-a-Service
- 5.2.4 Virtual Private Network (VPN)
- 5.3 By Organisation Size
- 5.3.1 Large Enterprises
- 5.3.2 Small and Medium Enterprises (SMEs)
- 5.4 By Industry Vertical
- 5.4.1 IT and Telecom
- 5.4.2 BFSI
- 5.4.3 Healthcare
- 5.4.4 Manufacturing
- 5.4.5 Retail and E-commerce
- 5.4.6 Other Industry Verticals
- 5.5 By Geography
- 5.5.1 North America
- 5.5.1.1 United States
- 5.5.1.2 Canada
- 5.5.1.3 Mexico
- 5.5.2 Europe
- 5.5.2.1 Germany
- 5.5.2.2 United Kingdom
- 5.5.2.3 France
- 5.5.2.4 Italy
- 5.5.2.5 Spain
- 5.5.2.6 Rest of Europe
- 5.5.3 Asia-Pacific
- 5.5.3.1 China
- 5.5.3.2 Japan
- 5.5.3.3 India
- 5.5.3.4 South Korea
- 5.5.3.5 Australia
- 5.5.3.6 Rest of Asia-Pacific
- 5.5.4 South America
- 5.5.4.1 Brazil
- 5.5.4.2 Argentina
- 5.5.4.3 Rest of South America
- 5.5.5 Middle East and Africa
- 5.5.5.1 Middle East
- 5.5.5.1.1 Saudi Arabia
- 5.5.5.1.2 United Arab Emirates
- 5.5.5.1.3 Turkey
- 5.5.5.1.4 Rest of Middle East
- 5.5.5.2 Africa
- 5.5.5.2.1 South Africa
- 5.5.5.2.2 Egypt
- 5.5.5.2.3 Nigeria
- 5.5.5.2.4 Rest of Africa
- 5.5.1 North America
6 COMPETITIVE LANDSCAPE
- 6.1 Market Concentration
- 6.2 Strategic Moves
- 6.3 Market Share Analysis
- 6.4 Company Profiles (includes Global level Overview, Market level overview, Core Segments, Financials as available, Strategic Information, Market Rank/Share for key companies, Products and Services, and Recent Developments)
- 6.4.1 Cisco Systems Inc.
- 6.4.2 Hewlett Packard Enterprise (Aruba/GreenLake)
- 6.4.3 ATandT Inc.
- 6.4.4 Verizon Communications Inc.
- 6.4.5 IBM Corp.
- 6.4.6 DXC Technology
- 6.4.7 TD SYNNEX (Avnet)
- 6.4.8 NEC Corp.
- 6.4.9 Oracle Corp.
- 6.4.10 GTT Communications
- 6.4.11 VMware (Broadcom)
- 6.4.12 Telstra Group
- 6.4.13 Lumen Technologies
- 6.4.14 Cato Networks
- 6.4.15 Aryaka Networks
- 6.4.16 Juniper Networks
- 6.4.17 Nokia (Alcatel-Lucent Enterprise)
- 6.4.18 Akamai Technologies
- 6.4.19 Masergy (Comcast Business)
- 6.4.20 Proofpoint / Meta Networks
- 6.4.21 Extreme Networks
- 6.4.22 Fortinet Inc.
7 MARKET OPPORTUNITIES AND FUTURE OUTLOOK
- 7.1 White-space and Unmet-Need Assessment

