|
시장보고서
상품코드
1851563
몰입형 가상현실(VR) : 시장 점유율 분석, 산업 동향, 통계, 성장 예측(2025-2030년)Immersive Virtual Reality - Market Share Analysis, Industry Trends & Statistics, Growth Forecasts (2025 - 2030) |
||||||
몰입형 가상현실(VR) 시장 규모는 2025년에 127억 5,000만 달러로 추정되고, 예측 기간(2025-2030년)의 CAGR은 28.22%로, 2030년에는 414억 5,000만 달러에 달할 것으로 예상됩니다.

특히, 항공우주비행 시뮬레이션, 방어 조종사 훈련, 규제 대상의 헬스케어 치료에 있어서 기업이 파일럿 프로그램에서 대규모의 전개로 이행함에 따라 상업 수요가 확대되고 있습니다. 헤드 마운트 디스플레이는 여전히 지배적인 장치의 폼 팩터이지만 PC 및 콘솔의 필요성을 제거한 테더링이 필요없는 설정을 중시하는 구매자가 많기 때문에 독립형이 가장 빠르게 가속되고 있습니다. 북미가 지출의 주도권을 유지하고 있지만, 중국 정부의 표준화 이니셔티브를 배경으로 아시아태평양이 보다 빠르게 성장하고 있으며, 2024년에는 100개 이상의 대규모 VR 설치가 시작되었습니다. 기세는 기업의 ROI 지표에도 나타나고, Walmart는 트레이닝 시간을 96% 단축하고, Boeing은 배선 공정 지도를 75% 삭감했습니다. 클라우드 스트리밍 및 AI 주도 적응 컨텐츠와 같은 소프트웨어 제공의 진보는 하드웨어의 가격 마찰을 완화하는 데 도움이 되지만, 반도체 및 고순도 석영 공급 측면의 난고 하에서는 구성 요소 비용을 올리고 있습니다.
세계의 몰입형 가상현실(VR) 시장 동향과 인사이트
항공우주 및 방위 훈련에서 VR 사용
국방기관에서는 몰입형 시뮬레이터를 코어 커리큘럼에 통합하고 있습니다. 미국 공군은 Pilot Training Transformation 이니셔티브 하에 225대의 VR 디바이스를 배치했으며, Mass Virtual은 관련 계약으로 6,700만 달러를 확보했습니다. 록히드 마틴과 레드 6은 TF-50 훈련기에 확장 오버레이를 통합했고, Vrgineers는 F-35 시뮬레이션 능력을 확장하는 체코 협정에 참여했습니다. 미국 연방 항공국(Federal Aviation Administration)은 Vertex Solutions 및 Varjo와 협력하여 민간 비행 시뮬레이터의 기준을 업데이트하고 있습니다. 이러한 움직임은 기술 습득 사이클을 단축하고 실제 비행 연료비를 절감하며 몰입형 가상현실(VR) 시장의 지속적인 성장을 지원합니다. 유럽과 아시아의 지속적인 조달 파이프라인은 중기 전망을 강화합니다.
게이밍 HMD를 통한 소비자 도입
세계 VR 헤드셋 출하량은 2024년 960만 대로 증가했고 Meta는 73%의 점유율을 차지했으며 Apple의 Vision Pro는 3,499달러의 가격에도 불구하고 5%의 프리미엄 틈새 시장을 확보했습니다. 독립형 HMD는 구매자가 케이블 없이 사용하는 것을 선호하기 때문에 CAGR 33.20%로 확대하고 있지만 Quest 3S와 같은 저가의 출시는 휴일 시즌의 연조를 완전히 상쇄할 수 없으며 컨텐츠 폭이 가격만큼 중요하다는 것을 시사하고 있습니다. 중국 해외 하드웨어에 대한 105% 관세와 지역 GPU 부족은 소매 가격을 올릴 위험이 있지만, 지방 당국이 자금을 제공하는 대규모 로케이션 기반 VR 체험은 계속해서 최초 사용자를 유치해 당면의 대수 성장을 지원합니다. 가속화되는 5G 보급과 클라우드 렌더링은 성능 장벽을 더욱 낮추고 몰입형 가상현실(VR) 시장의 기세를 유지합니다.
멀티 센서 장비의 높은 총 소유 비용
Apple Vision Pro BOM은 1,542달러로 마이크로 OLED 디스플레이만으로 비용의 35%를 차지합니다. 허리케인 '헤린'은 반도체 포토리소그래피에 필수적인 고순도 석영의 90%를 공급하는 노스캐롤라이나주의 석영광산에 피해를 입어 부품 가격을 밀어 올렸습니다. 중국제 헤드셋에 대한 100% 이상의 관세, TSMC 지진 장애 후 GPU 부족이 소비자와 기업의 인수 비용을 밀어 올리고 있습니다. 미국의 반도체 공장은 아시아의 동업 타사를 35% 넘는 조업 비용으로 조업하고 있어 국내의 가격 상승을 억제하고 있습니다. 그러나 눈앞의 가격 충격은 가격에 민감한 지역에서의 채용을 억제하고 몰입형 가상현실(VR) 시장의 궤도를 풀어줍니다.
부문 분석
2024년 몰입형 가상현실(VR) 시장 규모는 헤드 마운트 디스플레이가 86%의 매출 점유율을 획득해 압도적인 힘을 보였습니다. 독립형이 가장 급속히 확대되었으며 2030년까지 연평균 복합 성장률(CAGR)은 33.20%를 나타낼 전망입니다. Meta의 Quest 라인은 계속 출하량의 73%를 차지하고 있지만, 299달러의 Quest 3S는 휴일 수요에 불을 붙일 수 없었습니다. 무선 스트리밍의 대기 시간이 줄어들기 때문에 테더 리그는 인기를 잃고 있으며, 전용 하드웨어가 보다 저렴한 가격으로 고성능이 되어 스마트폰의 쉘형 뷰어는 후퇴하고 있습니다.
제스처 추적 액세서리와 햅틱 글로브는 정확한 손 움직임이 필요한 기업용 교육 프로그램으로 인기를 얻고 있습니다. 메타, 소니, 마이크로소프트가 촉각 피드백에 대한 특허를 신청하고 있어 사용자의 몰입감을 높이고 있습니다. VR 카메라는 2024년에 100개 이상의 회장을 개설한 중국의 위치 기반 엔터테인먼트 사업자에게 판매되어 지역 컨텐츠 캡처를 충실하게 했습니다. 석영 광산의 혼란으로 인한 부품 부족은 모든 디바이스 클래스에서 부품 비용을 끌어올릴 수 있지만 디스플레이 수율과 배터리 밀도의 발전으로 인해 2026년 이후 비용 상승이 완만해질 것으로 예상되며 몰입형 가상현실(VR) 시장으로의 광범위한 디바이스 침투를 지원합니다.
2024년 몰입형 가상현실(VR) 시장 규모는 엔터테인먼트와 게임이 46%의 점유율을 유지했습니다. 그러나 헬스케어는 가장 급성장하고 있으며, FDA나 CE에 의한 승인에 의해 상환의 길이 열리기 때문에 2030년까지의 CAGR은 29.42%를 나타낼 것으로 추정됩니다. RelieVRx와 DeepWell DTx의 승인은 치료 컨텐츠를 통증 관리 및 정신 건강에 도입하여이 부문을 실험 영역에서 처방 영역으로 이동시킵니다.
방어와 항공우주는 이미 225개의 미 공군 훈련 유닛이 실전 배치되어 있음을 알 수 있듯이 대규모 시뮬레이터 조달을 계속하고 있습니다. 루프트한자나 CAE와 같은 자동차 회사는 승무원의 유도와 조종석의 숙련에 혼합 현실을 적용하고 건축 스튜디오는 설계 결함을 조기에 식별하기 위해 홀로그램 워크스루를 활용하고 있습니다. 소매업에서는 컨텐츠 비용과 헤드셋 위생 측면에 대한 우려로 여전히 시행 착오가 계속되고 있습니다. 제조업과 BP와 같은 에너지 대기업은 안전모듈을 전개하고, 헬스케어의 검증효과가 인접한 섹터에도 침투하고 있는 것을 나타냅니다.
몰입형 가상현실(VR) 시장 보고서는 장치(헤드 마운트 디스플레이 (HMD), 제스처 추적 장치, 촉각 피드백 장치, VR 카메라), 최종 사용자 산업(엔터테인먼트 및 게임, 항공우주 및 방위, 건강 관리, 교육 및 교육 등), 구성 요소(하드웨어, 소프트웨어, 서비스), 몰입형(완전 몰입형, 반 몰입형, 비몰입)으로 구분됩니다.
지역 분석
북미는 2024년 매출 점유율 38%로 계속 몰입형 가상현실(VR) 시장을 선도했습니다. 미국 기업은 대규모 조종사 훈련 예산과 의료 상환 파이프라인의 혜택을 받고 있지만 반도체 제조 비용 상승은 아시아 경쟁사에 비해 하드웨어 가격을 인상하고 있습니다. 이 지역은 클라우드 인프라와 5G 배포를 활용하여 디바이스 비용 장벽을 상쇄할 수 있는 원격 렌더링 솔루션을 시험적으로 도입하고 있습니다. 월마트(Walmart), 보잉(Boeing), 뱅크 오브 아메리카(Bank of America)의 기업 연수 프로그램은 북미의 실증 포인트이며, 벤더는 북미 고객을 중시하고 있습니다.
아시아태평양의 CAGR은 32.60%로 가장 높았으며, 중국의 구조화된 메타버스 정책의 틀과 2024년에 위탁된 100개 이상의 대규모 VR 설비에 추진되었습니다. 산업정보화부는 디바이스 프로토콜을 조정하는 표준화위원회를 설립했으며, 국가영화국은 VR 영화관의 배치를 장려했습니다. IDC는 지역의 AR/VR 지출은 2029년까지 105억 달러를 돌파했으며, 이는 세계 지출액의 26.5%에 해당할 것으로 예측했습니다. 일본과 한국은 교육과 스마트 제조의 파일럿에 대한 정부 보조금을 통해 기세를 늘리고 인도의 비용 효율적인 개발자 풀은 현지화된 컨텐츠 제작을 가속시킵니다. TSMC의 지진과 태풍으로 인한 석영 파손과 같은 자연재해 위험은 여전히 운영상의 우려사항이지만 부품 공급망에 대한 근접성은 운송 지연을 줄이는 데 도움이 됩니다.
유럽은 유럽위원회의 가상 월드 로드맵과 다년간의 국가 자금 지원을 받고 있는 60개사로 구성된 독일의 XR-Interaction 네트워크에 힘입어 전략적인 중간에 위치하고 있습니다. 가상현실·증강현실산업연합(Virtual and Augmented Reality Industrial Coalition)은 2025년까지 유럽에서 86만건의 신규 고용이 생길 것으로 예측하고 있으며 미국과 중국의 생태계에 대항하는 정치적 의지를 보여주고 있습니다. 런던 스쿨 오브 이코노믹스는 산업계의 전문지식을 결집하는 '메타버스를 위한 에어버스'를 제창하고 BMW, IKEA, 보쉬 등 기업들은 상호 운용 가능한 디지털 트윈 실험을 실시했습니다. 환율 변동과 프라이버 실의 엄격화로 소비자 이용이 지연될 가능성은 있지만, 표준과 윤리에 관한 국경을 넘은 협업은 장기적인 지역 경쟁력을 강화하여 몰입형 가상현실(VR) 시장에 대한 유럽의 공헌을 지속시킵니다.
기타 혜택 :
- 엑셀 형식 시장 예측(ME) 시트
- 3개월간의 애널리스트 지원
목차
제1장 서론
- 조사 전제조건과 시장 정의
- 조사 범위
제2장 조사 방법
제3장 주요 요약
제4장 시장 상황
- 시장 성장 촉진요인
- 항공우주 및 방위훈련에서 VR의 이용
- 게이밍 HMD에 의한 소비자 도입
- 정부 출자에 의한 VR 헬스케어 치료의 파일럿 시험
- 원격 협업을 위한 기업 메타버스 플랫폼
- VR 교육에서 AI를 활용한 적응 학습
- 하드웨어 장벽을 낮추는 클라우드 렌더링에 의한 VR 스트리밍
- 시장 성장 억제요인
- 멀티 센서 리그의 높은 총 소유 비용
- 컨텐츠의 희소성과 에코시스템의 단편화
- 대기 시간에 의한 멀미가 세션의 길이를 제한
- 바이오메트릭스와 시선분석에 대한 프라이버시 우려
- 가치/공급망 분석
- 규제 상황
- 기술 전망
- Porter's Five Forces 분석
- 신규 참가업체의 위협
- 구매자의 협상력/소비자
- 공급기업의 협상력
- 대체품의 위협
- 경쟁 기업 간 경쟁 관계
- 투자분석
제5장 시장 규모와 성장 예측
- 디바이스별
- 헤드 마운티드 디스플레이(HMD)
- 독립형 HMD
- 유선 연결형 HMD
- 스마트폰 기반 HMD
- 제스처 추적 장치
- 햅틱 장갑
- 모션 컨트롤러
- 전신 슈트
- 햅틱 피드백 장치
- VR 카메라
- 헤드 마운티드 디스플레이(HMD)
- 최종 사용자 업계별
- 엔터테인먼트 및 게임
- 항공우주 및 방위
- 헬스케어
- 수술 및 의료 교육
- 재활 치료
- 정신 건강 및 통증 관리
- 교육 및 훈련
- 자동차 및 운송
- 건축, 엔지니어링 및 건설(AEC)
- 소매 및 전자상거래
- 기타 산업
- 구성 요소별
- 하드웨어
- 소프트웨어
- 서비스
- 몰입 유형별
- 완전 몰입형
- 반몰입형
- 비몰입형
- 지역별
- 북미
- 미국
- 캐나다
- 멕시코
- 남미
- 브라질
- 아르헨티나
- 기타 남미
- 유럽
- 영국
- 독일
- 프랑스
- 이탈리아
- 스페인
- 기타 유럽
- 아시아태평양
- 중국
- 일본
- 한국
- 인도
- 기타 아시아태평양
- 중동
- 아랍에미리트(UAE)
- 사우디아라비아
- 튀르키예
- 기타 중동
- 아프리카
- 남아프리카
- 나이지리아
- 케냐
- 기타 아프리카
- 북미
제6장 경쟁 구도
- 전략적 동향
- 시장 점유율 분석
- 기업 프로파일
- Meta Platforms Inc.(Oculus)
- Sony Corporation
- HTC Corporation
- Apple Inc.
- Samsung Electronics Co., Ltd.
- Microsoft Corporation
- Pico Interactive(ByteDance Ltd.)
- Valve Corporation
- Varjo Technologies Oy
- HP Inc.
- Carl Zeiss AG
- Avegant Corporation
- Varjo Technologies
- Vrgineers
- Magic Leap, Inc.
- Google LLC
- Eon Reality, Inc.
- CyberGlove Systems LLC
- Ultraleap Ltd.(Leap Motion)
- Sixense Enterprises Inc.
- Vuzix Corporation
- Lenovo Group Ltd.
- Ultraleap Ltd.
제7장 시장 기회와 향후 전망
KTH 25.11.21The Immersive Virtual Reality Market size is estimated at USD 12.75 billion in 2025, and is expected to reach USD 41.45 billion by 2030, at a CAGR of 28.22% during the forecast period (2025-2030).
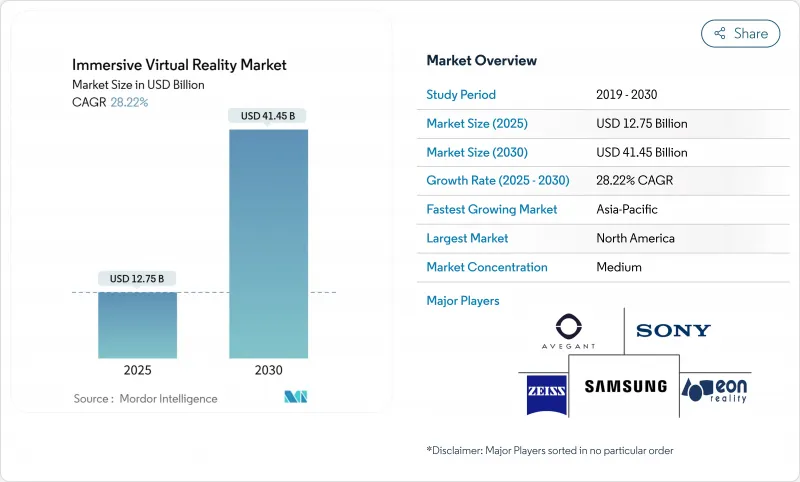
Commercial demand is expanding as enterprises shift from pilot programs to scaled roll-outs, particularly in aerospace flight simulation, defense pilot training, and regulated healthcare therapies. Head-mounted displays remain the dominant device form factor, yet stand-alone models are accelerating fastest as buyers value untethered set-ups that remove PC or console requirements. North America retains spending leadership, but Asia Pacific is growing more quickly on the back of Chinese government standardization initiatives and more than 100 large-scale VR installations launched in 2024. Momentum is also evident in enterprise ROI metrics, Walmart compressed training times by 96% and Boeing trimmed wiring-process instruction by 75% confirming cost savings that extend well beyond entertainment. Supply-side turbulence in semiconductors and high-purity quartz is lifting component costs, though software-delivered advances such as cloud streaming and AI-driven adaptive content help mitigate hardware price friction.
Global Immersive Virtual Reality Market Trends and Insights
Use of VR in Aerospace and Defence Training
Defense agencies are embedding immersive simulators into core curricula. The U.S. Air Force deployed 225 VR devices under its Pilot Training Transformation initiative, while Mass Virtual secured USD 67 million in related contracts. Lockheed Martin and Red 6 integrated augmented overlays for the TF-50 trainer, and Vrgineers joined a Czech agreement to extend F-35 simulation capability. Regulatory alignment is advancing as the Federal Aviation Administration collaborates with Vertex Solutions and Varjo to update standards for civilian flight simulators. These moves shorten skill-acquisition cycles, reduce live-flight fuel spending, and underpin sustained growth for the immersive virtual reality market. Continued procurement pipelines in Europe and Asia reinforce the medium-term outlook.
Consumer Adoption via Gaming HMDs
Global VR headset shipments rose to 9.6 million units in 2024, with Meta holding 73% share and Apple's Vision Pro securing a 5% premium niche despite a USD 3,499 price tag. Stand-alone HMDs are expanding at 33.20% CAGR as buyers favor cable-free use, yet lower-priced launches such as the Quest 3S did not fully offset holiday-season softness, suggesting that content breadth is as vital as price. China's 105% tariffs on overseas hardware and regional GPU shortages risk lifting retail prices, but large-scale location-based VR experiences funded by local authorities continue to attract first-time users, supporting near-term unit growth. Accelerated 5G roll-out and cloud rendering will further lower performance barriers, sustaining momentum for the immersive virtual reality market.
High Total Cost of Ownership of Multi-Sensory Rigs
Apple Vision Pro's bill of materials stands at USD 1,542, with micro-OLED displays alone forming 35% of the cost, underscoring how sophisticated optics inflate retail pricing. Hurricane Helene damaged North Carolina quartz mines that supply up to 90% of global high-purity quartz, vital for semiconductor photolithography, pushing component prices higher. Tariffs exceeding 100% on China-built headsets, plus GPU shortages after TSMC earthquake disruptions, elevate consumer and enterprise acquisition expenses. U.S. fabs operate at operating costs 35% above Asian peers, curbing domestic price relief. Enterprises respond with bulk pre-purchase contracts to lock in supply, yet near-term sticker shock trims adoption in price-sensitive regions and tempers the immersive virtual reality market trajectory.
Other drivers and restraints analyzed in the detailed report include:
- Government-Funded VR Healthcare Therapy Pilots
- Enterprise Metaverse Platforms for Remote Collaboration
- Content Scarcity and Ecosystem Fragmentation
For complete list of drivers and restraints, kindly check the Table Of Contents.
Segment Analysis
The immersive virtual reality market size for head-mounted displays stood dominant in 2024 as the form factor secured 86% revenue share. Stand-alone variants are poised for the fastest climb, advancing at a projected 33.20% CAGR to 2030 as buyers gravitate toward wire-free operation that speeds initial set-up. Meta's Quest line continues to hold 73% share of shipments, yet the USD 299 Quest 3S failed to ignite holiday demand, underscoring content rather than price as the limiting factor. Tethered rigs are losing favor as wireless streaming narrows latency, while smartphone-shell viewers retreat because dedicated hardware is more affordable and performant.
Gesture-tracking accessories and haptic gloves are gaining traction within enterprise training programs that need precise hand articulation. Patent filings from Meta, Sony, and Microsoft around tactile feedback elevate user immersion, though full-body suits remain niche given higher cost and cleaning complexity. VR cameras are selling into China's location-based entertainment operators that launched over 100 venues in 2024, enriching local content capture. Component shortages tied to quartz mine disruptions can raise the bill of materials across all device classes yet advances in display yield and battery density are expected to moderate cost escalation after 2026, supporting broader device penetration into the immersive virtual reality market.
Entertainment and gaming retained a 46% share of the immersive virtual reality market size during 2024 as blockbuster titles and esports events anchored consumer spend. Healthcare, however, is tracking the steepest ascent, estimated to deliver a 29.42% CAGR through 2030 on the back of FDA and CE approvals that open reimbursement lanes. RelieVRx and DeepWell DTx clearances usher therapeutic content into pain management and mental health, shifting the segment from experimental to prescription territory.
Defense and aerospace continue to procure large simulator fleets, evidenced by 225 USAF training units already fielded, while education providers join the vanguard as Walmart, Boeing, and Bank of America quantify double-digit productivity lifts. Automotive firms like Lufthansa and CAE apply mixed reality to crew guidance and cockpit familiarization, and architecture studios leverage holographic walkthroughs to identify design flaws early. Retail engagement remains exploratory, held back by content costs and headset hygiene concerns. Manufacturing and energy majors such as BP roll out safety modules, demonstrating how healthcare's validation effect is permeating adjacent sectors, which amplifies growth momentum for the immersive virtual reality market.
The Immersive Virtual Reality Market Report is Segmented by Device (Head-Mounted Displays [HMDs], Gesture Tracking Devices, Haptic Feedback Devices, and VR Cameras), End-User Industry (Entertainment and Gaming, Aerospace and Defense, Healthcare, Education and Training, and More), Component (Hardware, Software, and Services), Immersion Type (Fully-Immersive, Semi-Immersive, and Non-Immersive), and Geography.
Geography Analysis
North America continued to lead the immersive virtual reality market with 38% revenue share in 2024, buoyed by substantial defense spending and early enterprise adoption. U.S. companies benefit from large pilot training budgets and healthcare reimbursement pipelines, although higher semiconductor fabrication costs raise hardware prices relative to Asian competitors. The region is leveraging cloud infrastructure and 5G roll-out to pilot remote rendering solutions that could offset device cost barriers. Corporate training programs at Walmart, Boeing, and Bank of America supply domestic proof points, reinforcing vendor focus on North American clients.
Asia Pacific registered the highest regional CAGR at 32.60%, propelled by China's structured metaverse policy framework and more than 100 large-scale VR installations commissioned in 2024. The Ministry of Industry and Information Technology formed a standards committee that aligns device protocols, while the National Film Administration encouraged VR cinema roll-outs. IDC projects regional AR/VR spending to surpass USD 10.5 billion by 2029, equal to 26.5% of global outlays. Japan and South Korea add momentum through government grants for education and smart-manufacturing pilots, and India's cost-efficient developer pool accelerates localized content creation. Proximity to component supply chains helps mitigate freight delays, though natural disaster risks such as TSMC's earthquake and typhoon-driven quartz disruptions remain operational concerns.
Europe holds a strategic middle position, supported by the European Commission's virtual worlds roadmap and Germany's XR-Interaction network of 60 firms receiving multi-year state funding. The Virtual and Augmented Reality Industrial Coalition forecasts 860,000 new European jobs by 2025, signaling political will to compete with U.S. and Chinese ecosystems. The London School of Economics champions an "Airbus for the metaverse" to pool industrial expertise, while companies such as BMW, IKEA, and Bosch experiment with interoperable digital twins. Currency fluctuations and stricter privacy rules can slow consumer uptake, yet cross-border collaboration on standards and ethics enhances long-term regional competitiveness, sustaining European contribution to the immersive virtual reality market.
- Meta Platforms Inc. (Oculus)
- Sony Corporation
- HTC Corporation
- Apple Inc.
- Samsung Electronics Co., Ltd.
- Microsoft Corporation
- Pico Interactive (ByteDance Ltd.)
- Valve Corporation
- Varjo Technologies Oy
- HP Inc.
- Carl Zeiss AG
- Avegant Corporation
- Varjo Technologies
- Vrgineers
- Magic Leap, Inc.
- Google LLC
- Eon Reality, Inc.
- CyberGlove Systems LLC
- Ultraleap Ltd. (Leap Motion)
- Sixense Enterprises Inc.
- Vuzix Corporation
- Lenovo Group Ltd.
- Ultraleap Ltd.
Additional Benefits:
- The market estimate (ME) sheet in Excel format
- 3 months of analyst support
TABLE OF CONTENTS
1 INTRODUCTION
- 1.1 Study Assumptions and Market Definition
- 1.2 Scope of the Study
2 RESEARCH METHODOLOGY
3 EXECUTIVE SUMMARY
4 MARKET LANDSCAPE
- 4.1 Market Drivers
- 4.1.1 Use of VR in aerospace and defence training
- 4.1.2 Consumer adoption via gaming HMDs
- 4.1.3 Government-funded VR healthcare therapy pilots
- 4.1.4 Enterprise metaverse platforms for remote collaboration
- 4.1.5 AI-powered adaptive learning in VR education
- 4.1.6 Cloud-rendered VR streaming lowers hardware barrier
- 4.2 Market Restraints
- 4.2.1 High total cost of ownership of multi-sensory rigs
- 4.2.2 Content scarcity and ecosystem fragmentation
- 4.2.3 Latency-driven motion-sickness limits session length
- 4.2.4 Privacy concerns over biometric and gaze analytics
- 4.3 Value/Supply-Chain Analysis
- 4.4 Regulatory Landscape
- 4.5 Technological Outlook
- 4.6 Porter's Five Forces Analysis
- 4.6.1 Threat of New Entrants
- 4.6.2 Bargaining Power of Buyers/Consumers
- 4.6.3 Bargaining Power of Suppliers
- 4.6.4 Threat of Substitute Products
- 4.6.5 Intensity of Competitive Rivalry
- 4.7 Investment Analysis
5 MARKET SIZE AND GROWTH FORECASTS (VALUE)
- 5.1 By Device
- 5.1.1 Head-Mounted Displays (HMDs)
- 5.1.1.1 Stand-alone HMDs
- 5.1.1.2 Tethered HMDs
- 5.1.1.3 Smartphone-based HMDs
- 5.1.2 Gesture Tracking Devices
- 5.1.2.1 Haptic Gloves
- 5.1.2.2 Motion Controllers
- 5.1.2.3 Full-Body Suits
- 5.1.3 Haptic Feedback Devices
- 5.1.4 VR Cameras
- 5.1.1 Head-Mounted Displays (HMDs)
- 5.2 By End-user Industry
- 5.2.1 Entertainment and Gaming
- 5.2.2 Aerospace and Defence
- 5.2.3 Healthcare
- 5.2.3.1 Surgery and Medical Training
- 5.2.3.2 Rehabilitation Therapy
- 5.2.3.3 Mental Health and Pain Management
- 5.2.4 Education and Training
- 5.2.5 Automotive and Transportation
- 5.2.6 Architecture, Engineering and Construction (AEC)
- 5.2.7 Retail and E-commerce
- 5.2.8 Other Industries
- 5.3 By Component
- 5.3.1 Hardware
- 5.3.2 Software
- 5.3.3 Services
- 5.4 By Immersion Type
- 5.4.1 Fully-Immersive
- 5.4.2 Semi-Immersive
- 5.4.3 Non-Immersive
- 5.5 By Geography
- 5.5.1 North America
- 5.5.1.1 United States
- 5.5.1.2 Canada
- 5.5.1.3 Mexico
- 5.5.2 South America
- 5.5.2.1 Brazil
- 5.5.2.2 Argentina
- 5.5.2.3 Rest of South America
- 5.5.3 Europe
- 5.5.3.1 United Kingdom
- 5.5.3.2 Germany
- 5.5.3.3 France
- 5.5.3.4 Italy
- 5.5.3.5 Spain
- 5.5.3.6 Rest of Europe
- 5.5.4 Asia-Pacific
- 5.5.4.1 China
- 5.5.4.2 Japan
- 5.5.4.3 South Korea
- 5.5.4.4 India
- 5.5.4.5 Rest of Asia-Pacific
- 5.5.5 Middle East
- 5.5.5.1 United Arab Emirates
- 5.5.5.2 Saudi Arabia
- 5.5.5.3 Turkey
- 5.5.5.4 Rest of Middle East
- 5.5.6 Africa
- 5.5.6.1 South Africa
- 5.5.6.2 Nigeria
- 5.5.6.3 Kenya
- 5.5.6.4 Rest of Africa
- 5.5.1 North America
6 COMPETITIVE LANDSCAPE
- 6.1 Strategic Moves
- 6.2 Market Share Analysis
- 6.3 Company Profiles (includes Global level Overview, Market level overview, Core Segments, Financials as available, Strategic Information, Market Rank/Share for key companies, Products and Services, and Recent Developments)
- 6.3.1 Meta Platforms Inc. (Oculus)
- 6.3.2 Sony Corporation
- 6.3.3 HTC Corporation
- 6.3.4 Apple Inc.
- 6.3.5 Samsung Electronics Co., Ltd.
- 6.3.6 Microsoft Corporation
- 6.3.7 Pico Interactive (ByteDance Ltd.)
- 6.3.8 Valve Corporation
- 6.3.9 Varjo Technologies Oy
- 6.3.10 HP Inc.
- 6.3.11 Carl Zeiss AG
- 6.3.12 Avegant Corporation
- 6.3.13 Varjo Technologies
- 6.3.14 Vrgineers
- 6.3.15 Magic Leap, Inc.
- 6.3.16 Google LLC
- 6.3.17 Eon Reality, Inc.
- 6.3.18 CyberGlove Systems LLC
- 6.3.19 Ultraleap Ltd. (Leap Motion)
- 6.3.20 Sixense Enterprises Inc.
- 6.3.21 Vuzix Corporation
- 6.3.22 Lenovo Group Ltd.
- 6.3.23 Ultraleap Ltd.
7 MARKET OPPORTUNITIES AND FUTURE OUTLOOK
- 7.1 White-space and unmet-need assessment