|
시장보고서
상품코드
1851793
다크 애널리틱스 시장 : 점유율 분석, 산업 동향, 통계, 성장 예측(2025-2030년)Dark Analytics - Market Share Analysis, Industry Trends & Statistics, Growth Forecasts (2025 - 2030) |
||||||
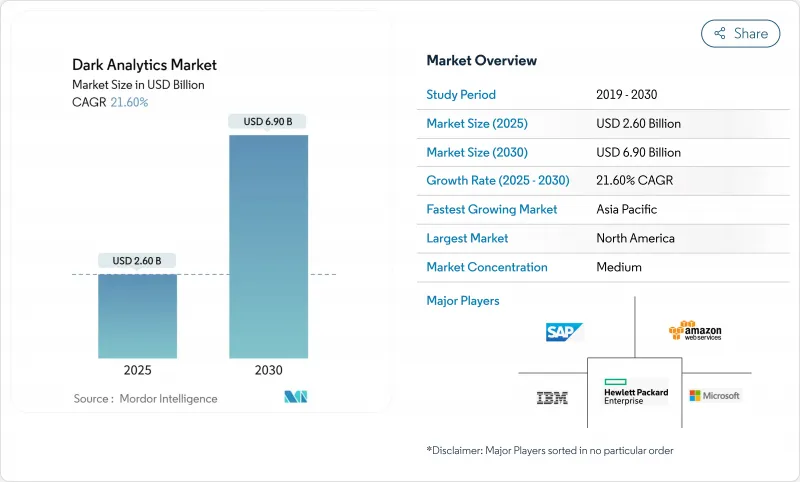
세계의 다크 애널리틱스 시장 규모는 2025년 26억 달러, 2030년까지 69억 달러에 이를 것으로 예측되며 CAGR은 21.6%로 추이할 것으로 예상됩니다.
이 성장은 기업 정보의 거의 80%가 여전히 비구조화되어 기존 분석 시스템에서는 보이지 않는다는 기업의 인식을 반영합니다. 인공지능, 머신러닝, 클라우드 네이티브 플랫폼을 결합하여 이러한 자고 있는 데이터의 더미를 실시간 업무 인텔리전스로 바꿀 수 있습니다. IoT(사물인터넷) 디바이스의 급속한 보급, 클라우드 스토리지 비용 저하, 광범위한 로그 보존을 의무화하는 규제의 확대는 다크 데이터 처리 수요를 더욱 가속화하고 있습니다. 경쟁의 기세는 대규모 언어 모델, 벡터 검색, 합성 데이터 생성을 포함한 공급자로 이동하여 이러한 조합을 통해 보다 빠른 모델 학습과 보다 강력한 프라이버시 관리가 가능합니다.
세계의 다크 애널리틱스 시장 동향과 통찰
AI/ML 우선 보안 분석 도입
미국 은행의 91%가 부정 행위 감지에 AI를 사용하고 2027년까지 400억 달러의 손실을 줄일 수 있기 때문에 보안 중심 아키텍처가 다크 애널리틱스 시장을 재정의하고 있습니다. 정보보안 최고 책임자는 적대적인 인공지능으로 인한 고도의 위협으로 자율적 대응이 필수적이라고 보고하고 있으며, 78%가 방어 태세에 심각한 영향을 미칩니다는 것을 인정합니다. 금융기관은 구조화 및 비구조화 트랜잭션 스트림 전반에 걸쳐 실시간 분석을 지원하는 OpenAI와 MongoDB의 벡터 검색 통합과 같은 도입을 통해 시프트를 설명합니다. 대규모 언어 모델은 현재 복잡한 보안 로그를 해석하고 있지만, 섀도우 AI의 상승(일반적인 AI 활동의 72%는 공식 모니터링 밖에서 발생)은 정교한 모니터링만 처리할 수 있는 새로운 노출 위험을 창출하고 있습니다.
지수 함수 IoT 데이터 증가
IoT 디바이스는 CAGR 40%로 제타바이트 규모의 비정형 데이터를 생성하고 스토리지와 애널리틱스의 경제성을 근본적으로 재구성하고 있습니다. 제조업체는 이 다크 데이터를 활용하여 큰 이익을 얻었습니다. Jaguar Land Rover는 실시간 센서 피드에 그래프 분석을 적용하여 공급망 쿼리 시간을 3주에서 45분으로 단축했습니다. 2025년까지 기업에서 생성된 데이터의 75%는 기존 데이터센터 이외에서 처리되고 있으며, 이 동향이 엣지 채용을 촉진하고 있습니다. 엣지 컴퓨팅과 경량 AI를 결합하여 자동 산업기계나 커넥티드 헬스케어 기기 등의 미션 크리티컬한 환경에서 밀리초 레벨의 패턴 인식이 가능합니다.
데이터 엔지니어링과 데이터 사이언스의 기술 격차
데이터센터 사업자의 58%가 2025년 중에 엔지니어링직의 만족에 고전해, 다크 애널리틱스 시장 전개의 병목이 되고 있습니다. 현대 프로젝트는 분산 컴퓨팅, 도메인 지식, 머신 러닝 작업에 걸친 학제 간 기술이 필요합니다. 아시아태평양의 급속한 디지털화는 희귀 전문가의 임금을 상승시키고 중소기업을 불리한 입장으로 몰아넣는다. 로우코드 프레임워크는 파이프라인 생성을 간소화하여 어느 정도의 압력을 줄일 수 있지만 멀티모달 추론과 같은 고급 이용 사례에는 여전히 숙련된 인력이 필요합니다. 많은 기업들이 격차를 메우기 위해 관리 플랫폼을 선택했는데, 이는 집중 위험을 초래하고 사용자 정의 유연성을 제한할 수 있습니다.
부문 분석
처방적 분석은 CAGR 28.5%로 확대되어 사후 자동화된 의사결정 오케스트레이션으로의 전환을 뒷받침하고 있습니다. 2024년 다크 애널리틱스 시장 점유율에서는 계획 사이클에 반영시킬 확률적 예측을 제공하는 예측 수법이 43%의 최대 점유율을 유지했습니다. 현재의 채용 추세가 지속되면 예측 엔진에 의한 다크 애널리틱스 시장 규모는 2030년까지 23억 달러로 확대될 수 있습니다. 자연 언어 오버레이를 통해 비즈니스 사용자는 대화 형식으로 'what-if' 질문을 던지고 모델은 순위가 지정된 권장 사항을 응답합니다. 제조업체는 이러한 진화를 받아들이고 전체 공급 네트워크를 시뮬레이션하는 디지털 트윈을 구축하여 직원이 생산을 중단하지 않고 조정을 테스트 할 수 있도록합니다.
기술적이고 진단적인 기법은 보다 고차원 최적화로 이어지는 기본 패턴과 근본 원인을 밝히기 위해 관련성을 유지합니다. 기술적 대시보드는 운영 기술 데이터를 전사적 자원 계획의 스트림과 융합하는 실시간 커넥터를 통해 개선되어 상황 인식을 확장합니다. 건강 관리 진단 분석은 이미지 메모, 검사 결과 및 임상의의 의견을 결합하여 유해한 결과를 특정 프로세스의 결함으로 거슬러 올라가고 나중에 처방적 개입의 기초를 형성합니다. 이 레이어들은 서로를 보강하여 다크 애널리틱스 산업이 전략적 전망과 일상적인 전술적 실행 모두에 도움이 되도록 합니다.
2024년의 다크 애널리틱스 시장 점유율은 클라우드가 67%를 유지했으며 지속적인 서비스 업그레이드와 종량 과금의 탄력성으로 이익을 얻고 있습니다. 그럼에도 불구하고 에지 및 하이브리드 구성 부문은 2030년까지 다크 애널리틱스 시장 규모의 14억 달러를 더 획득할 것으로 예측됩니다. 수요는 제조, 에너지 및 초 이하의 추론이 필요한 자율 시스템에서 가장 강합니다. 엣지 컴퓨팅 분야는 2025년에 615억 4,000만 달러에 이를 것으로 예상되며 애널리틱스 모델에 풍부한 처리 헤드룸을 제공합니다.
기업은 퍼블릭 클라우드와 On-Premise 사설 리소스를 자주 융합시켜 세계 확장성과 주권의 균형을 맞추고 있습니다. 이러한 하이브리드 연동은 아키텍처의 복잡성을 높입니다. 데이터 동기화, 모델 거버넌스 및 제로 트러스트 제어는 노드 간에 원활하게 작동해야 합니다. 공급자는 현재 임베디드 GPU와 경량 오케스트레이션을 갖춘 턴키 에지 게이트웨이를 패키징하여 통합 오버헤드를 줄이고 있습니다. 조기 도입 기업에서는 전력망의 이상 감지와 자율 주행차의 실시간 조정의 고속화가 보고되어 분산 처리의 경제적인 이점을 높이는 결과가 되고 있습니다.
다크 애널리틱스 분석 유형(예측, 처방 등), 배포 모델, 데이터 소스(구조화, 반구조화, 비구조화), 최종 사용 업계별(은행, 금융서비스 및 보험(BFSI), 헬스케어, 기타), 지역별로 시장을 세분화합니다. 시장 예측은 금액(달러)으로 제공됩니다.
지역별 분석
북미는 성숙한 클라우드 에코시스템, AI의 조기 도입, 정책 환경 지원으로 2024년 다크 애널리틱스 시장 규모의 37%를 획득했습니다. 연방 정부 기관은 안전한 데이터 공유를 중시하고 기업에 개인 정보를 강화한 애널리틱스 프레임워크를 채택하도록 촉구하고 있습니다. 전용 하드웨어에 대한 엄청난 투자는 이 지역의 헌신을 뒷받침합니다. 캐나다는 천연 자원 최적화에 주력하고 있으며 멕시코는 수출 경쟁력을 강화하기 위해 자동차 및 전자 장비 제조 분석을 추진하고 있습니다.
아시아태평양은 중국, 인도, 동남아시아 정부가 차세대 데이터센터와 인재 파이프라인에 자금을 제공하고 있기 때문에 CAGR 24.4%로 진행하고 있습니다. 중국은 지역 빅데이터 지출의 37.5%를 차지하고 있으며 국가의 사이버 보안 규정에 따른 소버린 클라우드를 활용하고 있습니다. 인도의 IT 서비스 부문은 비용 우위와 깊은 엔지니어링 풀을 활용하여 수요가 증가함에 따라 턴키 애널리틱스 솔루션을 세계에 수출하고 있습니다. 일본과 한국은 산업 자동화에 주력해 고정밀 로봇 공학과 품질 보증에 엣지 AI를 활용하고 있습니다. 국경을 넘어선 데이터 흐름 규칙이 여전히 과제가 되고 있기 때문에 다국적 기업은 국내 에지 클러스터 등의 현지화 전략을 도입하고 있습니다.
유럽은 GDPR(EU 개인정보보호규정)의 엄격화와 AI 거버넌스 제안의 급증에도 불구하고 중요한 점유율을 유지하고 있습니다. 다크 애널리틱스 시장은 독일, 프랑스, 이탈리아에 걸친 레거시 제조 거점에서 이익을 얻고 있으며 자산 가동률을 높이기 위해 예지 보전을 추구하고 있습니다. DORA 규정은 탄력성 기준을 인상하고 ICT 사고 및 공급망 노출을 평가하는 고급 분석에 대한 수요를 높이고 있습니다. 영국은 금융서비스를 중심으로 모델 검증을 위한 합성 데이터의 채용을 가속화하고 있으며, 북유럽 국가들은 애널리틱스 관련 탄소 실적를 줄이기 위해 그린 데이터센터의 실천을 개척하고 있습니다.
라틴아메리카와 중동 및 아프리카는 규모가 작지만 급성장하고 있는 비즈니스 기회의 보고이며, 각각 모바일 퍼스트 소비자 행동과 핀테크 혁신을 특징으로 합니다. 두 지역 모두 하이퍼스케일 확장으로 계산 비용이 낮아 고급 분석 도구에 대한 액세스가 확대되고 있습니다. 통신 데이터의 수익화와 공공 부문의 디지털 ID 프로그램은 10년 후반에 이 지역의 보급률을 높일 수 있는 주요 이용 사례로 부상하고 있습니다.
기타 혜택:
- 엑셀 형식 시장 예측(ME) 시트
- 3개월간의 애널리스트 서포트
목차
제1장 서론
- 조사의 전제조건
- 조사 범위
제2장 조사 방법
제3장 주요 요약
제4장 시장 상황
- 시장 개요
- 시장 성장 촉진요인
- AI/ML 퍼스트 보안 분석 도입
- 지수적으로 증가하는 IoT 데이터
- 클라우드 스토리지 비용 저하
- 제로 트러스트 의무화로 로그 보존 창구가 확대
- 다크 데이터를 해방하는 합성 데이터의 성장
- 시장 성장 억제요인
- 데이터 엔지니어링과 데이터 사이언스 기술 격차
- 컴플라이언스 비용 증가(GDPR(EU 개인정보보호규정), CCPA, DORA)
- 미사용 데이터에 대한 탄소 실적 과세 증가
- 가치/공급망 분석
- 규제 상황
- 기술의 전망
- Porter's Five Forces 분석
- 구매자의 협상력
- 공급기업의 협상력
- 신규 참가업체의 위협
- 대체품의 위협
- 경쟁 기업간 경쟁 관계
제5장 시장 규모와 성장 예측
- 분석 유형별
- 예측적
- 처방적
- 진단적
- 기술적
- 전개 모델별
- On-Premise
- 클라우드
- 엣지/하이브리드
- 데이터 소스별
- 구조
- 반구조화
- 비구조화
- 최종 사용자 업계별
- BFSI
- 헬스케어
- 정부기관
- 통신 사업
- 소매 및 전자상거래
- 제조업
- 기타(에너지, 미디어 등)
- 지역별
- 북미
- 미국
- 캐나다
- 멕시코
- 남미
- 브라질
- 아르헨티나
- 기타 남미
- 유럽
- 영국
- 독일
- 프랑스
- 이탈리아
- 기타 유럽
- 아시아태평양
- 중국
- 일본
- 인도
- 한국
- 기타 아시아태평양
- 중동
- 이스라엘
- 사우디아라비아
- 아랍에미리트(UAE)
- 튀르키예
- 기타 중동
- 아프리카
- 남아프리카
- 이집트
- 기타 아프리카
- 북미
제6장 경쟁 구도
- 시장 집중도
- 전략적 동향
- 시장 점유율 분석
- 기업 프로파일
- IBM Corporation
- Microsoft Corporation
- Amazon Web Services Inc.
- SAP SE
- Palantir Technologies
- Oracle Corporation
- Hewlett Packard Enterprise
- SAS Institute
- Teradata Corporation
- Micro Focus International
- Splunk Inc.
- Elastic NV
- Darktrace Plc.
- Rapid7 Inc.
- Securonix Inc.
- Databricks Inc.
- Snowflake Inc.
- Google Cloud Platform
- Cloudera Inc.
- Exasol AG
제7장 시장 기회와 장래의 전망
JHS 25.11.25The dark analytics market is valued at USD 2.6 billion in 2025 and is forecast to reach USD 6.9 billion by 2030, advancing at a 21.6% CAGR.

This growth mirrors enterprises' realization that nearly 80% of corporate information is still unstructured and therefore invisible to conventional analytics systems. Artificial intelligence, machine learning, and cloud-native platforms now combine to turn these dormant data troves into real-time operational intelligence. Rapid proliferation of Internet-of-Things (IoT) devices, lower cloud-storage costs, and expanding regulatory mandates that require extensive log retention are further accelerating demand for dark-data processing. Competitive momentum is shifting toward providers that embed large language models, vector search, and synthetic-data generation, which together enable faster model training and stronger privacy controls.
Global Dark Analytics Market Trends and Insights
AI/ML-First Security Analytics Adoption
Security-centric architectures are redefining the dark analytics market as 91% of United States banks now use AI to detect fraud, a practice that could save USD 40 billion in losses by 2027. Chief information-security officers report that advanced threats driven by adversarial AI have made autonomous response indispensable, with 78% acknowledging material impacts on their defensive posture. Financial institutions illustrate the shift through deployments such as MongoDB's vector-search integration with OpenAI, which supports real-time analysis across structured and unstructured transaction streams. Large language models now interpret intricate security logs, but the rise of shadow AI-72% of generative-AI activity occurs outside official oversight-creates novel exposure risks that only sophisticated monitoring can address.
Exponential IoT Data Growth
IoT devices are creating zettabyte-scale unstructured data at a 40% CAGR, fundamentally reshaping storage and analytics economics. Manufacturers achieve sizable gains when they harness this dark data: Jaguar Land Rover cut supply-chain query times from three weeks to 45 minutes by applying graph analytics to real-time sensor feeds. By 2025, 75% of enterprise-generated data will be processed outside traditional data centers, a trend that is driving edge adoption. Pairing edge compute with lightweight AI allows millisecond-level pattern recognition in mission-critical settings, including automated industrial machinery and connected healthcare equipment.
Skills Gap in Data Engineering & Data Science
Fifty-eight percent of data-center operators struggled to fill engineering roles during 2025, creating a bottleneck in dark analytics market deployment. Modern projects demand multidisciplinary skills that span distributed computing, domain knowledge, and machine-learning operations. Asia-Pacific's rapid digitization inflates wages for scarce professionals, putting smaller enterprises at a disadvantage. Low-code frameworks alleviate some pressure by simplifying pipeline creation, yet advanced use cases such as multimodal inference still require seasoned talent. Many firms opt for managed platforms to bridge the gap, although this introduces concentration risk and can constrain customization flexibility.
Other drivers and restraints analyzed in the detailed report include:
- Falling Cloud-Storage Costs
- Zero-Trust Mandates Expanding Log Retention Windows
- Escalating Compliance Cost (GDPR, CCPA, DORA)
For complete list of drivers and restraints, kindly check the Table Of Contents.
Segment Analysis
Prescriptive analytics is scaling at a 28.5% CAGR, underscoring a move from hindsight toward automated decision orchestration. Predictive methods retained the largest 43% slice of dark analytics market share in 2024 by providing probabilistic forecasts that feed planning cycles. The dark analytics market size attributable to prescriptive engines could swell to USD 2.3 billion by 2030 if current adoption momentum continues. Natural-language overlays now let business users pose conversational "what-if" questions, which models answer with ranked recommendations. Manufacturers have embraced this evolution, building digital twins that simulate entire supply networks so staff can test adjustments without interrupting production.
Descriptive and diagnostic techniques retain relevance because they uncover baseline patterns and root causes that feed higher-order optimization. Descriptive dashboards are improving through real-time connectors that fuse operational technology data with enterprise resource planning streams, broadening situational awareness. Diagnostic analytics in healthcare combines imaging notes, lab results, and clinician commentary to trace adverse outcomes back to specific process lapses, forming the foundation for later prescriptive interventions. Collectively, these layers reinforce each other, ensuring the dark analytics industry can serve both strategic foresight and daily tactical execution.
Cloud maintained a commanding 67% of dark analytics market share in 2024, benefiting from continuous service upgrades and pay-as-you-go elasticity. Even so, the segment representing edge and hybrid configurations is forecast to capture an extra USD 1.4 billion of dark analytics market size by 2030 as companies shift sensitive workloads closer to origin points. Demand is strongest in manufacturing, energy, and autonomous systems that require sub-second inference. The edge computing sector itself is expected to reach USD 61.54 billion in 2025, providing abundant processing headroom for analytics models.
Enterprises frequently blend public clouds with private on-premises resources, balancing sovereignty mandates against global scalability. This hybrid coordination raises architectural complexity: data synchronization, model governance, and zero-trust controls must function seamlessly across nodes. Providers now package turnkey edge gateways with embedded GPUs and lightweight orchestration to reduce integration overhead. Early adopters report faster anomaly detection in power grids and real-time adjustments of autonomous-guided vehicles, results that reinforce the economic case for distributed processing.
Dark Analytics Market Segmented by Analytics Type (Predictive, Prescriptive and More), Deployment Model, Data Source (Structured, Semi-Structured and Unstructured), End-User Vertical (BFSI, Healthcare and More) and by Geography. The Market Forecasts are Provided in Terms of Value (USD).
Geography Analysis
North America captured 37% of dark analytics market size in 2024 owing to its mature cloud ecosystem, early AI uptake, and supportive policy environment. Federal agencies emphasize secure data-sharing, encouraging enterprises to adopt privacy-enhanced analytics frameworks. Heavy investments in specialized hardware underline the region's commitment: Oracle alone earmarked USD 40 billion for Nvidia accelerators to back OpenAI's Texas facility, a move expected to reinforce regional leadership in AI compute. Canada focuses on natural-resources optimization, while Mexico pushes analytics in automotive and electronics manufacturing to bolster export competitiveness.
Asia-Pacific is advancing at a 24.4% CAGR as governments throughout China, India, and Southeast Asia finance next-generation data centers and talent pipelines. China accounts for 37.5% of regional big-data spending, leveraging sovereign clouds that align with national cybersecurity regulations. India's IT-services sector exports turnkey analytics solutions worldwide, using cost advantages and deep engineering pools to capture incremental demand. Japan and South Korea concentrate on industrial automation, exploiting edge AI for high-precision robotics and quality assurance. Cross-border data-flow rules remain a challenge, prompting multinationals to deploy localization strategies such as in-country edge clusters.
Europe maintains meaningful share despite stringent GDPR and proliferating AI-governance proposals. The dark analytics market benefits from legacy manufacturing bases across Germany, France, and Italy that seek predictive maintenance to lift asset uptime. DORA regulations are raising resilience standards, thereby increasing demand for advanced analytics that evaluates ICT incidents and supply-chain exposures. The United Kingdom, through its financial-services focus, accelerates adoption of synthetic data for model validation, while Nordic nations pioneer green-data-center practices to reduce analytics-related carbon footprints.
Collectively, Latin America and the Middle East & Africa represent smaller but fast-growing opportunity pools, each characterized by mobile-first consumer behaviour and fintech innovation. Both regions benefit from hyperscale expansions that lower compute costs and broaden access to sophisticated analytics tools. Telecommunications data monetization and public-sector digital identity programs are emerging as primary use cases that could elevate regional penetration in the latter half of the decade.
- IBM Corporation
- Microsoft Corporation
- Amazon Web Services Inc.
- SAP SE
- Palantir Technologies
- Oracle Corporation
- Hewlett Packard Enterprise
- SAS Institute
- Teradata Corporation
- Micro Focus International
- Splunk Inc.
- Elastic N.V.
- Darktrace Plc.
- Rapid7 Inc.
- Securonix Inc.
- Databricks Inc.
- Snowflake Inc.
- Google Cloud Platform
- Cloudera Inc.
- Exasol AG
Additional Benefits:
- The market estimate (ME) sheet in Excel format
- 3 months of analyst support
TABLE OF CONTENTS
1 INTRODUCTION
- 1.1 Study Assumptions
- 1.2 Scope of the Study
2 RESEARCH METHODOLOGY
3 EXECUTIVE SUMMARY
4 MARKET LANDSCAPE
- 4.1 Market Overview
- 4.2 Market Drivers
- 4.2.1 AI/ML-first security analytics adoption
- 4.2.2 Exponential IoT data growth
- 4.2.3 Falling cloud-storage costs
- 4.2.4 Zero-trust mandates expanding log retention windows
- 4.2.5 Growth of synthetic data to unlock dark data
- 4.3 Market Restraints
- 4.3.1 Skills gap in data engineering and data-science
- 4.3.2 Escalating compliance cost (GDPR, CCPA, DORA)
- 4.3.3 Rising carbon-footprint taxes on data at rest
- 4.4 Value / Supply-Chain Analysis
- 4.5 Regulatory Landscape
- 4.6 Technological Outlook
- 4.7 Porter's Five Forces Analysis
- 4.7.1 Bargaining Power of Buyers
- 4.7.2 Bargaining Power of Suppliers
- 4.7.3 Threat of New Entrants
- 4.7.4 Threat of Substitutes
- 4.7.5 Intensity of Competitive Rivalry
5 MARKET SIZE AND GROWTH FORECASTS (VALUE)
- 5.1 By Analytics Type
- 5.1.1 Predictive
- 5.1.2 Prescriptive
- 5.1.3 Diagnostic
- 5.1.4 Descriptive
- 5.2 By Deployment Model
- 5.2.1 On-premise
- 5.2.2 Cloud
- 5.2.3 Edge / Hybrid
- 5.3 By Data Source
- 5.3.1 Structured
- 5.3.2 Semi-Structured
- 5.3.3 Unstructured
- 5.4 By End-user Vertical
- 5.4.1 BFSI
- 5.4.2 Healthcare
- 5.4.3 Government
- 5.4.4 Telecommunications
- 5.4.5 Retail and E-commerce
- 5.4.6 Manufacturing
- 5.4.7 Others (Energy, Media, etc.)
- 5.5 By Geography
- 5.5.1 North America
- 5.5.1.1 United States
- 5.5.1.2 Canada
- 5.5.1.3 Mexico
- 5.5.2 South America
- 5.5.2.1 Brazil
- 5.5.2.2 Argentina
- 5.5.2.3 Rest of South America
- 5.5.3 Europe
- 5.5.3.1 United Kingdom
- 5.5.3.2 Germany
- 5.5.3.3 France
- 5.5.3.4 Italy
- 5.5.3.5 Rest of Europe
- 5.5.4 Asia-Pacific
- 5.5.4.1 China
- 5.5.4.2 Japan
- 5.5.4.3 India
- 5.5.4.4 South Korea
- 5.5.4.5 Rest of Asia-Pacific
- 5.5.5 Middle East
- 5.5.5.1 Israel
- 5.5.5.2 Saudi Arabia
- 5.5.5.3 United Arab Emirates
- 5.5.5.4 Turkey
- 5.5.5.5 Rest of Middle East
- 5.5.6 Africa
- 5.5.6.1 South Africa
- 5.5.6.2 Egypt
- 5.5.6.3 Rest of Africa
- 5.5.1 North America
6 COMPETITIVE LANDSCAPE
- 6.1 Market Concentration
- 6.2 Strategic Moves
- 6.3 Market Share Analysis
- 6.4 Company Profiles {(includes Global level Overview, Market level overview, Core Segments, Financials as available, Strategic Information, Market Rank/Share for key companies, Products and Services, and Recent Developments)}
- 6.4.1 IBM Corporation
- 6.4.2 Microsoft Corporation
- 6.4.3 Amazon Web Services Inc.
- 6.4.4 SAP SE
- 6.4.5 Palantir Technologies
- 6.4.6 Oracle Corporation
- 6.4.7 Hewlett Packard Enterprise
- 6.4.8 SAS Institute
- 6.4.9 Teradata Corporation
- 6.4.10 Micro Focus International
- 6.4.11 Splunk Inc.
- 6.4.12 Elastic N.V.
- 6.4.13 Darktrace Plc.
- 6.4.14 Rapid7 Inc.
- 6.4.15 Securonix Inc.
- 6.4.16 Databricks Inc.
- 6.4.17 Snowflake Inc.
- 6.4.18 Google Cloud Platform
- 6.4.19 Cloudera Inc.
- 6.4.20 Exasol AG
7 MARKET OPPORTUNITIES AND FUTURE OUTLOOK
- 7.1 White-space and Unmet-need Assessment