|
시장보고서
상품코드
1851918
쓰레기봉투 시장 : 시장 점유율 분석, 산업 동향, 통계, 성장 예측(2025-2030년)Trash Bags - Market Share Analysis, Industry Trends & Statistics, Growth Forecasts (2025 - 2030) |
||||||
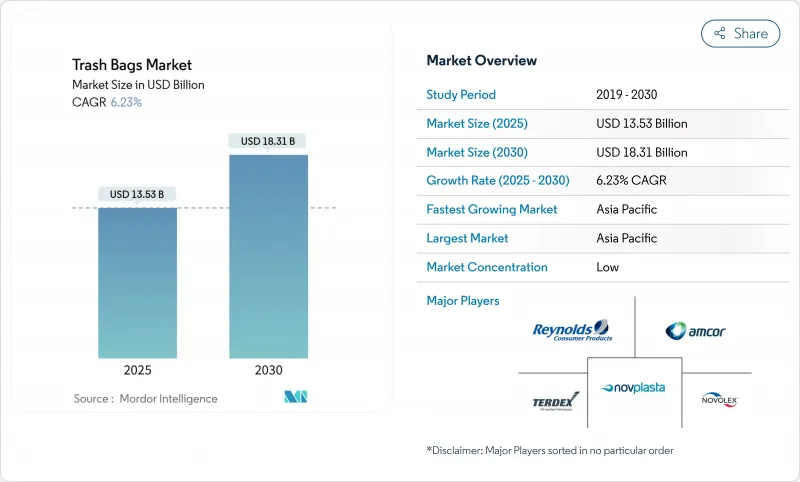
쓰레기봉투 시장 규모는 2025년에 135억 3,000만 달러로 추정되고, 2030년에는 183억 1,000만 달러에 이를 전망이며, CAGR 6.23%로 성장할 것으로 예측됩니다.
급속한 도시화로 지자체의 고형 폐기물량이 증가하는 한편, PAYT(pay-as-you-throw) 제도나 생산자 책임 규칙의 엄격화에 의해 제품 사양이 재정의되어 고급 적합 라이너 수요가 높아지고 있습니다. 아시아태평양은 중산계급 인구 확대 및 인프라 정비의 혜택을 받아 여전히 최대 소비국입니다. 북미와 유럽의 성숙 시장은 일회용 플라스틱 규제의 압력에 노출되어 재생 및 바이오 필름 등급으로의 이동을 가속화하고 있습니다. 동시에, 에틸렌의 가격 변동이 컨버터의 마진을 계속 압박하고 있으며, 제조업체 간의 통합이 가속화되고 있습니다.
세계의 쓰레기봉투 시장 동향 및 인사이트
도시 폐기물의 대량 발생 및 원활한 회수의 필요성
도시의 고형 폐기물량은 2023년에 21억 톤에 이르렀고, 2050년에는 38억 톤에 달할 전망입니다. 도시는 현재 자동 트럭에 맞는 펑크성이 내장된 균일한 라이너를 지정하고 있으며 쓰레기봉투 시장의 성장에 박차를 가하고 있습니다. IoT 대응 휴지통과 AI 루트 최적화의 조합은 파일럿 프로젝트에서 연료 사용량을 28% 줄이고 수집 효율을 41.5% 향상시켰습니다. 이러한 변화로 고열 기후에서도 형상을 유지하고 장기 보관에 의한 열화에 견디는 필름에 대한 수요가 높아지고 있습니다.
팬데믹 후 위생 중심 소비자 행동
병원은 2024년에 매립지에서 2억 6,410만 파운드의 폐기물을 전환하여 68%가 지속 가능한 구매 규칙을 채택했습니다. 달걀 껍질이 들어간 EGU 봉투과 같은 프리미엄 SKU는 2025년에 이 수요를 캡처하기 위해 데뷔했습니다. 접객 분야에서도 유사한 동향이 평균 판매 가격을 인상하여 시설용 부문의 CAGR 9.67%를 지원하고 있습니다.
일회용 플라스틱 금지 및 확대 생산자 책임
캘리포니아의 SB 54는 2032년까지 일회용 플라스틱을 25% 절감해야 하며, 연간 5억 달러의 정화 기금을 요구하고 있습니다. 브리티시 컬럼비아 주와 EU의 유사한 의무화는 생산자에게 폐기 비용을 전가하고 재활용 소재와 퇴비화 가능한 대체품에 대한 투자를 강화하고 있습니다. 컴플라이언스의 복잡성은 비용을 증가시키고 이익률이 낮은 공급업체의 접근을 제한하며 쓰레기봉투 시장의 단기적인 확대를 억제합니다.
부문 분석
2024년 매출의 64.34%를 주택 부문이 차지했으며, 2030년까지 연평균 복합 성장률(CAGR)은 9.67%로 전망되며, 헬스케어, 접객 및 교육 시설 사용자가 견인했습니다. 병원의 지속 가능한 조달 정책과 보다 엄격한 감염 제어 프로토콜이 쓰레기봉투 시장의 항균 및 방누 라이너 수요를 견인하고 있습니다. 시설 바이어는 가격보다 성능과 컴플라이언스를 중시하고 재활용 소재와 바이오베이스 소재를 사용한 프리미엄 SKU를 지지하고 있습니다. 주택용 수요는 PAYT 프로그램과 브랜드 충성도에 의해 지원되는 수량 주도형이지만 가격에 민감한 것이 제약이 되고 있습니다.
기업 수요가 증가함에 따라 공급업체는 사양 기반 제품을 연마하여 다년간 계약을 확보할 것을 촉구하고 있습니다. 동시에 가정용 봉투 구매자는 향기로운 봉투 및 강화 봉투로의 교체를 늘리고 평균 입찰가를 늘리고 있습니다. 시정부가 차별화된 회수 흐름을 도입함에 따라 두 사용자 그룹 모두 인증된 색으로 구분된 라이너를 향해 쓰레기봉투 시장이 더욱 확대되고 있습니다.
2024년 쓰레기봉투 시장 점유율은 LDPE가 38.67%로 최고였습니다. 그러나 PLA 및 PHA와 같은 바이오 플라스틱의 CAGR은 10.54%에 이를 것으로 예측됩니다. 이는 기업의 넷 제로 서약과 네이처웍스사의 태국에서 3억 5,000만 달러의 PLA 플랜트와 같은 투자로 인한 것입니다. 퇴비가 가능한 등급은 분해 속도가 느리고 습도가 높은 열대 지역에서는 여전히 늦었지만 규제 우대 조치로 비용 격차가 줄어들고 있습니다. 한편 HDPE와 LLDPE 필름은 시장과의 관련성을 유지하기 위해 포스트 컨슈머 수지의 통합을 추진하고 있습니다.
장비 업그레이드 및 인증 획득 장애물은 신속한 재료 전환을 억제하고 있지만 매립지 과징금과 EPR 수수료 상승은 화석 유래 수지의 비용 우위를 계속 침식하고 있습니다. 순환 컨텐츠와 기계적 강도를 융합시킬 수 있는 공급업체는 지속 가능한 변종이 확대되는 쓰레기봉투 시장 규모를 확보하기 위한 최상의 위치에 있습니다.
지역 분석
아시아태평양은 2024년에 세계 수익의 40.65%를 창출했으며, 2030년까지 CAGR 8.12%로 성장할 전망입니다. 한국과 일본에서는 AI를 활용한 선별 로봇이 재생 HDPE의 이용 가능성을 높이고 있지만, 열대 기후는 컴포스터블 봉투의 전개를 복잡하게 하고 있습니다. 각국의 재활용 금지령과 재활용 목표는 다양하며 세계 공급업체에게는 유연한 조달 전략이 요구됩니다.
북미의 성숙한 인프라는 캘리포니아의 SB 54와 같은 EPR 방법 하에서 진화하고 있으며, 재활용 및 바이 라이너에 대한 축족을 촉진합니다. 6,000개 커뮤니티의 PAYT 프로그램은 현재 인증된 봉투의 크기를 규정하고, 안정적인 단위 수요를 지원하며, 고가치 믹스를 지원합니다. 2025년 4월에 출시된 Glad의 두 배 강한 봉투를 포함한 프리미엄 혁신은 위생 의식이 높은 가정을 지원합니다.
유럽의 순환형 경제 의제는 적극적인 재활용 함량 의무화에 박차를 가하고 있습니다. 독일의 재사용 수영장과 프랑스의 보증금 수익 제도는 폐기물 감축을 위한 지역 전체의 행운을 상징합니다. 사이카 플렉스와 같은 패키징 그룹은 현재 최소 5%의 PCR을 포함한 100% 재활용 가능한 필름을 판매하고 있으며, 지속 가능한 기준의 깃발로서 유럽의 지위를 확고히 하고 있습니다.
기타 혜택
- 엑셀 형식 시장 예측(ME) 시트
- 3개월간의 애널리스트 서포트
목차
제1장 서론
- 조사의 전제조건 및 시장 정의
- 조사 범위
제2장 조사 방법
제3장 주요 요약
제4장 시장 상황
- 시장 개요
- 시장 성장 촉진요인
- 도시에서의 많은 폐기물 발생량 및 원활한 수집의 필요성
- 팬데믹 후의 위생 중심 소비자 행동
- 지자체의 종량 과금(PAYT) 모델의 대두
- 누출 없는 라이너를 요구하는 온라인 식료품의 확대
- 바이오플라스틱의 LDPE 및 LLDPE 원료와의 가격 패리티
- AI 대응 로봇 선별기가 재생 HDPE 공급 촉진
- 시장 성장 억제요인
- 플라스틱 일회용 금지 및 확대 생산자 책임
- 불안정한 에틸렌 가격이 컨버터의 마진 압박
- 습도가 높은 기후에서 컴포스터블 백의 성능 격차
- 소매 체인에서 리필 및 재이용 스테이션의 시험적 이용의 확대
- 공급망 분석
- 규제 상황
- 기술의 전망
- Porter's Five Forces
- 신규 참가업체의 위협
- 구매자의 협상력
- 공급기업의 협상력
- 대체품의 위협
- 경쟁 기업 간 경쟁 관계
제5장 시장 규모 및 성장 예측
- 최종 사용자별
- 주택용
- 시설(HoReCa, 헬스케어, 교육)
- 상업 및 산업용
- 소재 유형별
- 고밀도 폴리에틸렌(HDPE)
- 저밀도 폴리에틸렌(LDPE)
- 선형 저밀도 폴리에틸렌(LLDPE)
- 바이오베이스 및 생분해성 플라스틱(PLA, PBAT, PHA)
- 용량 및 봉투 사이즈별
- 10갤런까지
- 13-30갤런
- 30-55갤런
- 55갤런 이상
- 판매 채널별
- 소매(슈퍼마켓, 편의점 및 온라인)
- B2B 및 기관조달
- 유통 및 도매
- 지역별
- 북미
- 미국
- 캐나다
- 멕시코
- 유럽
- 독일
- 영국
- 프랑스
- 이탈리아
- 스페인
- 러시아
- 기타 유럽
- 아시아태평양
- 중국
- 인도
- 일본
- 한국
- 호주, 뉴질랜드
- 기타 아시아태평양
- 중동 및 아프리카
- 중동
- 아랍에미리트(UAE)
- 사우디아라비아
- 튀르키예
- 기타 중동
- 아프리카
- 남아프리카
- 나이지리아
- 이집트
- 기타 아프리카
- 남미
- 브라질
- 아르헨티나
- 기타 남미
- 북미
제6장 경쟁 구도
- 시장 집중도
- 전략적 동향
- 시장 점유율 분석
- 기업 프로파일
- Amcor Plc
- Reynolds Consumer Products(Hefty)
- The Clorox Company(Glad)
- Novolex Holdings LLC
- Inteplast Group Ltd.
- Poly-America LP
- Pack-It BV
- Kemii Garbage Bag Co. Ltd.
- Cosmoplast Industrial Co. LLC
- Luban Packing LLC
- International Plastics Inc.
- Novplasta sro
- Terdex GmbH
- Simplehuman LLC
- Ruffies/Pactiv Evergreen
- WasteZero Inc.
- Al-Sinai Plastic Factory
- Abu Dawood Group(Pekoe)
- Thai Plastic Bag Industry Co. Ltd.
- Crown Poly Inc.
제7장 시장 기회 및 향후 전망
AJY 25.11.19The trash bags market size is valued at USD 13.53 billion in 2025 and is projected to reach USD 18.31 billion by 2030, advancing at a 6.23% CAGR.

Rapid urbanization is swelling municipal solid-waste volumes, while pay-as-you-throw (PAYT) schemes and stricter producer-responsibility rules are redefining product specifications and boosting demand for premium, compliant liners. Asia-Pacific remains the largest regional consumer, benefitting from expanding middle-class populations and infrastructure upgrades. Mature markets in North America and Europe, pressured by single-use-plastic curbs, are accelerating shifts toward recycled and bio-based film grades. At the same time, volatile ethylene pricing continues to squeeze converter margins, reinforcing consolidation among producers.
Global Trash Bags Market Trends and Insights
High-Urban Waste Generation and Need for Seamless Collection
Municipal solid-waste volumes reached 2.1 billion t in 2023 and are on track for 3.8 billion t by 2050. Cities now specify puncture-resistant, uniform liners compatible with automated trucks, spurring growth of the trash bags market. IoT-enabled bins paired with AI route optimization have cut fuel use 28% and lifted collection efficiency 41.5% in pilot projects. These shifts increase demand for films that hold shape in high-heat climates and resist extended storage degradation.
Hygiene-Centric Consumer Behaviour Post-Pandemics
Hospitals diverted 264.1 million lb of waste from landfills in 2024, and 68% adopted sustainable purchasing rules, pushing institutional buyers toward antimicrobial, odor-neutralizing liners. Premium SKUs such as eggshell-infused EGU bags debuted in 2025 to capture this demand. Similar trends in hospitality are lifting average selling prices and underpinning the institutional segment's 9.67% CAGR.
Single-Use-Plastic Bans and Extended-Producer Responsibility
California's SB 54 compels a 25% cut in single-use plastics by 2032 and requires USD 500 million in annual cleanup funding. Similar mandates in British Columbia and the EU shift disposal costs to producers, forcing investments in recycled content and compostable alternatives. Compliance complexity elevates costs and limits access for low-margin suppliers, restraining near-term expansion of the trash bags market.
Other drivers and restraints analyzed in the detailed report include:
- Rise of PAYT Municipal Fee Models
- Expansion of Online Grocery Demanding Leak-Proof Liners
- Volatile Ethylene Prices Squeezing Converter Margins
For complete list of drivers and restraints, kindly check the Table Of Contents.
Segment Analysis
Institutional users-healthcare, hospitality and education-propelled 9.67% CAGR to 2030, even as the residential segment retained 64.34% of 2024 revenue. Hospitals' sustainable procurement policies and stricter infection-control protocols are driving demand for antimicrobial, leak-proof liners in the trash bags market. Institutional buyers value performance and compliance over price, supporting premium SKUs with recycled or bio-based content. Residential demand remains volume-driven, buoyed by PAYT programs and brand loyalty but constrained by price sensitivity.
The institutional upsurge encourages suppliers to refine spec-based offerings and secure multi-year contracts. At the same time, household buyers increasingly trade up to scented or reinforced bags, expanding average unit values. As city governments introduce differentiated collection streams, both user groups are turning to certified color-coded liners, further enlarging the trash bags market.
LDPE held the largest 38.67% trash bags market share in 2024 thanks to price and process familiarity. Yet bio-based plastics such as PLA and PHA are poised for 10.54% CAGR, catalyzed by corporate net-zero pledges and investments like NatureWorks' USD 350 million PLA plant in Thailand. Compostable grades still lag in humid tropics where degradation rates slow, but regulatory incentives are narrowing cost gaps. HDPE and LLDPE films, meanwhile, are integrating post-consumer resin to maintain market relevance.
Equipment upgrades and certification hurdles are tempering a swift material shift, yet rising landfill levies and EPR fees continue to erode the cost advantage of fossil-based resins. Suppliers that can merge circular content with mechanical strength are best positioned to capture the expanding trash bags market size for sustainable variants.
The Trash Bags Market Report is Segmented by End-User (Residential, Institutional, Commercial and Industrial), Material Type (HDPE, LDPE, LLDPE, Bio-based/Biodegradable Plastics), Capacity/Bag Size (Up To 10 Gallon, 13-30 Gallon, 30-55 Gallon, Above 55 Gallon), Sales Channel (Retail, B2B/Institutional Procurement, Distribution/Wholesale), and Geography. The Market Forecasts are Provided in Terms of Value (USD).
Geography Analysis
Asia-Pacific generated 40.65% of global revenue in 2024 and is on track for an 8.12% CAGR to 2030, driven by urban sprawl in China and India and widening middle-class consumption. AI-enabled sorting robots in South Korea and Japan are lifting recycled-HDPE availability, while tropical climates complicate compostable-bag deployment. Diverse national bans and recycling targets require flexible sourcing strategies for global suppliers.
North America's mature infrastructure is evolving under EPR legislation such as California's SB 54, prompting a pivot to recycled and bio-based liners. PAYT programs in 6,000 communities now dictate certified bag sizes, underpinning stable unit demand and supporting a higher-value mix. Premium innovations, including Glad's 2X stronger bags launched in April 2025, cater to hygiene-aware households.
Europe's circular-economy agenda is spurring aggressive recycled-content mandates. Germany's reuse pools and France's incoming deposit-return schemes exemplify region-wide momentum toward waste reduction. Packaging groups such as Saica Flex now market 100% recyclable films with minimum 5% PCR, consolidating Europe's position as a bellwether for sustainable standards.
- Amcor Plc
- Reynolds Consumer Products (Hefty)
- The Clorox Company (Glad)
- Novolex Holdings LLC
- Inteplast Group Ltd.
- Poly-America LP
- Pack-It BV
- Kemii Garbage Bag Co. Ltd.
- Cosmoplast Industrial Co. LLC
- Luban Packing LLC
- International Plastics Inc.
- Novplasta s.r.o.
- Terdex GmbH
- Simplehuman LLC
- Ruffies / Pactiv Evergreen
- WasteZero Inc.
- Al-Sinai Plastic Factory
- Abu Dawood Group (Pekoe)
- Thai Plastic Bag Industry Co. Ltd.
- Crown Poly Inc.
Additional Benefits:
- The market estimate (ME) sheet in Excel format
- 3 months of analyst support
TABLE OF CONTENTS
1 INTRODUCTION
- 1.1 Study Assumptions and Market Definition
- 1.2 Scope of the Study
2 RESEARCH METHODOLOGY
3 EXECUTIVE SUMMARY
4 MARKET LANDSCAPE
- 4.1 Market Overview
- 4.2 Market Drivers
- 4.2.1 High-urban waste generation and need for seamless collection
- 4.2.2 Hygiene-centric consumer behaviour post-pandemics
- 4.2.3 Rise of pay-as-you-throw (PAYT) municipal fee models
- 4.2.4 Expansion of on-line grocery demanding leak-proof liners
- 4.2.5 Bioplastic price parity with LDPE/LLDPE feedstocks
- 4.2.6 AI-enabled robotic sorters boosting recycled-HDPE supply
- 4.3 Market Restraints
- 4.3.1 Single-use-plastic bans and extended-producer?responsibility
- 4.3.2 Volatile ethylene prices squeezing converter margins
- 4.3.3 Compostable-bag performance gaps in humid climates
- 4.3.4 Growing refill/reuse station pilots in retail chains
- 4.4 Supply-Chain Analysis
- 4.5 Regulatory Landscape
- 4.6 Technological Outlook
- 4.7 Porter's Five Forces
- 4.7.1 Threat of New Entrants
- 4.7.2 Bargaining Power of Buyers
- 4.7.3 Bargaining Power of Suppliers
- 4.7.4 Threat of Substitutes
- 4.7.5 Competitive Rivalry
5 MARKET SIZE AND GROWTH FORECASTS (VALUE)
- 5.1 By End-user
- 5.1.1 Residential
- 5.1.2 Institutional (HoReCa, Healthcare, Education)
- 5.1.3 Commercial and Industrial
- 5.2 By Material Type
- 5.2.1 High-Density Polyethylene (HDPE)
- 5.2.2 Low-Density Polyethylene (LDPE)
- 5.2.3 Linear Low-Density Polyethylene (LLDPE)
- 5.2.4 Bio-based/Biodegradable Plastics (PLA, PBAT, PHA)
- 5.3 By Capacity / Bag Size
- 5.3.1 Up to 10 Gallon
- 5.3.2 13 - 30 Gallon
- 5.3.3 30 - 55 Gallon
- 5.3.4 Above 55 Gallon
- 5.4 By Sales Channel
- 5.4.1 Retail (Supermarkets, Convenience, Online)
- 5.4.2 B2B / Institutional Procurement
- 5.4.3 Distribution / Wholesale
- 5.5 By Geography
- 5.5.1 North America
- 5.5.1.1 United States
- 5.5.1.2 Canada
- 5.5.1.3 Mexico
- 5.5.2 Europe
- 5.5.2.1 Germany
- 5.5.2.2 United Kingdom
- 5.5.2.3 France
- 5.5.2.4 Italy
- 5.5.2.5 Spain
- 5.5.2.6 Russia
- 5.5.2.7 Rest of Europe
- 5.5.3 Asia-Pacific
- 5.5.3.1 China
- 5.5.3.2 India
- 5.5.3.3 Japan
- 5.5.3.4 South Korea
- 5.5.3.5 Australia and New Zealand
- 5.5.3.6 Rest of Asia-Pacific
- 5.5.4 Middle East and Africa
- 5.5.4.1 Middle East
- 5.5.4.1.1 United Arab Emirates
- 5.5.4.1.2 Saudi Arabia
- 5.5.4.1.3 Turkey
- 5.5.4.1.4 Rest of Middle East
- 5.5.4.2 Africa
- 5.5.4.2.1 South Africa
- 5.5.4.2.2 Nigeria
- 5.5.4.2.3 Egypt
- 5.5.4.2.4 Rest of Africa
- 5.5.5 South America
- 5.5.5.1 Brazil
- 5.5.5.2 Argentina
- 5.5.5.3 Rest of South America
- 5.5.1 North America
6 COMPETITIVE LANDSCAPE
- 6.1 Market Concentration
- 6.2 Strategic Moves
- 6.3 Market Share Analysis
- 6.4 Company Profiles (includes Global level Overview, Market level overview, Core Segments, Financials as available, Strategic Information, Market Rank/Share for key companies, Products and Services, and Recent Developments)
- 6.4.1 Amcor Plc
- 6.4.2 Reynolds Consumer Products (Hefty)
- 6.4.3 The Clorox Company (Glad)
- 6.4.4 Novolex Holdings LLC
- 6.4.5 Inteplast Group Ltd.
- 6.4.6 Poly-America LP
- 6.4.7 Pack-It BV
- 6.4.8 Kemii Garbage Bag Co. Ltd.
- 6.4.9 Cosmoplast Industrial Co. LLC
- 6.4.10 Luban Packing LLC
- 6.4.11 International Plastics Inc.
- 6.4.12 Novplasta s.r.o.
- 6.4.13 Terdex GmbH
- 6.4.14 Simplehuman LLC
- 6.4.15 Ruffies / Pactiv Evergreen
- 6.4.16 WasteZero Inc.
- 6.4.17 Al-Sinai Plastic Factory
- 6.4.18 Abu Dawood Group (Pekoe)
- 6.4.19 Thai Plastic Bag Industry Co. Ltd.
- 6.4.20 Crown Poly Inc.
7 MARKET OPPORTUNITIES AND FUTURE OUTLOOK
- 7.1 White-space and Unmet-need Assessment