


|
시장보고서
상품코드
1852159
크실렌 : 시장 점유율 분석, 산업 동향, 통계, 성장 예측(2025-2030년)Xylene - Market Share Analysis, Industry Trends & Statistics, Growth Forecasts (2025 - 2030) |
||||||
크실렌 시장 규모는 2025년에 5,234만 톤이 되고, 2030년에는 6,130만 톤에 이를 것으로 예상되며, CAGR은 4.02%를 나타낼 전망입니다.

성장의 배경은 폴리에스테르 생산에서 파라크실렌의 지배적인 역할, 아시아와 중동에서의 대규모 종합 방향족 프로젝트, 북미에서 엔지니어링 플라스틱 수요 증가가 있습니다. 중국과 인도 콤비나트의 급속한 설비투자가 지역 자급률을 높이는 반면, 규제와 브랜드 소유자의 압력이 강해지고 있는 가운데 바이오 화학물질이 초기 단계에서 기세를 늘리고 있습니다. 마진의 전망은 나프타 가격의 변동에 달려 있지만, 후방 통합형 제조업체는 정제, 방향족, 유도품의 각 체인에서 가치를 획득하고 있습니다. 경쟁 우위는 원료 유연성, 디지털 최적화, 신뢰할 수 있는 탈탄소화 로드맵을 결합한 기업에 기울고 있습니다.
세계의 크실렌 시장 동향과 인사이트
PET 수지 수요의 급증으로 아시아 파라자일렌 소비 촉진
폴리에스테르의 대량 생산이 원료의 흐름을 재조합하고 있습니다. 중국은 2024년과 2028년 사이에 파라크실렌의 대량 생산 능력을 계획하고 있습니다. 이 증설은 급성장하는 PET 필름과 병 생산에 대응하는 PTA 공급을 확보합니다. 생산자들은 비용과 물류를 관리하기 위해 수직 통합을 진행하고 있는 반면, 나프타 수입 증가는 아시아 부족을 보완합니다.
중동과 아시아 전역의 통합 방향족 복합체에서의 능력 확장
사우디 아람코의 아밀랄 콤플렉스와 같은 프로젝트는 정제와 하류의 아로마틱스를 결합하여 원료 절약과 높은 파라크실렌 수율을 실현하고 있습니다. 공유 유틸리티, 고급 촉매 및 실시간 최적화를 통해 단위 비용을 줄이고 지역 수출 경쟁력을 강화합니다. 이 메가 사이트는 공급 균형을 변화시키고 오래된 독립 플랜트에 간소화 및 업그레이드를 강요합니다.
유럽과 북미에서 방향족 용매의 사용을 제한하는 엄격한 VOC 규정
규제 당국은 VOC 규제를 소비자용 페인트, 클리너, 실내 제품으로 확대하고 있습니다. 이 규정을 준수하기 위해 개질업체는 전체 화학물질의 첨가량을 줄이고 재설계해야 하며 성숙한 경제권에서의 성장이 제한됩니다. 생산자는 시장 접근을 유지하기 위해 저 방향족 또는 바이오베이스 블렌드로 축발을 옮깁니다.
부문 분석
파라크실렌은 PTA 및 PET 체인에서 필수적인 역할로 2024년 크실렌 시장 점유율의 90%를 차지했습니다. 다운스트림로의 견고한 통합으로 대형 정유업체는 마진의 변동을 헤지하고 왕성한 수요를 확보하고 있습니다. Ortho-자일렌은 훨씬 작고 무수 프탈산의 유연한 가소제 수요를 배경으로 CAGR 4.09%로 성장을 이끌고 있습니다. Meta-자일렌은 틈새 코팅 및 특수 수지에 해당하며 혼합 크실렌은 이성질체 분리공급 옵션성을 제공합니다. 촉매의 진보와 이성화 장치를 통해 사업자는 가격 신호에 맞게 생산량을 미세 조정할 수 있어 상품화된 제품군 내에서 수익성을 높일 수 있습니다. 이 적응 능력은 파생물 거래의 흐름이 재구성 되더라도 파라 크실렌의 중심성을 유지합니다.
생산자는 아시아에서 파라크실렌 추출장치의 디보틀넥을 계속하여 규모의 경제를 이용하고 확대하는 PET병 주문에 대응하고 있습니다. 북미 공급업체는 낮은 아세트알데히드 생성을 요구하는 필름 용도의 부가가치 등급을 강조합니다. 유럽의 정유업자는 배출규제의 강화에 대응하기 위해 혼합용매를 수소화용매로 향하는 경향을 강화하고 있으며, 이 동향은 2030년까지 각 이성체에 특화된 수요를 개척하게 됩니다.
2024년 크실렌 시장의 85%를 차지한 것은 테크니컬 그레이드이며, 이는 코팅제 배합업자, 접착제 배합업자, 산업용 세정업자가 비용, 입수성, 중간 레인지의 용해성을 우선했기 때문입니다. 리포메이트와 BTX 풀에서 간단한 제조 경로는 풍부한 공급과 경쟁 가격을 제공합니다. 신흥국의 대량 소비자는 인프라와 제조의 급증기에 이 양을 흡수하여 중심적인 역할을 강화하고 있습니다.
반대로 고순도 99.9% 재료는 반도체, 의약품, 고기능 수지 용도로 CAGR 4.7%를 나타낼 전망입니다. 엄격한 사양을 충족하기 위해서는 고급 정석, 증류, 온스트림 분석이 요구되어 높은 진입 장벽과 매력적인 이익을 창출하고 있습니다. 통합 실험실 서비스와 견고한 품질 시스템을 갖춘 생산자는이 특수 차선을 활용하여 범용 제품에 비해 톤당 EBITDA를 높입니다.
지역 분석
아시아태평양은 2024년 크실렌 시장의 55%를 차지했고 2030년까지 연률 4.51%의 성장을 이어갑니다. 중국의 파라크실렌 능력은 2028년까지 연산 2,500만 톤 확장되어, 지역의 자급률을 지지하고, 인도의 PET 라인은 왕성한 음료 수요를 공급합니다. ASEAN 주요 국가는 부족을 보충하기 위해 혼합 크실렌을 수입하고 아시아 지역 내 무역 흐름을 유지하고 있습니다. 경쟁의 격화는 스프레드를 축소시키고, 제휴와 다운스트림 PTA의 연결에 박차를 가하고 있습니다.
북미는 저성장하면서 안정적입니다. 혈암 기반 원료 경제로 정제업자는 유리한 BTX 수율을 얻습니다. 자동차의 경량화 규제는 엔지니어링 플라스틱의 사용을 증가시키고 페인트의 엄격한 VOC 규제에도 불구하고 유도체 수요를 강화하고 있습니다. 규제의 명확화와 확립된 로지스틱스가 상합해, 신공장 건설보다 오히려 디보틀넥 증가를 촉진합니다.
유럽의 성숙한 수요 환경은 지속가능성 지침 하에서 재구성되고 있습니다. 독일의 화학 클러스터는 고효율 공정을 연마하고 영국과 프랑스는 순환 솔벤트 회수 장비를 도입했으며 EU 전체의 REACH 분류는 저 방향족 블렌드로의 재제조를 촉진하고 있습니다. 정책적 인센티브를 뒷받침하는 바이오 파일럿 사업은 재생 가능한 방향족으로 조기 발판을 구축하는 것을 목표로 하고 있으며, 틈새 등급은 고급 페인트 및 전자 시장을 목표로 하고 있습니다.
기타 혜택 :
- 엑셀 형식 시장 예측(ME) 시트
- 3개월의 애널리스트 지원
목차
제1장 서론
- 조사 전제조건과 시장 정의
- 조사 범위
제2장 조사 방법
제3장 주요 요약
제4장 시장 상황
- 시장 개요
- 시장 성장 촉진요인
- PET 수지 수요의 급증이 크실렌을 촉진
- 중동과 아시아에 있어서 아로마틱스 콤플렉스의 능력 확장
- 자동차의 경량화가 북미의 엔지니어링 플라스틱을 견인
- 크실렌 사용량 증가
- 공급망 변동성 속 제약회사에 의한 용제의 전략적 비축
- 시장 성장 억제요인
- 유럽과 북미에서 방향족 용제의 사용을 제한하는 엄격한 VOC 규제
- 건강 독성에 대한 우려가 산소계 용제로의 변화를 촉진
- 휘발성 나프타 가격이 생산자 마진을 압축
- 밸류체인 분석
- Porter's Five Forces 분석
- 공급기업의 협상력
- 구매자의 협상력
- 신규 참가업체의 위협
- 대체품의 위협
- 경쟁도
제5장 시장 규모와 성장 예측
- 유형별
- 오르소 크실렌
- 메타 크실렌
- 파라 크실렌
- 혼합 크실렌
- 등급별
- 일반 등급
- 고순도 등급(99.9)
- 공급원별
- 석유 베이스 크실렌
- 바이오 베이스 크실렌
- 용도별
- 용제
- 단량체
- 기타 용도
- 최종 사용자 업계별
- 플라스틱 및 폴리머
- 페인트 및 코팅
- 접착제
- 기타 최종 사용자 업계
- 지역별
- 아시아태평양
- 중국
- 인도
- 일본
- 한국
- 기타 아시아태평양
- 북미
- 미국
- 캐나다
- 멕시코
- 유럽
- 독일
- 영국
- 프랑스
- 이탈리아
- 기타 유럽
- 남미
- 브라질
- 아르헨티나
- 기타 남미
- 중동 및 아프리카
- 사우디아라비아
- 남아프리카
- 기타 중동 및 아프리카
- 아시아태평양
제6장 경쟁 구도
- 시장 집중도
- 전략적 동향
- 시장 점유율 분석
- 기업 프로파일
- Braskem
- Chevron Phillips Chemical Company LLC
- China Petrochemical Corporation
- CNPC
- ENEOS Corporation
- Exxon Mobil Corporation
- Formosa Chemicals & Fibre Corp
- FUJAN REFINING & PETROCHEMICAL COMPANY LIMITED
- GS Caltex Corporation
- Indian Oil Corporation Ltd
- INEOS AG
- LOTTE Chemical Corporation
- Mangalore Refinery and Petrochemicals limited
- MITSUBISHI GAS CHEMICAL COMPANY, INC.
- Mitsui Chemicals, Inc.
- Petro Rabigh
- PTT Global Chemical Public Company Limited
- QatarEnergy
- Reliance Industries Limited
- SK Geocentric Co., Ltd.
- S-OIL CORPORATION
- TotalEnergies
제7장 시장 기회와 향후 전망
KTH 25.11.25The xylene market size stands at 52.34 million tons in 2025 and is forecast to touch 61.3 million tons by 2030, advancing at a 4.02% CAGR.
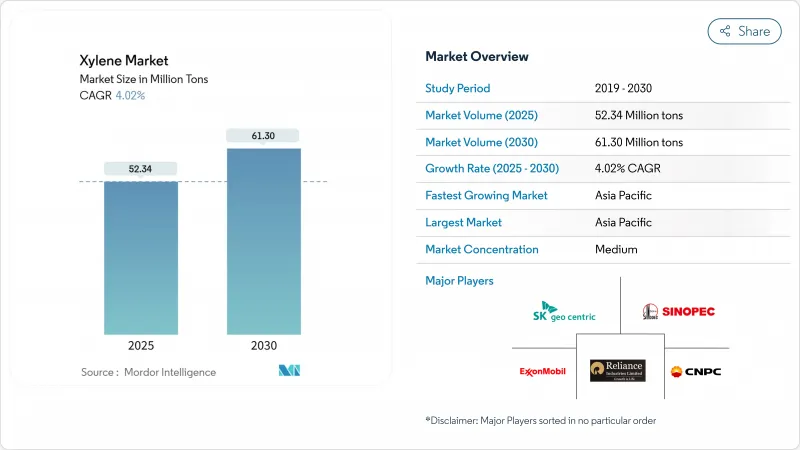
Growth rests on para-xylene's dominant role in polyester production, large-scale integrated aromatics projects across Asia and the Middle East, and rising demand for engineering plastics in North America. Rapid equipment investments in Chinese and Indian complexes are lifting regional self-sufficiency, while bio-based chemistries gain early-stage momentum as regulatory and brand-owner pressures intensify. Margin outlook hinges on naphtha price volatility, yet backward-integrated producers capture value across refining, aromatics, and derivative chains. Competitive advantage is tilting toward firms that combine feedstock flexibility, digital optimization, and credible decarbonization roadmaps.
Global Xylene Market Trends and Insights
Surging PET Resin Demand Fueling Para-xylene Consumption in Asia
Massive polyester build-outs are realigning feedstock flows. China plans to massive para-xylene capacity between 2024-2028. The escalation secures PTA supply for rapidly growing PET film and bottle output. Producers are vertically integrating to manage cost and logistics exposure, while increasing naphtha imports backfill Asian shortfalls.
Capacity Expansions in Integrated Aromatics Complexes across Middle East and Asia
Projects such as Saudi Aramco's Amiral Complex couple refining with downstream aromatics to unlock feedstock savings and high para-xylene yields. Shared utilities, advanced catalysts, and real-time optimization cut unit costs and strengthen regional export competitiveness. These mega-sites are shifting supply balances and forcing older standalone plants to rationalize or upgrade.
Stringent VOC Norms Limiting Aromatic Solvent Use in Europe and North America
Regulators are extending VOC limits to consumer paints, cleaners, and indoor products. Compliance forces reformulators to cut xylene loadings or redesign entire chemistries, constraining growth in mature economies. Producers pivot toward low-aromatic or bio-based blends to retain market access.
Other drivers and restraints analyzed in the detailed report include:
- Automotive Lightweighting Driving Engineering Plastics in North America
- Growing Usage of Xylene as Solvents and Monomers
- Health-toxicity Concerns Prompting Shift to Oxygenated Solvents
For complete list of drivers and restraints, kindly check the Table Of Contents.
Segment Analysis
Para-xylene held 90% of xylene market share in 2024, anchored by its indispensable role in PTA and PET chains. Robust downstream integration lets leading refiners hedge margin swings and assure captive demand. Ortho-xylene, though much smaller, leads growth at 4.09% CAGR on the back of flexible plasticizer demand in phthalic anhydride. Meta-xylene addresses niche coatings and specialty resins, while mixed xylene offers supply optionality for isomer separation. Catalyst advances and isomerization units let operators fine-tune output to price signals, enhancing profitability within an otherwise commoditized slate. This adaptive capability sustains para-xylene's centrality even as derivative trade flows reorganize.
Producers continue debottlenecking para-xylene extraction units in Asia to exploit economies of scale and meet swelling PET bottle orders. North American suppliers emphasize value-added grades for film applications that demand low acetaldehyde formation. European refiners increasingly channel mixed streams toward hydrogenated solvents to comply with tightening emission rules, a trend set to carve out specialized demand niches for each isomer through 2030.
Technical grade captured 85% of the xylene market in 2024 as coatings formulators, adhesive blenders, and industrial cleaners prioritize cost, availability, and mid-range solvency. Its straightforward production route from reformate and BTX pools yields abundant supply and competitive pricing. Bulk consumers in emerging economies absorb this volume for infrastructure and manufacturing surge phases, reinforcing its central role.
Conversely, high-purity 99.9% material is growing at 4.7% CAGR on semiconductor, pharmaceutical, and high-performance resin applications. Meeting its exacting specifications demands advanced crystallization, distillation, and on-stream analytics, creating high entry barriers and attractive margins. Producers with integrated lab services and robust quality systems capitalize on this specialized lane, carving higher EBITDA per ton against commodity counterparts.
The Xylene Market Report Segments the Industry by Type (Ortho-Xylene, Meta-Xylene, and More), Grade (Technical Grade and High-Purity Grade (99. 9%)), Source (Petroleum-Based Xylene and Bio-Based Xylene), Application (Solvent, Monomer, and Other Applications), End-User Industry (Plastics and Polymers, Paints and Coatings, Adhesives, and Other End-User Industries), and Geography (Asia-Pacific, North America, and More).
Geography Analysis
Asia-Pacific controlled 55% of the xylene market in 2024 and is growing 4.51% yearly to 2030. Chinese para-xylene capacity expansions of 25 million tons/year through 2028 underpin regional self-sufficiency, while Indian PET lines supply booming beverage demand. Major ASEAN economies import mixed xylenes to backfill shortfalls, sustaining intra-Asian trade flows. Intensifying competition is compressing spreads, spurring alliances and downstream PTA linkages.
North America shows stable albeit lower growth. Shale-based feedstock economics give refiners advantaged BTX yields. Automotive lightweighting regulations elevate engineering plastic use, fortifying derivative demand despite stringent VOC curbs in paints. Regulatory clarity combined with established logistics encourage incremental debottlenecks rather than greenfield builds.
Europe's mature demand landscape is reshaping under sustainability mandates. Germany's chemical clusters refine high-efficiency processes, the United Kingdom and France deploy circular solvent recovery units, and EU-wide REACH classifications prompt reformulation into lower-aromatic blends. Bio-based pilots supported by policy incentives aim to cement early footholds in renewable aromatics, with niche grades targeting premium coating and electronics markets.
- Braskem
- Chevron Phillips Chemical Company LLC
- China Petrochemical Corporation
- CNPC
- ENEOS Corporation
- Exxon Mobil Corporation
- Formosa Chemicals & Fibre Corp
- FUJAN REFINING & PETROCHEMICAL COMPANY LIMITED
- GS Caltex Corporation
- Indian Oil Corporation Ltd
- INEOS AG
- LOTTE Chemical Corporation
- Mangalore Refinery and Petrochemicals limited
- MITSUBISHI GAS CHEMICAL COMPANY, INC.
- Mitsui Chemicals, Inc.
- Petro Rabigh
- PTT Global Chemical Public Company Limited
- QatarEnergy
- Reliance Industries Limited
- SK Geocentric Co., Ltd.
- S-OIL CORPORATION
- TotalEnergies
Additional Benefits:
- The market estimate (ME) sheet in Excel format
- 3 months of analyst support
TABLE OF CONTENTS
1 Introduction
- 1.1 Study Assumptions and Market Definition
- 1.2 Scope of the Study
2 Research Methodology
3 Executive Summary
4 Market Landscape
- 4.1 Market Overview
- 4.2 Market Drivers
- 4.2.1 Surging PET Resin Demand Fueling Para-xylene Consumption in Asia
- 4.2.2 Capacity Expansions in Integrated Aromatics Complexes across Middle east and Asia
- 4.2.3 Automotive Lightweighting Driving Engineering Plastics in North America
- 4.2.4 Growing Usage of Xylene as Solvents and Monomers
- 4.2.5 Strategic Stockpiling of Solvents by Pharma amid Supply-chain Volatility
- 4.3 Market Restraints
- 4.3.1 Stringent VOC Norms Limiting Aromatic Solvent Use in Europe and North America
- 4.3.2 Health-toxicity Concerns Prompting Shift to Oxygenated Solvents
- 4.3.3 Volatile Naphtha Prices Compressing Producer Margins
- 4.4 Value Chain Analysis
- 4.5 Porter's Five Forces Analysis
- 4.5.1 Bargaining Power of Suppliers
- 4.5.2 Bargaining Power of Buyers
- 4.5.3 Threat of New Entrants
- 4.5.4 Threat of Substitutes
- 4.5.5 Degree of Competition
5 Market Size and Growth Forecasts (Volume)
- 5.1 By Type
- 5.1.1 Ortho-xylene
- 5.1.2 Meta-xylene
- 5.1.3 Para-xylene
- 5.1.4 Mixed xylene
- 5.2 By Grade
- 5.2.1 Technical Grade
- 5.2.2 High-Purity Grade (99.9 %)
- 5.3 By Source
- 5.3.1 Petroleum-based Xylene
- 5.3.2 Bio-based Xylene
- 5.4 By Application
- 5.4.1 Solvents
- 5.4.2 Monomer
- 5.4.3 Other Applications
- 5.5 By End-user Industry
- 5.5.1 Plastics and Polymers
- 5.5.2 Paints and Coatings
- 5.5.3 Adhesives
- 5.5.4 Other End-user Industries
- 5.6 Geography
- 5.6.1 Asia-Pacific
- 5.6.1.1 China
- 5.6.1.2 India
- 5.6.1.3 Japan
- 5.6.1.4 South Korea
- 5.6.1.5 Rest of Asia-Pacific
- 5.6.2 North America
- 5.6.2.1 United States
- 5.6.2.2 Canada
- 5.6.2.3 Mexico
- 5.6.3 Europe
- 5.6.3.1 Germany
- 5.6.3.2 United Kingdom
- 5.6.3.3 France
- 5.6.3.4 Italy
- 5.6.3.5 Rest of Europe
- 5.6.4 South America
- 5.6.4.1 Brazil
- 5.6.4.2 Argentina
- 5.6.4.3 Rest of South America
- 5.6.5 Middle East and Africa
- 5.6.5.1 Saudi Arabia
- 5.6.5.2 South Africa
- 5.6.5.3 Rest of Middle East and Africa
- 5.6.1 Asia-Pacific
6 Competitive Landscape
- 6.1 Market Concentration
- 6.2 Strategic Moves
- 6.3 Market Share Analysis
- 6.4 Company Profiles {(includes Global level Overview, Market level overview, Core Segments, Financials as available, Strategic Information, Market Rank/Share for key companies, Products and Services, and Recent Developments)}
- 6.4.1 Braskem
- 6.4.2 Chevron Phillips Chemical Company LLC
- 6.4.3 China Petrochemical Corporation
- 6.4.4 CNPC
- 6.4.5 ENEOS Corporation
- 6.4.6 Exxon Mobil Corporation
- 6.4.7 Formosa Chemicals & Fibre Corp
- 6.4.8 FUJAN REFINING & PETROCHEMICAL COMPANY LIMITED
- 6.4.9 GS Caltex Corporation
- 6.4.10 Indian Oil Corporation Ltd
- 6.4.11 INEOS AG
- 6.4.12 LOTTE Chemical Corporation
- 6.4.13 Mangalore Refinery and Petrochemicals limited
- 6.4.14 MITSUBISHI GAS CHEMICAL COMPANY, INC.
- 6.4.15 Mitsui Chemicals, Inc.
- 6.4.16 Petro Rabigh
- 6.4.17 PTT Global Chemical Public Company Limited
- 6.4.18 QatarEnergy
- 6.4.19 Reliance Industries Limited
- 6.4.20 SK Geocentric Co., Ltd.
- 6.4.21 S-OIL CORPORATION
- 6.4.22 TotalEnergies
7 Market Opportunities and Future Outlook
- 7.1 White-space and Unmet-need Assessment
- 7.2 Bio-based Xylene Commercialization
