
|
시장보고서
상품코드
1906007
수압 파쇄 : 시장 점유율 분석, 업계 동향과 통계, 성장 예측(2026-2031년)Hydraulic Fracturing - Market Share Analysis, Industry Trends & Statistics, Growth Forecasts (2026 - 2031) |
||||||
수압 파쇄 시장은 2025년 476억 3,000만 달러로 평가되었고, 2026년에는 509억 8,000만 달러로 성장할 것으로 예측됩니다. 2026-2031년에 걸쳐 CAGR 7.04%로 성장할 것으로 보이며, 2031년까지 716억 6,000만 달러에 달할 전망입니다.

지속적인 전기화, 실시간 모니터링 및 자동화는 유정 현장 연료 비용을 최대 25%까지 절감하고 단계별 공급 효율을 17% 향상시킵니다. 북미의 성숙한 셰일 유전이 현재 수요를 뒷받침하는 반면, 중국과 아르헨티나의 정책 지원은 새로운 활동을 가속화합니다. 서비스 제공업체 간 통합으로 기술 소유권이 집중되지만, 시장 집중도가 중간 수준이어서 틈새 역량을 가진 지역 기업들에게도 기회가 남아 있습니다. 환경 규제로 인해 물 관리 비용이 15-20% 증가하지만, 동일한 규정이 투과성을 수십 배 향상시키는 무수 분쇄 기술에 대한 투자를 촉진합니다.
세계의 수압 파쇄 시장 동향 및 인사이트
셰일 가스 타이트 오일 개발 붐
페르미안 분지의 타이트 오일 생산량은 2024년 일일 100만 배럴에 달할 것으로 예상되어 수압 파쇄 시장 서비스에 대한 장기적 수요를 입증합니다. 아르헨티나의 바카 무에르타 지층은 RIGI 제도 하 30년간의 세금 안정성 혜택을 받아 2억 달러 이상의 투자에 대한 재정적 위험을 낮춥니다. 중국은 높은 비용에도 불구하고 직접 보조금과 인프라 자금 지원을 유지하여 파쇄량을 지속합니다. 주요 셰일 유전 운영사들은 지속적인 기술 업그레이드를 통해 배럴당 40달러 미만의 손익분기점을 달성하고 있습니다. 이러한 요소들이 복합적으로 작용하여 여러 대륙에 걸쳐 파쇄 장비의 높은 가동률을 뒷받침하고 있습니다.
세계의 가스 수요 증가 및 연료 전환
국제에너지기구(IEA)는 전력 및 공업원료 분야에서 석탄에서 천연가스로의 전환을 배경으로 2030년까지 천연가스 사용량이국제에너지기구(IEA)는 전력 및 산업용 원료의 석탄에서 가스로의 전환에 힘입어 천연가스 사용량이 2030년까지 꾸준히 증가할 것으로 전망합니다. 아시아태평양 지역 유틸리티 기업들은 기후 목표 달성을 위해 가스 발전소를 선호하고 있으며, 이는 지역 수압 파쇄 시장 활동을 촉진할 것으로 예상됩니다. 석유화학 및 비료에 대한 산업 수요는 비전통 가스 생산을 더욱 확대합니다. 최근 공급 충격 이후 에너지 안보 우려로 인해 각국 정부는 국내 가스 생산을 장려하고 있습니다. 지속적인 수요는 서비스 기업의 계약 가시성을 뒷받침하여 원자재 가격의 주기적 변동을 상쇄합니다.
물 사용 제한 및 환경 보호 운동
콜로라도주는 신규 완공 시 80%의 물 재활용을 의무화하여 유정 비용을 최대 20%까지 증가시켰습니다. 델라웨어 강 유역은 프랙킹 금지를 유지하고 있으며, 여러 유럽 국가들이 모라토리움을 시행 중입니다. 법적 도전은 허가 절차를 지연시키고 불확실성을 높입니다. 운영사들은 담수 소비를 피하면서 투과성을 수 배 향상시키는 폐쇄형 시스템과 전기 분쇄 기술을 도입하여 대응하고 있습니다. 자본 수요는 증가하지만, 장기적인 환경 규정 준수는 프로젝트 수용성을 개선합니다.
부문 분석
수평 시추공은 2025년 매출의 79.85%를 차지했으며, 수압 파쇄 시장 규모 내 점유율은 연평균 8.16% 성장률과 함께 증가할 전망입니다. 확장된 측방향 유정의 다단계 자극은 유정당 회수율을 높여 원자재 가격이 하락할 때에도 수평 시추 프로그램의 경제적 매력을 유지합니다. 공장식 운영 방식은 설계를 표준화하고 주기 시간을 단축시켜 대부분의 셰일 유전에서 수평 완공이 기본 선택지가 되도록 합니다.
셰브론의 트리플-프랙 워크플로는 여러 유정을 동시에 완료하여 패드 일수를 30% 단축합니다. 전체 수평구간을 따라 실시간 감지 기술을 적용해 프롭판 배치 정확도를 높여 최종 회수율을 증가시키고 프롭판 낭비를 줄입니다. 수직 유정은 석탄층 메탄 및 기존 유전에서 틈새 역할을 유지하지만 점유율은 계속 하락할 전망입니다. 수평 파쇄의 기술 집약적 특성으로 인해 수압 파쇄 산업 전반에 걸쳐 통합 디지털 플랫폼 수요가 강화되고 있습니다.
2025년 슬릭워터(Slick-water)는 경쟁 속에서도 수압 파쇄 시장의 56.65% 매출을 차지하며 기반을 다졌습니다. 낮은 점도로 펌프 동력을 절감하고 더 높은 펌프 속도를 가능케 하여 단계별 비용을 절감합니다. 폼 또는 젤을 결합한 하이브리드 유체는 대량의 물 없이도 프롭판 운반을 개선함으로써 특히 건조 분지에서 이점을 제공하며, 연평균 성장률(CAGR) 9.02%로 성장할 것으로 전망됩니다.
폼 기반 유체는 물에 민감한 저류층에 사용되며 강화된 환경 규제를 준수합니다. 운영사들은 물 소비를 제한하기 위해 활성화 오일 및 CO2 기반 시스템을 실험 중입니다. 첨가제 공급업체들은 낮은 용량에서도 작동하는 마찰 감소제를 개선하여 슬릭워터의 경제성을 높이고 있습니다. 이러한 발전은 슬릭워터의 핵심 위치를 유지하면서 수압 파쇄 산업 내 유체 선택의 폭을 넓히고 있습니다.
수압 파쇄 시장 보고서는 유정 유형(수평 및 수직), 유체 유형(슬릭 워터, 겔 기반, 폼 기반, 하이브리드/활성화), 프로판트 유형(프랙 샌드, 수지 코팅 샌드, 세라믹 프로판트), 용도별(셰일 가스, 타이트 오일, 석탄층 메탄), 지역별(북미, 아프리카, 아시아, 아시아
지역별 분석
북미는 풍부한 셰일 자원과 성숙한 물류 인프라를 바탕으로 2025년 수압 파쇄 시장 점유율 67.60%를 차지했습니다. 퍼미안 분지는 배럴당 40달러 미만의 손익분기점으로 선두를 달리고 있으며, 캐나다의 비전통 가스 및 오일샌드 활동은 서비스 수요에 깊이를 더합니다. 멕시코의 에너지 개혁은 전망을 열어주지만, 단기 활동은 인프라 격차로 인해 제한적입니다. 전기 차량의 광범위한 도입과 패드 수준 자동화는 이 지역의 기술 리더십과 비용 경쟁력을 강화합니다.
아시아태평양 지역은 2031년까지 연평균 9.95%의 성장률을 기록하며 가장 빠르게 성장하는 지역입니다. 중국은 셰일가스 개발을 위해 보조금 지원과 허가 간소화를 추진하며 원자재 경기 침체기에도 수압파쇄 시장 계약을 유지하고 있습니다. 인도는 대규모 유전 개발을 가능하게 할 규제 체계를 검토 중이며, 호주는 수출 파이프라인을 채우기 위해 석탄층 메탄 및 타이트가스 프로젝트에 의존하고 있습니다. 지역 성장은 지속적인 정부 지원과 중간 유통 투자에 달려 있으며, 이는 시장 공급 비용을 낮춥니다.
유럽은 엄격한 환경 규제로 제약을 받고 있으며, 여러 국가가 모라토리엄을 시행 중입니다. 중동 및 아프리카는 타이트 가스나 셰일 자원이 기존 생산 허브와 연계되는 선택적 기회를 보여줍니다. 남미의 전망은 아르헨티나의 바카 무에르타(Vaca Muerta)에 집중되며, 현재 밀레이 대통령의 개혁 아래 증가하는 자본을 유치하고 있습니다. 모든 신흥 지역에서 인프라 개발, 재정 안정성, 현지 서비스 역량이 수압 파쇄 시장 도입 속도를 결정할 것입니다.
기타 혜택 :
- 엑셀 형식 시장 예측(ME) 시트
- 애널리스트의 3개월간 지원
자주 묻는 질문
목차
제1장 서론
- 조사의 전제조건과 시장의 정의
- 조사 범위
제2장 조사 방법
제3장 주요 요약
제4장 시장 상황
- 시장 개요
- 시장 성장 촉진요인
- 셰일 가스 및 타이트 오일 개발 붐
- 세계의 가스 수요 증가와 연료 전환
- 다단계 수평 파쇄 기술 발전
- 중국 및 아르헨티나의 정부 우대 조치
- 실시간 광섬유 및 AI 기반 파쇄 최적화
- 전기 분쇄 장비(e-Frac)의 급속한 도입
- 시장 성장 억제요인
- 물 사용 제한 및 환경 반대
- 원자재 가격 변동성이 유정 경제성에 미치는 악영향
- 모래 채굴 금지 조치가 프롭팬트 공급망에 미치는 교란
- ESG 연계 자본 접근 제약
- 공급망 분석
- 규제 상황
- 기술의 전망
- Porter's Five Forces
- 공급기업의 협상력
- 구매자의 협상력
- 신규 참가업체의 위협
- 대체품의 위협
- 경쟁 기업간 경쟁 관계
제5장 시장 규모와 성장 예측
- 유정 유형별
- 수평
- 수직
- 유체 유형별
- 슬릭 워터
- 겔 기반
- 폼 기반
- 하이브리드/활성화
- 프로판트 유형별
- 프랙 샌드
- 수지 코팅 샌드
- 세라믹 프로판트
- 용도별
- 셰일 가스
- 타이트 오일
- 석탄층 메탄
- 지역별
- 북미
- 미국
- 캐나다
- 멕시코
- 유럽
- 독일
- 영국
- 이탈리아
- 러시아
- 노르웨이
- 기타 유럽
- 아시아태평양
- 중국
- 인도
- 한국
- ASEAN 국가
- 호주
- 기타 아시아태평양
- 남미
- 아르헨티나
- 브라질
- 기타 남미
- 중동 및 아프리카
- 사우디아라비아
- 아랍에미리트(UAE)
- 남아프리카
- 나이지리아
- 기타 중동 및 아프리카
- 북미
제6장 경쟁 구도
- 시장 집중도
- 전략적 움직임(M&A, 제휴, 전력 구입 계약)
- 시장 점유율 분석(주요 기업의 시장 순위 및 점유율)
- 기업 프로파일
- Halliburton Company
- Schlumberger Ltd.
- Baker Hughes Co.
- Liberty Energy Inc.
- NexTier Oilfield Solutions Inc.
- Patterson-UTI(Seventy Seven)
- Calfrac Well Services Ltd.
- FTS International Services
- Archer Ltd.
- Basic Energy Services
- RPC Inc.(Cudd Energy)
- ProPetro Holding Corp.
- BJ Energy Solutions
- Trican Well Service Ltd.
- China Oilfield Services Ltd.
- Sinopec Oilfield Service Corp.
- Weatherford International plc
- STEP Energy Services
- Superior Energy Services(Frac Tech)
- SD Energy
제7장 시장 기회와 장래의 전망
HBR 26.01.26The Hydraulic Fracturing market is expected to grow from USD 47.63 billion in 2025 to USD 50.98 billion in 2026 and is forecast to reach USD 71.66 billion by 2031 at 7.04% CAGR over 2026-2031.
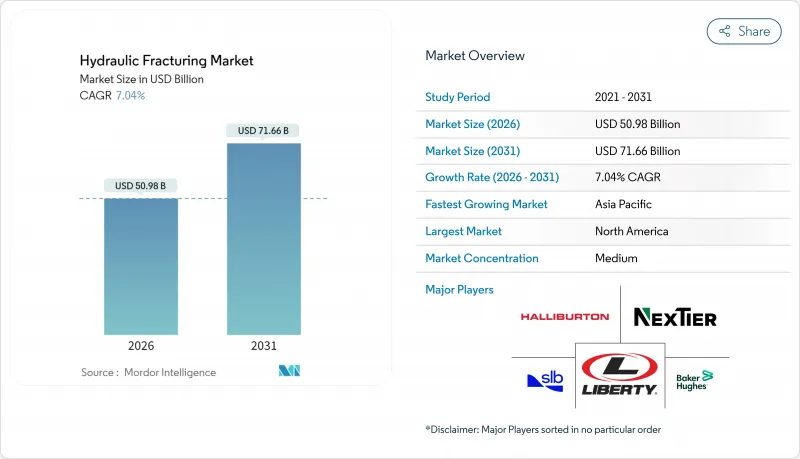
Continued electrification, real-time monitoring, and automation reduce wellsite fuel costs by up to 25% and improve stage-delivery efficiency by 17%. Mature shale plays in North America underpin current demand, while policy support in China and Argentina accelerates new activity. Consolidation among service providers concentrates technology ownership, yet moderate market concentration leaves space for regional firms with niche capabilities. Environmental regulations raise water-management costs by 15-20%, but the same rules spur investment in waterless fracturing methods that enhance permeability by several orders of magnitude.
Global Hydraulic Fracturing Market Trends and Insights
Shale Gas & Tight-Oil Development Boom
Tight-oil output in the Permian Basin is expected to reach 1 million barrels per day in 2024, underscoring the long-term demand for hydraulic fracturing market services. Argentina's Vaca Muerta formation benefits from 30-year tax stability under the RIGI regime, which lowers fiscal risk for investments above USD 200 million. China maintains direct subsidies and infrastructure funding that sustain fracturing volumes despite higher costs. Operators in premier shale plays achieve breakeven costs below USD 40 per barrel through continuous technology upgrades. These factors collectively support high utilization of fracturing fleets across multiple continents.
Rising Global Gas Demand & Fuel-Switching
The International Energy Agency expects natural-gas use to climb steadily to 2030, bolstered by coal-to-gas switching for power and industrial feedstocks.Asia-Pacific utilities are favoring gas-fired plants to meet their climate goals, which is expected to lift regional hydraulic fracturing market activity. Industrial demand for petrochemicals and fertilizers further expands unconventional gas production. Energy-security concerns following recent supply shocks prompt governments to encourage domestic gas production. Sustained demand underpins contract visibility for service companies, offsetting the periodic fluctuations in commodity prices.
Water-Use Restrictions & Environmental Opposition
Colorado now requires 80% water recycling for new completions, increasing well costs by up to 20%. The Delaware River Basin maintains a ban on fracking, and several European nations have imposed moratoria. Legal challenges prolong permitting and heighten uncertainty. Operators respond with closed-loop systems and electro-fracturing techniques that avoid freshwater consumption while boosting permeability by several magnitudes. Capital needs rise, but long-term environmental compliance improves project acceptability.
Other drivers and restraints analyzed in the detailed report include:
- Advances in Multi-Stage Horizontal Fracturing
- Government Incentives in China & Argentina
- Commodity-Price Volatility Hurting Well Economics
For complete list of drivers and restraints, kindly check the Table Of Contents.
Segment Analysis
Horizontal wells represented 79.85% of 2025 revenue, and their share of the hydraulic fracturing market size is projected to rise alongside an 8.16% CAGR. Multi-stage stimulation of extended laterals lifts recovery per well, keeping horizontal programs economically attractive even when commodity prices soften. Factory-style operations standardize designs and shorten cycle time, making horizontal completions the default choice in most shale plays.
Chevron's triple-frac workflow enables the completion of several wells in parallel, reducing pad days by 30%. Real-time sensing along the entire lateral tunes proppant placement, increasing ultimate recovery and lowering proppant waste. Vertical wells retain niche roles in coal-bed methane and legacy fields, but will continue losing share. The technology-intensive nature of horizontal fracturing strengthens demand for integrated digital platforms across the hydraulic fracturing industry.
Slick-water held 56.65% revenue in 2025, anchoring the hydraulic fracturing market despite competition. Its low viscosity reduces pumping horsepower and allows higher pump rates, cutting stage costs. Hybrid fluids, which combine foams or gels, are forecast to grow at a 9.02% CAGR by improving proppant transport without requiring large water volumes, a benefit particularly in arid basins.
Foam-based fluids serve water-sensitive reservoirs and comply with stricter environmental regulations. Operators experiment with energized oils and CO2-based systems to limit water consumption. Additive suppliers refine friction reducers that work at lower dosages, enhancing slick-water economics. These developments broaden fluid choices within the hydraulic fracturing industry while preserving the core position of slick-water.
The Hydraulic Fracturing Market Report is Segmented by Well Type (Horizontal and Vertical), Fluid Type (Slick-Water, Gel-Based, Foam-Based, and Hybrid/Energized), Proppant Type (Frac Sand, Resin-Coated Sand, and Ceramic Proppants), Application (Shale Gas, Tight Oil, and Coal-Bed Methane), and Geography (North America, Europe, Asia-Pacific, South America, and Middle East and Africa).
Geography Analysis
North America commanded 67.60 of % hydraulic fracturing market share in 2025, supported by prolific shale resources and mature logistics. The Permian Basin leads with breakeven costs below USD 40 per barrel, while Canada's unconventional gas and oil-sands activity adds depth to service demand. Mexico's energy reforms open prospects, though near-term activity remains limited by infrastructure gaps. Widespread adoption of electric fleets and pad-level automation reinforces the region's technology leadership and cost competitiveness.
Asia-Pacific region is the fastest-growing region, with a 9.95% CAGR projected through 2031. China directs subsidies and streamlined permits toward shale gas development, sustaining hydraulic fracturing market contracts even during commodity downturns. India evaluates regulatory frameworks that could unlock sizeable basins, while Australia relies on coal-bed methane and tight-gas projects to fill export pipelines. Regional growth hinges on ongoing government support and midstream investment that lowers delivered cost to market.
Europe remains constrained by strict environmental rules, with several nations imposing moratoria. The Middle East and Africa show selective opportunities where tight-gas or shale resources align with existing production hubs. South America's outlook centers on Argentina's Vaca Muerta, now drawing increased capital under President Milei's reforms. Across all emerging regions, infrastructure development, fiscal stability, and local service capabilities will determine the pace of hydraulic fracturing market adoption.
- Halliburton Company
- Schlumberger Ltd.
- Baker Hughes Co.
- Liberty Energy Inc.
- NexTier Oilfield Solutions Inc.
- Patterson-UTI (Seventy Seven)
- Calfrac Well Services Ltd.
- FTS International Services
- Archer Ltd.
- Basic Energy Services
- RPC Inc. (Cudd Energy)
- ProPetro Holding Corp.
- BJ Energy Solutions
- Trican Well Service Ltd.
- China Oilfield Services Ltd.
- Sinopec Oilfield Service Corp.
- Weatherford International plc
- STEP Energy Services
- Superior Energy Services (Frac Tech)
- SD Energy
Additional Benefits:
- The market estimate (ME) sheet in Excel format
- 3 months of analyst support
TABLE OF CONTENTS
1 Introduction
- 1.1 Study Assumptions & Market Definition
- 1.2 Scope of the Study
2 Research Methodology
3 Executive Summary
4 Market Landscape
- 4.1 Market Overview
- 4.2 Market Drivers
- 4.2.1 Shale gas & tight-oil development boom
- 4.2.2 Rising global gas demand & fuel-switching
- 4.2.3 Advances in multi-stage horizontal fracturing
- 4.2.4 Government incentives in China & Argentina
- 4.2.5 Real-time fiber-optic & AI-driven frac optimization
- 4.2.6 Rapid adoption of electric frac fleets (e-Frac)
- 4.3 Market Restraints
- 4.3.1 Water-use restrictions & environmental opposition
- 4.3.2 Commodity-price volatility hurting well economics
- 4.3.3 Sand-mining bans disrupting proppant supply chain
- 4.3.4 ESG-linked capital access constraints
- 4.4 Supply-Chain Analysis
- 4.5 Regulatory Landscape
- 4.6 Technological Outlook
- 4.7 Porter's Five Forces
- 4.7.1 Bargaining Power of Suppliers
- 4.7.2 Bargaining Power of Buyers
- 4.7.3 Threat of New Entrants
- 4.7.4 Threat of Substitutes
- 4.7.5 Intensity of Competitive Rivalry
5 Market Size & Growth Forecasts
- 5.1 By Well Type
- 5.1.1 Horizontal
- 5.1.2 Vertical
- 5.2 By Fluid Type
- 5.2.1 Slick-water
- 5.2.2 Gel-based
- 5.2.3 Foam-based
- 5.2.4 Hybrid/Energized
- 5.3 By Proppant Type
- 5.3.1 Frac Sand
- 5.3.2 Resin-Coated Sand
- 5.3.3 Ceramic Proppants
- 5.4 By Application
- 5.4.1 Shale Gas
- 5.4.2 Tight Oil
- 5.4.3 Coal-Bed Methane
- 5.5 By Geography
- 5.5.1 North America
- 5.5.1.1 United States
- 5.5.1.2 Canada
- 5.5.1.3 Mexico
- 5.5.2 Europe
- 5.5.2.1 Germany
- 5.5.2.2 United Kingdom
- 5.5.2.3 Italy
- 5.5.2.4 Russia
- 5.5.2.5 Norway
- 5.5.2.6 Rest of Europe
- 5.5.3 Asia-Pacific
- 5.5.3.1 China
- 5.5.3.2 India
- 5.5.3.3 South Korea
- 5.5.3.4 ASEAN Countries
- 5.5.3.5 Australia
- 5.5.3.6 Rest of Asia-Pacific
- 5.5.4 South America
- 5.5.4.1 Argentina
- 5.5.4.2 Brazil
- 5.5.4.3 Rest of South America
- 5.5.5 Middle East and Africa
- 5.5.5.1 Saudi Arabia
- 5.5.5.2 United Arab Emirates
- 5.5.5.3 South Africa
- 5.5.5.4 Nigeria
- 5.5.5.5 Rest of Middle East and Africa
- 5.5.1 North America
6 Competitive Landscape
- 6.1 Market Concentration
- 6.2 Strategic Moves (M&A, Partnerships, PPAs)
- 6.3 Market Share Analysis (Market Rank/Share for key companies)
- 6.4 Company Profiles (includes Global level Overview, Market level overview, Core Segments, Financials as available, Strategic Information, Products & Services, and Recent Developments)
- 6.4.1 Halliburton Company
- 6.4.2 Schlumberger Ltd.
- 6.4.3 Baker Hughes Co.
- 6.4.4 Liberty Energy Inc.
- 6.4.5 NexTier Oilfield Solutions Inc.
- 6.4.6 Patterson-UTI (Seventy Seven)
- 6.4.7 Calfrac Well Services Ltd.
- 6.4.8 FTS International Services
- 6.4.9 Archer Ltd.
- 6.4.10 Basic Energy Services
- 6.4.11 RPC Inc. (Cudd Energy)
- 6.4.12 ProPetro Holding Corp.
- 6.4.13 BJ Energy Solutions
- 6.4.14 Trican Well Service Ltd.
- 6.4.15 China Oilfield Services Ltd.
- 6.4.16 Sinopec Oilfield Service Corp.
- 6.4.17 Weatherford International plc
- 6.4.18 STEP Energy Services
- 6.4.19 Superior Energy Services (Frac Tech)
- 6.4.20 SD Energy
7 Market Opportunities & Future Outlook
- 7.1 White-Space & Unmet-Need Assessment

