
|
시장보고서
상품코드
1906282
POP 디스플레이 시장 : 점유율 분석, 업계 동향 및 통계, 성장 예측(2026-2031년)POP Display - Market Share Analysis, Industry Trends & Statistics, Growth Forecasts (2026 - 2031) |
||||||
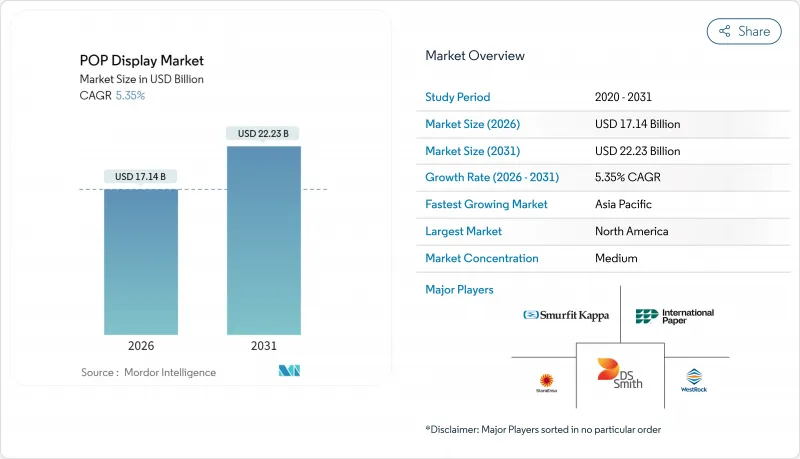
2026년 POP 디스플레이 시장의 규모는 171억 4,000만 달러로 추정되고 있으며, 2025년 162억 7,000만 달러에서 계속 성장하고 있습니다.
2031년까지는 222억 3,000만 달러에 이르고, 2026년부터 2031년에 걸쳐 CAGR 5.35%로 확대될 것으로 전망됩니다.

소매업체는 전자상거래가 성장하고 있음에도 불구하고 충동 구매가 여전히 상점에서 발생하고 있기 때문에 매장에서의 연출 효과에 대한 투자를 유지하고 있습니다. 플로어 디스플레이 및 골판지 솔루션은 전국적인 상점 네트워크에 신속하게 배포할 수 있는 비용 효율적이고 재활용 가능한 소재에 대한 소매업체의 요구를 반영하여 상품 진열 프로그램의 기반이 되고 있습니다. 소매 미디어 네트워크에 대한 관심 증가는 물리적 디스플레이와 센서 및 디지털 스크린의 통합을 촉진하고, 브랜드가 참여도를 측정하고, 플래노그램을 실시간으로 최적화할 수 있도록 합니다. 동시에 지속가능성에 관한 법규제 및 원재료 비용 상승으로 섬유계 소재나 폐루프형 공급망으로의 전환이 가속화되고 있습니다.
세계의 POP 디스플레이 시장의 동향 및 인사이트
신흥경제국에서 FMCG(일용소비재)와 편의점 급증
세븐일레븐이나 로손 등의 체인에 의한 적극적인 매장 개업 캠페인은 한정된 공간에서 최대의 효과를 낳는 컴팩트한 판매용 비품에 대한 지역적인 수요를 촉진하고 있습니다. 인도네시아에서는 소형 매장이 현대 식료품 거래의 73%를 차지하고 있으며(2013년 47%) 제한된 면적에 맞는 수직 모듈러 솔루션의 필요성을 강조하고 있습니다.
소매업체의 고전환율 매장 내 터치포인트 수요
브랜드 소유자는 현재 판매 공간의 평방 피트당 측정 가능한 수익을 기대하고 있습니다. 페레로사의 '2025년 퍼펙트 스토어 계획'은 이 변화를 상징하고 있으며, 디스플레이는 분석 대시보드와 연동하여 SKU 수준의 실적을 실시간으로 시각화합니다. 이러한 데이터가 풍부한 시스템의 설치를 통해 부문 관리자는 프로모션 종료 후가 아니라 실행 동안 배치를 조정할 수 있습니다.
전자상거래와 디지털 광고가 매장 예산을 흡수
온라인 광고에 대한 편향은 마케팅 책임자가 추적 가능한 클릭을 추구하는 가운데 물리적 머천다이징 지출의 일부를 흡수합니다. 설문조사에 따르면 ROI 불확실성과 상점 운영에 대한 간섭 우려가 매장 내 소매 매체의 도입을 늦추고 비품에 대한 예산의 투입을 늦추고 있습니다. 이를 보완하기 위해 소매 업체는 최소한의 면적 재구성을 필요로 하는 오디오 광고와 진열대 스크린을 시험적으로 도입하고 있습니다.
부문 분석
2025년 시점에서 플로어 유닛은 POP 디스플레이 시장의 43.15%를 차지했으며, CAGR 5.75%로 확대를 지속하여, 대형 비품이 체험형 판매 존의 기준인 것이 확인되었습니다. 카운터 탑 및 엔드 캡 유닛은 계산대와 통로 끝에서 충동 구매를 유도합니다. 파렛트 디스플레이는 창고형 회원제점과 할인 소매점을 지원하여 크로스 도킹으로 판매 플로어에 직접 반입할 수 있습니다. 룩 컴퍼니사에 의하면, 식료품점에서는 시식 코너와 바닥 그래픽을 융합시켜, 레시피와 결합한 쇼핑 카트를 제공하는 수법이 보급되어 골판지와 스크린을 조합한 하이브리드 구조 수요가 높아지고 있습니다. 플로어 디스플레이의 규모는 임베디드 센서, QR 코드, NFC 태그의 탑재를 가능하게 하여, 물리적인 접촉점을 소매 미디어 네트워크와 연결합니다. 브랜드가 주요 실내 공간의 임대료를 지불함으로써, 매장 운영자는 새로운 수익원을 획득하고 이는 POP 디스플레이 시장의 추가 확대로 이어지고 있습니다. 엔드 캡의 업그레이드도 비슷한 동향을 나타내고 있으며 시간대에 따라 컨텐츠를 전환하는 동적 LED 헤더를 제공하여 수동 라벨 교환 없이 SKU 회전을 개선합니다.
2025년 시점에서는 골판지가 POP 디스플레이 시장의 35.05%를 차지하고 있었지만, 발포 보드는 6.1%의 연평균 복합 성장률(CAGR)로 성장을 지속하고 있습니다. 발포 보드의 매끄러운 표면은 화장품과 하이테크 장비에 필수적인 고화질 인쇄를 실현합니다. 섬유 소재의 이점은 경량성, 재활용 가능성, 비교적 낮은 단가로 인해 발생합니다. 플라스틱과 금속은 옥외 및 습한 지역에서 수명이 긴 곤돌라 디스플레이에 필수적이지만 버진 폴리머에 대한 과세 강화가 대체 소재로의 전환 압력을 높이고 있습니다. 신흥 바이오 복합 보드는 셀룰로오스와 작물 잔류물을 혼합하여 낮은 평량으로 동등한 내압성을 제공합니다. 소매업체는 EPR 시스템에서 의무화된 사용된 제품의 재활용 감사를 단순화하기 위해 이러한 재료를 선호합니다. 발포 보드의 대두는 고급 스킨케어 분야에서 현저하고, 구조, 색 재현성, 엣지 라이트 로고에 의해 무거운 강철 프레임 없이 진열대에서의 존재감을 높이고 있습니다.
POP 디스플레이 시장은 제품 유형(카운터 탑 디스플레이, 플로어 디스플레이, 엔드 캡 디스플레이 등), 소재(골판지, 플라스틱, 금속 등), 판매 채널(백화점, 슈퍼마켓 및 하이퍼마켓 등), 최종 사용자(식품 및 음료, 화장품 및 퍼스널케어 등), 지역별로 분류됩니다. 시장 예측은 금액 기준(달러)으로 제공됩니다.
지역별 분석
북미는 2025년 시점에서 POP 디스플레이 시장의 24.25% 점유율을 유지했습니다. 2030년까지의 성장은 소매 미디어의 도입과 골판지 생산 능력의 강화, 그리고 리드 타임 단축을 도모하는 WestRock사의 위스콘신주 '슈퍼 플랜트' 자동화 설비 등에 대한 자본 투자에 의해 발생할 전망입니다. 미국의 식료품 소매업체는 디지털 키오스크와 파이버 키오스크를 결합한 프로그램 예약 시스템을 통해 엔드 캡 재고 수익화를 가속화하고 있습니다. 캐나다의 EPR법(확대 생산자 책임 제도)은 커브사이드 재활용 대응 인증 디스플레이 수요를 촉진하고 있습니다. 한편, 멕시코에서는 중산층의 확대에 따라, 국경 밖의 공급 거점과 연동하는 편의점 체인에서 브랜드 수송 용기의 도입이 진행되고 있습니다.
아시아태평양은 2031년까지 연평균 복합 성장률(CAGR) 5.55%로 가장 높은 성장률을 기록할 전망입니다. 편의점 체인은 2026년까지 1만 곳의 매장 증설을 계획하고 있습니다. 중국의 스마트 소매 사업자는 매장에 AI 기반 플래노그램 최적화를 도입하여 상품 교체 사이클을 수주에서 수시간으로 단축하고 있습니다. 인도의 조직 소매업은 지방 도시에 쇼핑몰을 확대하고, 브랜드는 두 가지 언어에 대응하는 그래픽이나 QR코드가 있는 레시피 표시로 상품 지식의 계발을 진행하고 있습니다. 동남아시아 점포(대부분은 200제곱미터 미만)에서는 운송 비용 절감을 위해 조립식 키트로 출하되는 얇은 접이식 타워가 주류입니다. 유럽의 POP 디스플레이 시장은 지속가능성을 축으로 전개하고 있습니다. 영국의 플라스틱 세금제도와 독일의 포장법(VerpackG)은 순환형 소재의 사용을 촉진하고 있습니다(gov.uk 참조). 소매업체는 관리 연속성을 요구하고 FSC 인증 골판지와 수성 잉크에 대한 관심을 높입니다. 프랑스의 대형 슈퍼에서는 결로 방지 종이제 냉각기 커버를 시험적으로 도입해, 냉장 매장에서의 섬유 소재 활용을 확대 중입니다. 디지털화의 도입도 확대되고 있으며, 네덜란드의 식료품 그룹에서는 ESL 탑재 곤돌라를 모바일 앱과 연동시켜 즉각적인 프로모션을 실현하고 있습니다. 인플레이션 압력이라는 역풍에도 불구하고 화장품과 고급 식품의 프리미엄 전략이 단가를 유지하고 가격 민감 부문에서 판매 수량의 성장 고민을 상쇄하고 있습니다.
기타 혜택
- 시장 예측(ME) 엑셀 시트
- 3개월 애널리스트 서포트
자주 묻는 질문
목차
제1장 서론
- 조사 전제조건 및 시장 정의
- 조사 범위
제2장 조사 방법
제3장 주요 요약
제4장 시장 상황
- 시장 개요
- 촉진요인
- 신흥국에서의 FMCG(일용소비재) 및 편의점의 급속한 확대
- 소매업체의 고전환율 매장 내 터치 포인트에 대한 수요
- 지속가능한 섬유계 골판지가 플라스틱을 대체
- 실시간 분석을 위한 스마트 센서 탑재 POP
- 모듈식 서비스형 디스플레이(DaaS) 렌탈 모델의 보급
- 3D 프린팅 기술에 의한 초단기 커스텀 디스플레이의 실현
- 억제요인
- 전자상거래와 디지털 광고의 매장 예산 흡수
- 라이너보드 및 수지 가격의 변동으로 이익률 압박
- 엄격한 매립 규제 및 플라스틱세 규제
- 축소하는 매장 면적에 의한 진열 밀도 저하
- 공급망 분석
- 규제 상황
- 기술 전망
- Porter's Five Forces 분석
- 공급자의 협상력
- 구매자의 협상력
- 신규 참가업체의 위협
- 대체품의 위협
- 경쟁 기업 간 경쟁 관계
- 시장에 대한 거시경제 요인 평가
제5장 시장 규모 및 성장 예측
- 제품 유형별
- 카운터 디스플레이
- 플로어 디스플레이
- 엔드 캡 디스플레이
- 파렛트 디스플레이
- 기타
- 재료별
- 골판지
- 플라스틱
- 금속
- 나무
- 기타
- 판매 채널별
- 백화점
- 슈퍼마켓 및 하이퍼마켓
- 전문점
- 기타
- 최종 사용자별
- 식품 및 음료
- 화장품 및 퍼스널케어
- 의약품
- 전자기기 및 가전제품
- 기타
- 지역별
- 북미
- 미국
- 캐나다
- 멕시코
- 남미
- 브라질
- 아르헨티나
- 기타 남미
- 유럽
- 독일
- 영국
- 프랑스
- 이탈리아
- 스페인
- 기타 유럽
- 아시아태평양
- 중국
- 일본
- 인도
- 한국
- 동남아시아
- 기타 아시아태평양
- 중동 및 아프리카
- 중동
- 사우디아라비아
- 아랍에미리트(UAE)
- 튀르키예
- 기타 중동
- 아프리카
- 남아프리카
- 나이지리아
- 이집트
- 기타 아프리카
- 중동
- 북미
제6장 경쟁 구도
- 시장 집중도
- 전략적 동향
- 시장 점유율 분석
- 기업 프로파일
- DS Smith PLC
- WestRock Company
- Smurfit Kappa Group PLC
- International Paper Company
- Stora Enso Oyj
- Pratt Industries Inc.
- Sonoco Products Company
- Graphic Packaging International
- Georgia-Pacific LLC
- Menasha Packaging Company LLC
- Creative Displays Now!
- PPDandG
- Shenzhen WOW Display Co. Ltd.
- Mondi Group PLC
- Durabox Displays
- FFR Merchandising
- Parkway Display Products Ltd.
- Great Northern Corporation
- Hansen Display Group
- Repack Canada
제7장 시장 기회 및 미래 전망
CSM 26.01.21The POP display market size in 2026 is estimated at USD 17.14 billion, growing from 2025 value of USD 16.27 billion with 2031 projections showing USD 22.23 billion, growing at 5.35% CAGR over 2026-2031.
Retailers continue to invest in on-shelf theatre because impulse purchases still originate in stores even as e-commerce grows. Floor displays and corrugated cardboard solutions remain the backbone of merchandising programs, reflecting retailers' need for cost-effective, recyclable materials that can be deployed quickly across national store networks. Heightened interest in retail media networks is driving the integration of sensors and digital screens into physical displays, allowing brands to measure engagement and optimize planograms in real time. At the same time, sustainability legislation and raw-material cost spikes are accelerating the shift toward fibre-based substrates and closed-loop supply chains.
Global POP Display Market Trends and Insights
Surging FMCG and Convenience-Store Roll-outs in Emerging Economies
Aggressive store-opening campaigns by chains such as 7-Eleven and Lawson are fuelling localised demand for compact merchandising fixtures that can generate maximum impact within tight footprints. Small-format stores already represent 73% of modern grocery trade in Indonesia, compared with 47% in 2013, underscoring the need for vertical, modular solutions that fit limited floor space.
Retailers' Demand for High-conversion In-store Touchpoints
Brand owners now expect every square foot of selling space to deliver measurable returns. Ferrero's 2025 Perfect Store programme illustrates this shift, with displays linked to analytics dashboards that reveal SKU-level performance in real time. Such data-rich installations allow category managers to tweak placement during a promotion cycle rather than after it.
E-commerce and Digital Ads Siphoning In-store Budgets
A tilt toward online advertising has curbed some physical merchandising spend as marketing chiefs chase attributable clicks. Research finds ROI uncertainty and store interference fears slowing adoption of in-store retail media, delaying budget migration back to fixtures. To compensate, retailers are piloting audio ads and shelf-edge screens that require minimal floor-space reconfiguration.
Other drivers and restraints analyzed in the detailed report include:
- Fibre-based Corrugated Replacing Plastics
- Smart Sensor-equipped POP for Real-time Analytics
- Volatile Linerboard and Resin Pricing Squeezes Margins
For complete list of drivers and restraints, kindly check the Table Of Contents.
Segment Analysis
Floor units held 43.15% share of the POP display market in 2025 and are expanding at 5.75% CAGR, confirming that large-format fixtures remain the anchor of experiential selling zones. Countertop and end-cap units target impulse moments near tills and aisle terminations. Pallet displays support warehouse clubs and discount retailers, enabling cross-docking straight to sales floors. The Look Company notes that grocers now fuse sampling stations with floor graphics to trigger recipe-led baskets, spurring demand for hybrid cardboard-and-screen constructions.Floor displays' scale allows embedded sensors, QR codes and NFC tags, linking physical touchpoints to retail-media networks. As brands pay tenancy fees for prime floor real estate, store operators derive new income streams, further scaling the POP display market. End-cap upgrades mirror that trend, offering dynamic LED headers that switch creatives by daypart, improving SKU rotation without manual relabeling.
Corrugated cardboard represented 35.05% of the POP display market size in 2025, but foam board is advancing at 6.1% CAGR because its smooth surface delivers high-definition print crucial for cosmetics and tech gadgets. Fibre dominance stems from its light weight, recyclability and comparatively low unit cost. Plastic and metal remain vital for long-life gondolas in outdoor or high-humidity zones, yet taxes on virgin polymer intensify substitution pressure. Emergent bio-composite boards mix cellulose with crop residue, promising similar crush resistance at lower grammage. Retailers welcome such substrates because they simplify end-of-life recycling audits mandated by EPR regimes. Foam board's rise is pronounced in premium skincare where structure, colour fidelity and edge-lit logos elevate shelf presence without heavy steel frames.
POP Display Market is Segmented by Product Type (Countertop Displays, Floor Displays, End-Cap Displays, and More), Material (Corrugated Cardboard, Plastic, Metal, and More), Sales Channel (Department Stores, Supermarkets and Hypermarkets, and More), End User (Food and Beverages, Cosmetics and Personal Care and More) and by Geography. The Market Forecasts are Provided in Terms of Value (USD).
Geography Analysis
North America retained 24.25% share of the POP display market in 2025. Growth through 2030 stems from retail-media rollouts and capital investments such as WestRock's automated Wisconsin "superplant," which enhances corrugated capacity and shortens lead times. US grocers increasingly monetise end-cap inventory through programmatic booking systems that bundle digital kiosks with fibre kiosks. Canada's EPR legislation spurs demand for displays certified for curbside recycling, while Mexico's rising middle class drives adoption of branded shippers in convenience chains linked to cross-border supply hubs.
Asia-Pacific will record the fastest CAGR at 5.55% through 2031 as convenience chains plan 10,000 additional outlets by 2026. Chinese smart retail operators retrofit stores with AI-driven planogram optimisation, compressing refresh cycles from weeks to hours. India's organised retail corridor adds malls in second-tier cities, where brands deploy bilingual graphics and QR-coded recipe demos to build category education. Southeast Asian formats, often under 200 sqm, rely on slim, fold-flat towers that ship in knock-down kits to minimise freight.Europe's POP display market dynamics revolve around sustainability. The UK's plastic-tax framework and Germany's VerpackG law incentivise closed-loop substrates gov.uk. Retailers demand chain-of-custody certification, propelling interest in FSC-certified corrugated and water-based inks. French hypermarkets trial paper-based cooler claddings that resist condensation, extending fibre usage into refrigerated aisles. Digital adoption is growing as well, with grocery groups in the Netherlands linking ESL-equipped gondolas to mobile apps for instant promotions. Despite inflationary headwinds, premium positioning across cosmetics and gourmet food sustains unit values, offsetting volume softness in price-sensitive categories.
- DS Smith PLC
- WestRock Company
- Smurfit Kappa Group PLC
- International Paper Company
- Stora Enso Oyj
- Pratt Industries Inc.
- Sonoco Products Company
- Graphic Packaging International
- Georgia-Pacific LLC
- Menasha Packaging Company LLC
- Creative Displays Now!
- PPDandG
- Shenzhen WOW Display Co. Ltd.
- Mondi Group PLC
- Durabox Displays
- FFR Merchandising
- Parkway Display Products Ltd.
- Great Northern Corporation
- Hansen Display Group
- Repack Canada
Additional Benefits:
- The market estimate (ME) sheet in Excel format
- 3 months of analyst support
TABLE OF CONTENTS
1 INTRODUCTION
- 1.1 Study Assumptions and Market Definition
- 1.2 Scope of the Study
2 RESEARCH METHODOLOGY
3 EXECUTIVE SUMMARY
4 MARKET LANDSCAPE
- 4.1 Market Overview
- 4.2 Market Drivers
- 4.2.1 Surging FMCG and C-store roll-outs in emerging economies
- 4.2.2 Retailers demand for high-conversion in-store touchpoints
- 4.2.3 Sustainable, fibre-based corrugated replacing plastics
- 4.2.4 Smart sensor-equipped POP for real-time analytics
- 4.2.5 Modular display-as-a-service rental models gain traction
- 4.2.6 3-D printing enabling ultra-short-run custom displays
- 4.3 Market Restraints
- 4.3.1 E-commerce and digital ads siphoning in-store budgets
- 4.3.2 Volatile linerboard and resin pricing squeezes margins
- 4.3.3 Strict landfill and plastics-tax regulations
- 4.3.4 Shrink-floor retail concepts lowering display density
- 4.4 Supply-Chain Analysis
- 4.5 Regulatory Landscape
- 4.6 Technological Outlook
- 4.7 Porter's Five Forces Analysis
- 4.7.1 Bargaining Power of Suppliers
- 4.7.2 Bargaining Power of Buyers
- 4.7.3 Threat of New Entrants
- 4.7.4 Threat of Substitutes
- 4.7.5 Intensity of Competitive Rivalry
- 4.8 Assesment of Macroeconomic Factors on the market
5 MARKET SIZE AND GROWTH FORECASTS (VALUE)
- 5.1 By Product Type
- 5.1.1 Countertop Displays
- 5.1.2 Floor Displays
- 5.1.3 End-cap Displays
- 5.1.4 Pallet Displays
- 5.1.5 Others
- 5.2 By Material
- 5.2.1 Corrugated Cardboard
- 5.2.2 Plastic
- 5.2.3 Metal
- 5.2.4 Wood
- 5.2.5 Others
- 5.3 By Sales Channel
- 5.3.1 Department Stores
- 5.3.2 Supermarkets and Hypermarkets
- 5.3.3 Specialty Stores
- 5.3.4 Others
- 5.4 By End User
- 5.4.1 Food and Beverages
- 5.4.2 Cosmetics and Personal Care
- 5.4.3 Pharmaceuticals
- 5.4.4 Electronics and Appliances
- 5.4.5 Others
- 5.5 By Geography
- 5.5.1 North America
- 5.5.1.1 United States
- 5.5.1.2 Canada
- 5.5.1.3 Mexico
- 5.5.2 South America
- 5.5.2.1 Brazil
- 5.5.2.2 Argentina
- 5.5.2.3 Rest of South America
- 5.5.3 Europe
- 5.5.3.1 Germany
- 5.5.3.2 United Kingdom
- 5.5.3.3 France
- 5.5.3.4 Italy
- 5.5.3.5 Spain
- 5.5.3.6 Rest of Europe
- 5.5.4 Asia-Pacific
- 5.5.4.1 China
- 5.5.4.2 Japan
- 5.5.4.3 India
- 5.5.4.4 South Korea
- 5.5.4.5 Southeast Asia
- 5.5.4.6 Rest of Asia-Pacific
- 5.5.5 Middle East and Africa
- 5.5.5.1 Middle East
- 5.5.5.1.1 Saudi Arabia
- 5.5.5.1.2 United Arab Emirates
- 5.5.5.1.3 Turkey
- 5.5.5.1.4 Rest of Middle East
- 5.5.5.2 Africa
- 5.5.5.2.1 South Africa
- 5.5.5.2.2 Nigeria
- 5.5.5.2.3 Egypt
- 5.5.5.2.5 Rest of Africa
- 5.5.5.1 Middle East
- 5.5.1 North America
6 COMPETITIVE LANDSCAPE
- 6.1 Market Concentration
- 6.2 Strategic Moves
- 6.3 Market Share Analysis
- 6.4 Company Profiles (includes Global level Overview, Market level overview, Core Segments, Financials as available, Strategic Information, Market Rank/Share for key companies, Products and Services, and Recent Developments)
- 6.4.1 DS Smith PLC
- 6.4.2 WestRock Company
- 6.4.3 Smurfit Kappa Group PLC
- 6.4.4 International Paper Company
- 6.4.5 Stora Enso Oyj
- 6.4.6 Pratt Industries Inc.
- 6.4.7 Sonoco Products Company
- 6.4.8 Graphic Packaging International
- 6.4.9 Georgia-Pacific LLC
- 6.4.10 Menasha Packaging Company LLC
- 6.4.11 Creative Displays Now!
- 6.4.12 PPDandG
- 6.4.13 Shenzhen WOW Display Co. Ltd.
- 6.4.14 Mondi Group PLC
- 6.4.15 Durabox Displays
- 6.4.16 FFR Merchandising
- 6.4.17 Parkway Display Products Ltd.
- 6.4.18 Great Northern Corporation
- 6.4.19 Hansen Display Group
- 6.4.20 Repack Canada
7 MARKET OPPORTUNITIES AND FUTURE OUTLOOK
- 7.1 White-space and Unmet-need Assessment

