


|
시장보고서
상품코드
1906947
북미의 데이터센터 전력 시장 : 점유율 분석, 산업 동향 및 통계, 성장 예측(2026-2031년)North America Data Center Power - Market Share Analysis, Industry Trends & Statistics, Growth Forecasts (2026 - 2031) |
||||||
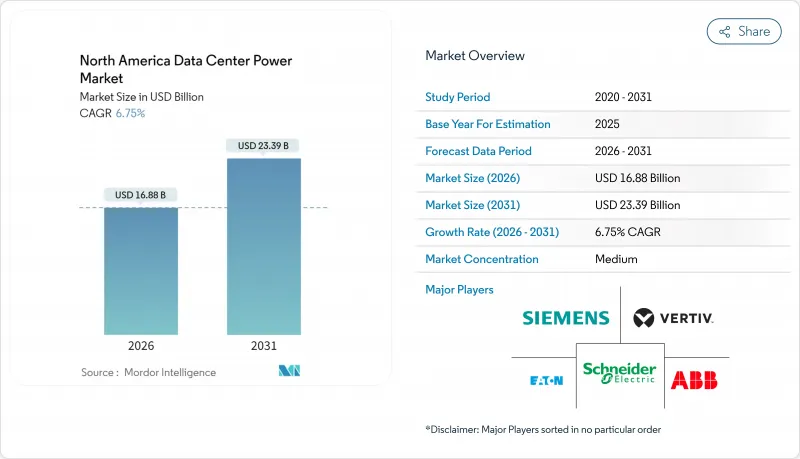
북미의 데이터센터 전력 시장 규모는 2026년 168억 8,000만 달러로 추정되고 있습니다. 이는 2025년 158억 1,000만 달러에서 성장한 수치이며, 2031년에는 233억 9,000만 달러에 달할 것으로 예측되고 있습니다. 2026-2031년 CAGR 6.75%로 성장이 전망되고 있습니다.
견고한 성장은 랙 밀도를 5-15kW에서 40-140kW로 밀어 올리는 AI 중심 워크로드로 인해 사업자에게 전기 아키텍처의 현대화가 요구되고 있습니다. 하이퍼스케일 캠퍼스는 기가와트급 변전소를 건설함으로써 수요를 지원하는 반면, 엣지 컴퓨팅은 자율 UPS와 발전기가 필요한 마이크로사이트를 전개하고 있습니다. PUE 임계값과 같은 엄격한 효율 규제는 액체 냉각 채택과 배터리 에너지 저장(BESS)의 통합을 가속화하고 있습니다. 텍사스주, 퀘벡주, 앨버타주에서 체결된 신재생 에너지 구매 계약(PPA)은 변동하는 전력 요금에 대한 헤지 수단이 되면서 기업의 지속가능성 목표 달성에도 기여하고 있습니다. 주요 도시권의 송전망 용량 제약의 심각화를 받아 확장 거점은 미국 2차 시장, 수력 자원이 풍부한 캐나다주, 멕시코의 신흥 코로케이션 거점으로 이행하고 있습니다.
북미의 데이터센터 전력 시장 동향 및 인사이트
하이퍼스케일 및 메가 데이터센터 채택 확대
하이퍼스케일 사업자는 현재 부지의 변전소에서 수백 메가와트를 공급하는 여러 동으로 구성된 캠퍼스를 계획하고 지속적이며 고품질의 전력 공급이 필요한 액체 냉각 GPU 랙을 도입하고 있습니다. 메타사의 650억 달러 규모의 계획은 북미 전역의 거점에서 PUE1.1 미만을 목표로 하고 있어, 전력 설계가 지속가능성에 대한 대처의 기반이 되었음을 나타냅니다. 앨버타의 원더밸리 파크와 같은 프로젝트는 천연 가스 터빈과 지열 루프를 결합하여 1.4GW의 전용 용량을 창출하고 있으며, 송전망 대기 시간이 4년을 넘는 상황 하에서 자가 발전으로의 이행을 부각하고 있습니다. 저렴한 신재생 자원 주변에 캠퍼스가 집적됨으로써 지역적인 부하 집중이 발생하고, 전력 회사는 송전망의 조기 업그레이드로 대응할 수밖에 없습니다. 공장 통합형 개폐장치, 버스웨이, 에너지 저장 모듈을 제공하는 벤더는 전기 공정의 단축 및 현장 작업의 삭감에 의해 점유율을 획득하고 있습니다. 투자 규모의 확대는 부하 배치를 최적화하고 그리드 플리커 방지를 위해 발전기의 순차 기동을 실현하는 소프트웨어 정의 전력 모니터링 시스템의 도입도 촉진하고 있습니다.
클라우드 컴퓨팅 및 OTT 트래픽 급증
협업 도구, 스트리밍 미디어, 생성형 AI 추론의 급성장으로 인해, 통신 사업자 및 클라우드 제공업체는 최종 사용자와 가까운 곳으로의 컴퓨팅 배치를 강요받고 있습니다. 250kW에서 1MW까지의 에지 노드가 소매점, 통신 허브, 지자체 쉼터에 설치되며, 각 시설에는 리튬 이온 UPS, 소형 발전기, 원격 관리 펌웨어가 장착되어 있습니다. 분산형 사이트는 전력 공급 라인의 전압 안정성과 정전 빈도가 크게 다르기 때문에 용량 계획을 복잡하게 합니다. 사업자는 듀얼 피드 자동 전환 스위치와 수백 개의 마이크로 시설에 걸쳐 경보를 집계하는 클라우드 기반 SCADA 대시보드를 통해 위험을 완화하고 있습니다. 컨텐츠 전달의 고속화에는 코덱 변환시의 전력 급증에 대응하기 위해, 보다 높은 버스트 전력도 요구되고 있어, 밀리 세컨드 단위의 전환을 실현하는 정적 스위치 UPS 토폴로지의 채용이 진행되고 있습니다. 수천 개의 엣지 사이트에서 발생하는 누적 효과는 전체 지역의 부하를 증가시키지만, 각 기지부는 허용되는 PUE 임계값을 엄격하게 하는 주 에너지 규제를 준수해야 합니다.
전력 및 냉각 설비 개수에 따른 고액의 초기 설비 투자
많은 기존 데이터센터는 5-15kW 랙용으로 설계되었으며, 40-140kW의 AI 부하를 수용하려면 대규모 개조가 필요합니다. 전기실에서는 변압기의 증설, 버스웨이의 경로 변경, 공냉식 CRAC 유닛에서 액체 냉각 칠러로의 교환이 자주 필요하며, 프로젝트 비용은 신규 건설의 기준치를 상회합니다. 운영자는 가동중인 작업 부하를 고려한 단계적인 공사를 실시할 필요가 없어, 공기가 장기화되어 리스크가 높아집니다. 소규모 공급자는 주요 고객이나 정부 인센티브가 없을 경우 대규모 전기 설비 업그레이드 자금 조달에 어려움을 겪습니다. 자금을 확보할 수 있는 경우에도 24kV 개폐 장치 및 3MVA UPS 프레임 공급망 리드 타임은 60주를 초과할 수 있습니다. 따라서 즉각적인 현금 지출은 AI 최적화 전력 솔루션의 단기적인 시장 침투를 방해합니다.
부문 분석
2025년 수익의 44.40%를 차지하는 부문은 모든 시설의 전기적 기반을 구성하는 배전 솔루션(개폐 장치, PDU, 버스웨이)이었습니다. 그러나 소유자가 설계, 통합 및 예지 보전 전문 지식을 필요로 하기 때문에 서비스 분야는 CAGR 6.98%로 확대되고 있습니다. 컨설팅 계약은 착공 몇 개월 전부터 시작되어 고조파 분석, 단락 연구, 에너지 저장의 ROI 모델링을 다룹니다. 통합 전문가는 다상 구축 전체에서 '단선식 계통도'의 무결성을 설계하여 유휴 용량을 회피합니다. 지원 팀은 UPS 모듈에 에지 분석 기능을 통합하고 SLA 위반 전에 자동으로 작업 지시서를 생성하는 데이터를 생성합니다. 이러한 부가가치 서비스는 고객 정착률을 높이고 하드웨어 공급업체를 장기 파트너로 전환합니다.
공급업체는 고급 가동 시간 계산을 가능하게 하는 펌웨어 업그레이드를 번들하여 배터리 수명을 연장하고 교체 사이클을 단축합니다. 노동력 부족이 심각한 지역에서는 리모트 핸즈 계약에 의해 적외선 스캔, 브레이커 조작, 과열 회피 대책을 실시합니다. 북미 데이터센터 전력 시장은 서비스 연금을 활용하여 메가 프로젝트 사이클 간의 수익을 평준화할 수 있기 때문에 혜택을 누리고 있습니다. 이를 통해 기업은 지역에 대규모 현지 요원을 유지하는 인센티브를 얻어 하이퍼스케일 고객에 대한 신속한 대응을 보장할 수 있습니다.
2025년에는 하이퍼스케일 캠퍼스가 47.55%의 점유율을 차지했으며, 그 규모 및 표준화된 전력 블록을 반영했습니다. 그러나 AI 추론이 소비자에게 계산 처리를 시프트시키는 동안 엣지 및 마이크로 데이터센터가 6.92%라는 가장 빠른 CAGR을 달성하고 있습니다. 이 포드는 설치 면적을 최소화하기 때문에 208/415V 배전과 고효율 라인 인터랙티브 UPS에 의존하며, 하이퍼스케일 시설에서 볼 수 있는 13.8kV 피더 및 더블 컨버전 UPS와는 대조적입니다. 따라서 북미 데이터센터 전력 시장 규모는 메가와트 수뿐만 아니라 단위 수 기반에서도 엣지 형태로 성장하고 있습니다.
병행하여 기업 시설은 하이브리드 모델을 채택하여 사설 클라우드 클러스터를 수용하기 위한 전력 용량을 확장하면서 지연에 민감한 작업을 이웃 엣지 노드로 오프로드합니다. 사업자는 단계적인 IT 확장에 맞추어 100kW 단위로 확장 가능한 모듈형 배터리 캐비닛을 채용하고 있습니다. 하이퍼스케일 건설 사업자는 직접 재생에너지 공급 라인과 단시간 구동 플라이휠 UPS를 결합하여 운영 비용 절감을 모색하고 있습니다. 설계 사상의 수렴으로 공급업체는 펌웨어와 모니터링 API를 공유하는 '패밀리'형 개폐 장치 및 UPS를 제공하여 시설 클래스를 가로질러 통합 비용 절감을 실현하고 있습니다.
기타 혜택 :
- 엑셀 형식 시장 예측(ME) 시트
- 애널리스트 서포트(3개월간)
자주 묻는 질문
목차
제1장 서론
- 조사의 전제조건 및 시장 정의
- 조사 범위
제2장 조사 방법
제3장 주요 요약
제4장 시장 상황
- 시장 개요
- 시장 성장 촉진요인
- 하이퍼스케일 및 메가 데이터센터 채용 확대
- 클라우드 컴퓨팅 및 OTT 트래픽 급증
- 엄격한 PUE 및 에너지 효율 규제
- BFSI(은행 및 금융 및 보험) 및 의료 분야의 디지털화에 수반하는 코로케이션 수요
- 전력 비용 안정화에 기여하는 유틸리티 규모의 재생에너지 PPA
- 지방 및 교외 클러스터에서 엣지 AI 마이크로 DC의 전개
- 시장 성장 억제요인
- 전력 및 냉각 설비 개수에 수반하는 고액의 초기 설비 투자 비용
- 주요 도시권에서의 송전 용량의 병목
- 인정 고전압 기술자의 부족
- 수냉식 냉각의 숨겨진 전력 페널티에 관한 정사
- 밸류체인 및 공급망 분석
- 규제 상황
- 기술 전망
- Porter's Five Forces
- 공급기업의 협상력
- 구매자의 협상력
- 신규 참가업체의 위협
- 대체품의 위협
- 경쟁 기업 간 경쟁 관계
- 직류 인프라에 대한 지정학적 영향
- 업계 생태계 분석
제5장 북미의 데이터센터 설치 상황 분석
- 북미의 데이터센터 현황 분석(IT 부하 용량 및 데이터센터 수에 기초)
- 북미의 레이 핫스팟 분석(해당 지역에서 상위 15의 핫스팟을 분석 대상으로 합니다.)
- 북미의 데이터센터 인프라에 대한 총 지출 분석
제6장 시장 규모 및 성장 예측
- 유형별
- 솔루션 유형별
- 전력 배전 솔루션
- 전송 스위치
- 개폐장치
- 전원 패널 및 부품
- 기타
- 전원 백업 솔루션
- UPS
- 발전기
- 전력 배전 솔루션
- 서비스 내용-설계 및 컨설팅, 시스템 통합, 지원 및 보수
- 솔루션 유형별
- 데이터센터 유형별
- 코로케이션 시설
- 기업 및 엣지 시설
- 하이퍼스케일 및 자사 건설 시설
- 최종 사용자 업계별
- BFSI
- IT 및 통신
- 정부 및 방위
- 제조업 및 산업 분야
- 미디어 및 엔터테인먼트
- 헬스케어 및 생명과학
- 소매 및 전자상거래
- 전력 용량별
- 500kW 이하
- 501kW-1MW
- 1.1-3 MW
- 3MW 이상
- 티어 기준별
- Tier I 및 II
- Tier III
- Tier IV
- 국가별
- 미국
- 캐나다
- 멕시코
제7장 경쟁 구도
- 시장 점유율 분석
- 기업 프로파일
- ABB Ltd
- Schneider Electric
- Vertiv Group Corp.
- Eaton Corp.(incl. Tripp Lite)
- Legrand(Raritan, Starline)
- nVent(Enlogic)
- Siemens AG
- Cummins Inc.
- Caterpillar Inc.
- Generac Power Systems
- Mitsubishi Electric
- Delta Electronics
- Huawei Technologies Co. Ltd.
- Piller Power Systems
- Kohler Co.
- LayerZero Power Systems
- Socomec Group
- Panduit Corp.
- Riello UPS
- Power Innovations International
- Starline(Legrand)
- Powin Energy
- Bloom Energy
제8장 시장 기회 및 장래 전망
- 화이트 스페이스 및 미충족 요구의 평가
The North America data center power market size in 2026 is estimated at USD 16.88 billion, growing from 2025 value of USD 15.81 billion with 2031 projections showing USD 23.39 billion, growing at 6.75% CAGR over 2026-2031.

Solid growth is tied to AI-centric workloads that push rack densities from 5-15 kW to 40-140 kW, forcing operators to modernize electrical architectures. Hyperscale campuses anchor demand as they build gigawatt-scale substations, while edge computing rolls out micro sites that need autonomous UPS and generator sets. Stricter efficiency regulations such as PUE thresholds are accelerating liquid-cooling adoption and battery-energy-storage integration. Renewable power purchase agreements (PPAs) signed in Texas, Quebec, and Alberta have become a hedge against volatile utility tariffs while meeting corporate sustainability goals. Heightened grid-capacity constraints in tier-1 metros now shift expansion toward secondary U.S. markets, hydro-rich Canadian provinces, and Mexico's emerging colocation hubs.
North America Data Center Power Market Trends and Insights
Rising Adoption of Hyperscale and Mega Data Centers
Hyperscale operators now plan multi-building campuses that draw hundreds of megawatts from on-site substations and deploy liquid-cooled GPU racks requiring continuous, high-quality power. Meta's USD 65 billion program targets sub-1.1 PUE across North American sites, underscoring how power design has become a cornerstone of sustainability commitments.Projects such as Alberta's Wonder Valley park pair natural-gas turbines with geothermal loops to create 1.4 GW of dedicated capacity, illustrating a shift toward self-generation when grid queues exceed four years. The clustering of campuses around cheap renewable resources generates regional load pockets that utilities must accommodate through accelerated transmission upgrades. Vendors that deliver factory-integrated switchgear, busways, and energy-storage modules win share by shortening electrification timelines and reducing site labor. The scale of investment also drives adoption of software-defined power monitoring that optimizes load placement and sequence-starts generators to prevent grid flicker.
Surge in Cloud Computing and OTT Traffic
Rapid growth in collaboration tools, streaming media, and generative AI inference pushes carriers and cloud providers to place compute closer to end users. Edge nodes ranging from 250 kW to 1 MW are now installed in retail strips, telco hubs, and municipal shelters, each fitted with lithium-ion UPS, compact gensets, and remote-management firmware. Distributed sites complicate capacity planning because utility feeders vary widely in voltage stability and outage frequency. Operators mitigate risk with dual-feed automatic transfer switches and cloud-based SCADA dashboards that aggregate alarms across hundreds of micro facilities. Content delivery acceleration also demands higher burst power to cover codec transcoding spikes, prompting adoption of static-switch UPS topologies that deliver millisecond transfer times. The cumulative effect of thousands of edge sites lifts overall regional load, yet each location must comply with state energy codes that increasingly cap allowable PUE thresholds.
High Upfront CAPEX for Power & Cooling Retrofits
Many brownfield data centers were designed for 5-15 kW racks and must be gutted to accommodate 40-140 kW AI loads. Electrical rooms often need transformer upsizing, busway rerouting, and replacement of air-cooled CRAC units with liquid chillers, driving project costs above new-build benchmarks. Operators must stage construction around live workloads, lengthening schedules and elevating risk. Smaller providers struggle to secure financing for large-scale electrical upgrades without anchor customers or government incentives. Even where funding is available, supply-chain lead times for 24-kV switchgear and 3 MVA UPS frames can exceed 60 weeks. The immediate cash outlay thus curbs near-term market penetration of AI-optimized power solutions.
Other drivers and restraints analyzed in the detailed report include:
- Stringent PUE / Energy-Efficiency Mandates
- Colocation Demand from BFSI and Healthcare Digitalization
- Grid-Capacity Bottlenecks in Tier-1 Metros
For complete list of drivers and restraints, kindly check the Table Of Contents.
Segment Analysis
The segment holding 44.40% of 2025 revenue remains power-distribution solutions-switchgear, PDU, and busway-that form the electrical backbone of every facility. However, services are expanding at a 6.98% CAGR because owners need design, integration, and predictive-maintenance expertise. Consulting engagements now begin months before ground-break, covering harmonic analysis, short-circuit studies, and energy-storage ROI modeling. Integration specialists engineer "single-line-diagram" conformity across multi-phase build-outs to avoid stranded capacity. Support teams embed edge analytics in UPS modules, generating data that auto-creates work orders before SLA breaches. Those value-added services raise stickiness, turning hardware suppliers into long-term partners.
Vendors bundle firmware upgrades that enable advanced runtime calculations, extending battery life and cutting replace-ment cycles. Where labor availability is tight, remote-hands contracts cover IR scanning, breaker racking, and thermal runway avoidance. The North America data center power market benefits because service annuities smooth revenue between mega-project cycles, incentivizing firms to maintain large regional field forces that in turn reassure hyperscale clients of rapid response times.
Hyperscale campuses held 47.55% share in 2025, reflecting their sheer size and standardized power blocks. Yet edge and micro data centers deliver the fastest 6.92% CAGR as AI inference shifts compute toward consumers. These pods rely on 208/415 V distribution with high-efficiency line-interactive UPS to minimize footprint, contrasting with 13.8 kV feeders and double-conversion UPS found in hyperscale builds. The North America data center power market size for edge form factors thus grows on a unit-count basis rather than megawatt alone.
In parallel, enterprise facilities embrace hybrid models, expanding electrical capacity to host private-cloud clusters while off-loading latency-sensitive tasks to nearby edge nodes. Operators adopt modular battery cabinets that scale in 100 kW increments, matching phased IT expansions. Hyperscale builders experiment with direct renewable feeders combined with short-duration flywheel UPS to shave opex. The convergence of design philosophies drives suppliers to offer "families" of switchgear and UPS that share firmware and monitoring APIs, cutting integration costs across facility classes.
The North America Data Center Power Market Report is Segmented by Type (Solution, and Service), Data Center Type (Colocation, Hyperscale, and More), End-User Industry (BFSI, IT and Telecom, and More), Power Capacity (<= 500 KW, Greater Than 3 MW, and More), Tier Standard (Tier I and II, Tier IV, and More), and Geography (United States, Canada and More). Market Forecasts are Provided in Terms of Value (USD).
List of Companies Covered in this Report:
- ABB Ltd
- Schneider Electric
- Vertiv Group Corp.
- Eaton Corp. (incl. Tripp Lite)
- Legrand (Raritan, Starline)
- nVent (Enlogic)
- Siemens AG
- Cummins Inc.
- Caterpillar Inc.
- Generac Power Systems
- Mitsubishi Electric
- Delta Electronics
- Huawei Technologies Co. Ltd.
- Piller Power Systems
- Kohler Co.
- LayerZero Power Systems
- Socomec Group
- Panduit Corp.
- Riello UPS
- Power Innovations International
- Starline (Legrand)
- Powin Energy
- Bloom Energy
Additional Benefits:
- The market estimate (ME) sheet in Excel format
- 3 months of analyst support
TABLE OF CONTENTS
1 INTRODUCTION
- 1.1 Study Assumptions and Market Definition
- 1.2 Scope of the Study
2 RESEARCH METHODOLOGY
3 EXECUTIVE SUMMARY
4 MARKET LANDSCAPE
- 4.1 Market Overview
- 4.2 Market Drivers
- 4.2.1 Rising adoption of hyperscale and mega data centers
- 4.2.2 Surge in cloud computing and OTT traffic
- 4.2.3 Stringent PUE / energy-efficiency mandates
- 4.2.4 Colocation demand from BFSI and healthcare digitalization
- 4.2.5 Utility-scale renewable PPAs stabilising power costs
- 4.2.6 Edge-AI micro DC rollout in rural and suburban clusters
- 4.3 Market Restraints
- 4.3.1 High upfront CAPEX for power and cooling retrofits
- 4.3.2 Grid-capacity bottlenecks in Tier-1 metros
- 4.3.3 Shortage of certified high-voltage technicians
- 4.3.4 Water-based cooling's hidden power penalty scrutiny
- 4.4 Value / Supply-Chain Analysis
- 4.5 Regulatory Landscape
- 4.6 Technological Outlook
- 4.7 Porter's Five Forces
- 4.7.1 Bargaining Power of Suppliers
- 4.7.2 Bargaining Power of Buyers
- 4.7.3 Threat of New Entrants
- 4.7.4 Threat of Substitutes
- 4.7.5 Intensity of Competitive Rivalry
- 4.8 Geopolitical Impact on DC Infrastructure
- 4.9 Industry Ecosystem Analysis
5 ANALYSIS OF DATA CENTER FOOTPRINT IN NORTH AMERICA
- 5.1 Analysis of current DC footprint in terms of IT load capacity and of Data Centers in the North America
- 5.2 Analysis of ley hotspots in the North America (top 15 hotspots will be analyzed in the region)
- 5.3 Analysis of overall spending on Data Center Infrastructure in North America
6 MARKET SIZE AND GROWTH FORECASTS (VALUE, USD)
- 6.1 By Type
- 6.1.1 By Solution Type
- 6.1.1.1 Power Distribution Solutions
- 6.1.1.1.1 Transfer Switches
- 6.1.1.1.2 Switchgear
- 6.1.1.1.3 Power Panels and Components
- 6.1.1.1.4 Others
- 6.1.1.2 Power Backup Solutions
- 6.1.1.2.1 UPS
- 6.1.1.2.2 Generators
- 6.1.1.1 Power Distribution Solutions
- 6.1.2 Service - Design and Consulting, Integration, Support and Maintenance
- 6.1.1 By Solution Type
- 6.2 By Data Center Type
- 6.2.1 Colocation Facilities
- 6.2.2 Enterprise/Edge Facilities
- 6.2.3 Hyperscale/Self-built Facilities
- 6.3 By End-User Industry
- 6.3.1 BFSI
- 6.3.2 IT and Telecom
- 6.3.3 Government and Defense
- 6.3.4 Manufacturing and Industrial
- 6.3.5 Media and Entertainment
- 6.3.6 Healthcare and Life Sciences
- 6.3.7 Retail and E-commerce
- 6.4 By Power Capacity
- 6.4.1 less than or equal to 500 kW
- 6.4.2 501 kW - 1 MW
- 6.4.3 1.1 - 3 MW
- 6.4.4 greater than 3 MW
- 6.5 By Tier Standard
- 6.5.1 Tier I and II
- 6.5.2 Tier III
- 6.5.3 Tier IV
- 6.6 By Country
- 6.6.1 United States
- 6.6.2 Canada
- 6.6.3 Mexico
7 COMPETITIVE LANDSCAPE
- 7.1 Market Share Analysis
- 7.2 Company Profiles (includes Global level Overview, Market level overview, Core Segments, Financials as available, Strategic Information, Market Rank/Share for key companies, Products and Services, and Recent Developments)
- 7.2.1 ABB Ltd
- 7.2.2 Schneider Electric
- 7.2.3 Vertiv Group Corp.
- 7.2.4 Eaton Corp. (incl. Tripp Lite)
- 7.2.5 Legrand (Raritan, Starline)
- 7.2.6 nVent (Enlogic)
- 7.2.7 Siemens AG
- 7.2.8 Cummins Inc.
- 7.2.9 Caterpillar Inc.
- 7.2.10 Generac Power Systems
- 7.2.11 Mitsubishi Electric
- 7.2.12 Delta Electronics
- 7.2.13 Huawei Technologies Co. Ltd.
- 7.2.14 Piller Power Systems
- 7.2.15 Kohler Co.
- 7.2.16 LayerZero Power Systems
- 7.2.17 Socomec Group
- 7.2.18 Panduit Corp.
- 7.2.19 Riello UPS
- 7.2.20 Power Innovations International
- 7.2.21 Starline (Legrand)
- 7.2.22 Powin Energy
- 7.2.23 Bloom Energy
8 MARKET OPPORTUNITIES AND FUTURE OUTLOOK
- 8.1 White-space and Unmet-Need Assessment
