
|
시장보고서
상품코드
1910556
수소 가스 시장 : 점유율 분석, 업계 동향 및 통계, 성장 예측(2026-2031년)Hydrogen Gas - Market Share Analysis, Industry Trends & Statistics, Growth Forecasts (2026 - 2031) |
||||||
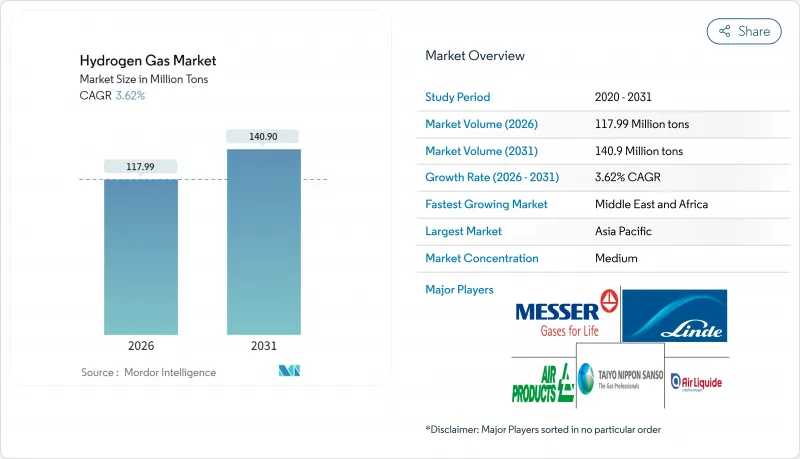
세계의 수소 가스 시장은 2025년 1억 1,386만 톤에서 2026년에는 1억 1,799만 톤으로 성장하고, 2026년부터 2031년까지 CAGR 3.62%로 성장을 지속하여 1억 4,090만 톤에 달할 것으로 예측되고 있습니다.
비용 경쟁력을 바탕으로 지역간 경쟁, 정부 보조금, 탈탄소화 의무가 수소 가스 시장을 형성하는 주요 요인으로, 일본은 전국 인프라 정비에 200억 달러를 계상하고 유럽연합(EU)은 2030년까지 천연 가스망에 수소 20% 혼합을 추진하고 있습니다. 생산 거점과 탄소 배출량은 전략적 배치를 결정하는 요소가 되어, 생산자는 저비용 재생에너지나 천연 가스 자원 근처에 전해 시설이나 블루 수소 제조 시설을 병설하도록 촉구되고 있습니다. 중동과 호주에서의 신흥 수출 거점은 새로운 무역의 차원을 더해 연료전지 차량의 꾸준한 보급은 기반 수요를 구축하고, 보다 광범위한 급유 네트워크를 지원하는 기반이 되고 있습니다.
세계의 수소 가스 시장 동향과 전망
저탄소 암모니아 생산에 대한 수요
해운업계의 탈탄소화가 그린 암모니아 수요를 환기하고, 운송업자가 탄소중립적인 연료보급 솔루션을 요구하는 가운데 수소 가스 시장의 중요성이 높아지고 있습니다. 국제해사기관(IMO)의 2050년 넷제로 공약은 생산자의 전환을 가속화하고 있으며, Yara 및 Engie는 재생가능 에너지를 비료 복합시설에 연결하여 탄소가 제약된 시장에서 수출 적격성을 확보하고 있습니다. 경쟁 우위는 단순한 원료 가격이 아닌 수소의 탄소 강도에 달려 있으며, 암모니아 관련 수소량에 장기적인 구조적 성장을 가져옵니다.
정유소 탈황 규제
2020년 IMO 유황 규제 상한 및 지역별 연료 품질 기준에 따라 정유소용 수소 수요는 약 15% 증가하여 수소 가스 시장에서 베이스 로드 수요의 기반이 확립되었습니다. 고점도 원유의 처리에는 보다 고도의 수소화 처리가 필요하기 때문에 정유소 인접지에서 블루 수소 투자가 촉진되고 있습니다. 이러한 독점 통합 모델은 수요의 확실성을 보장하고 공유 유틸리티를 통한 탄소 포집의 경제성을 간소화합니다.
그린 및 블루 수소 생산의 높은 비용
그린 수소의 생산 비용은 재생 가능 전력 가격과 전해 장치의 성능에 따라 현재 1kg 당 3-8달러의 범위이며, 1-2달러인 회색 수소를 능가하고 있습니다. 블루 수소는 비용 차이를 줄이지만 탄소 포집 비용과 규제 당국의 모니터링을 수반합니다. 현 시점에서는 탄소가격제도에 준거한 고부가가치 용도만이 이러한 비용 증가를 흡수할 수 있고, 수소 가스 시장 전체에서의 보급은 일시적으로 제한되고 있습니다.
부문 분석
파이프라인 네트워크는 대규모 산업회랑이 기존의 통행권 자산을 활용하는 가운데 2025년 수소 가스 시장 점유율의 58.36%를 차지했으며, 이 운송방식은 2031년까지 연평균 복합 성장률(CAGR) 4.06%로 확대되고 있습니다. 유럽 수소 백본 계획의 28,000km에 이르는 파이프라인 네트워크는 도로 트레일러 운송과 비교하여 운송 비용을 30-50% 절감하여 수소 가스 시장 전반에 걸친 규모의 경제성을 강화합니다. 고압 튜브 트레일러는 고립된 수요 기지 및 초기 단계 도입에 여전히 중요하며, 실린더는 특수 용도 및 원격지 사용자를 위해 사용됩니다.
기존 가스망이 없는 신흥 시장에서는 튜브 트레일러 물류가 정비 격차를 메우는 가교가 되어, 높은 수송 비용에도 불구하고 조기 도입을 촉진합니다. 유럽과 미국에서 인가 절차가 가속되는 가운데 전용 수소 파이프라인은 정제 클러스터에서 철강 및 화학 플랜트로 확대하여 산업 탈탄소화의 심화와 수소 가스 시장의 확대에 필요한 기반을 제공합니다.
수소 가스 시장 보고서는 유통 형태(파이프라인, 고압 튜브 트레일러, 실린더), 용도(암모니아, 메탄올, 정제, 직접 환원철, 연료전지차, 기타 용도), 지역(아시아태평양, 북미, 유럽, 남미, 중동 및 아프리카)별로 분석되고 있습니다. 시장 예측은 수량(톤) 단위로 제공됩니다.
지역별 분석
2025년 수소 가스 시장 규모의 34.12%를 아시아태평양이 차지했으며, 중국의 중공업 분야에서 도입 확대, 일본의 수소 사회 구상, 한국의 연료전지 발전 도입이 견인역이 되고 있습니다. 중국의 탄소 중립 공약과 수소제철 파일럿 프로젝트가 이 지역 수요량을 높은 수준으로 유지하고 있습니다. 일본의 200억 달러 규모의 공적 자금은 공급 및 수요 인프라 양쪽의 정비를 가속시키고 있으며, 한국의 K-뉴딜에서는 수소를 전력 및 교통 목표에 통합하고 있습니다.
유럽은 REPowerEU 계획에 따라 가스 공급 다양화의 전략적 수단으로 수소를 자리 매김하고 국내 전해 장치 건설 및 수입 터미널 투자를 촉진하고 있습니다. 독일은 전해 설비 용량으로 선두를 달리고 네덜란드는 로테르담을 세계 수소 수송의 유럽 수입 거점으로 재구축 중입니다. 북유럽의 수력 및 풍력 자원은 그린 수소 수출의 기반이 되고, 노르웨이는 유럽 수요에 대응하는 파이프라인 및 해상 수송 루트의 개척을 진행하고 있습니다.
북미는 풍부한 천연가스 매장량을 살려 블루 수소의 경제성을 추구하는 동시에 95억 달러 규모의 수소 허브 계획으로 그린 수소 생산을 확대하고 있습니다. 캘리포니아의 저탄소 연료 기준은 아시아 이외의 세계 최대 규모의 충전 네트워크를 지원하고 캐나다는 아시아 액화 수소 수출을 통한 수출 가격 경쟁력 달성을 목표로 하고 있습니다. 중동 및 아프리카는 4.03%라는 가장 빠른 CAGR을 기록하고 있으며, 사우디아라비아의 NEOM 프로젝트와 UAE의 수출 로드맵이 견인 역할을 하고 있습니다. 이러한 노력은 풍부한 태양광 자원과 대규모 전해 기술을 결합하여 현지 산업과 해외 소비자 모두에게 공급하는 것을 목표로 하고 있습니다.
기타 혜택:
- 엑셀 형식 시장 예측(ME) 시트
- 애널리스트에 의한 3개월간의 지원
자주 묻는 질문
목차
제1장 서론
- 조사의 전제조건과 시장의 정의
- 조사 범위
제2장 조사 방법
제3장 주요 요약
제4장 시장 상황
- 시장 개요
- 시장 성장 촉진요인
- 저탄소 암모니아 생산에 대한 수요
- 정유소 탈황 규제
- 그린수소에 대한 정부의 장려책
- 연료전지차 도입 확대
- 수소 가스 혼입 의무화
- 시장 성장 억제요인
- 그린/블루 수소의 높은 생산비용
- 고비용의 저장 및 수송 물류
- 신규 수소 파이프라인에 대한 지역 주민의 반대
- 밸류체인 분석
- Porter's Five Forces
- 공급기업의 협상력
- 구매자의 협상력
- 신규 참가업체의 위협
- 대체품의 위협
- 경쟁 기업간 경쟁 관계
제5장 시장 규모와 성장 예측
- 유통별
- 파이프라인
- 고압 튜브 트레일러
- 실린더
- 용도별
- 암모니아
- 메탄올
- 정제
- 직접 환원철(DRI)
- 연료전지자동차(FCV)
- 기타 용도
- 지역별
- 아시아태평양
- 중국
- 인도
- 일본
- 한국
- ASEAN 국가
- 기타 아시아태평양
- 북미
- 미국
- 캐나다
- 멕시코
- 유럽
- 독일
- 영국
- 프랑스
- 이탈리아
- 러시아
- 북유럽 국가
- 기타 유럽
- 남미
- 브라질
- 아르헨티나
- 기타 남미
- 중동 및 아프리카
- 사우디아라비아
- 남아프리카
- 기타 중동 및 아프리카
- 아시아태평양
제6장 경쟁 구도
- 시장 집중도
- 전략적 동향
- 시장 점유율/순위 분석
- 기업 프로파일
- Aditya Birla Chemicals
- Air Liquide
- Air Products and Chemicals, Inc.
- BASF SE
- Equinor ASA
- Gulf Cryo
- Iwatani Corp.
- Kawasaki Heavy Industries, Ltd.
- Linde plc
- MATHESON Tri-Gas, Inc.
- Messer SE & Co. KGaA
- TAIYO NIPPON SANSO CORPORATION
제7장 시장 기회와 미래 전망
SHW 26.01.26The Hydrogen Gas Market is expected to grow from 113.86 million tons in 2025 to 117.99 million tons in 2026 and is forecast to reach 140.9 million tons by 2031 at 3.62% CAGR over 2026-2031.

Cost-driven regional competitiveness, government subsidies, and decarbonization mandates are the principal forces shaping the hydrogen gas market, with Japan earmarking USD 20 billion for nationwide infrastructure and the European Union pressing toward a 20% hydrogen blend in natural-gas grids by 2030. Production location and carbon intensity now dictate strategic positioning, pushing producers to co-locate electrolysis or blue-hydrogen facilities near low-cost renewable or natural-gas resources. Emerging export hubs in the Middle East and Australia add a new trade dimension, while the steady rollout of fuel-cell vehicles builds anchor demand that underwrites a wider refueling network.
Global Hydrogen Gas Market Trends and Insights
Demand for Low-Carbon Ammonia Production
Global maritime decarbonization triggers demand for green ammonia, elevating the hydrogen gas market as shippers seek carbon-neutral bunkering solutions. The International Maritime Organization's 2050 net-zero pledge accelerates producer pivots, with Yara and Engie linking renewable power to fertilizer complexes to safeguard export eligibility in carbon-constrained markets. Competitive advantage now hinges on hydrogen carbon intensity rather than merely feedstock price, injecting long-term structural growth into ammonia-linked hydrogen volumes.
Refinery Desulfurization Regulations
The 2020 IMO sulfur cap and regional fuel-quality standards lifted refinery hydrogen offtake by nearly 15%, anchoring base-load demand in the hydrogen gas market. Heavier crude slates need deeper hydroprocessing, prompting blue-hydrogen investments adjacent to refineries. These captive integration models ensure offtake certainty and streamline carbon-capture economics through shared utilities.
High Cost of Green/Blue H2 Production
Green hydrogen currently ranges between USD 3 and 8 per kg depending on renewable electricity pricing and electrolyzer performance, outstripping gray alternatives at USD 1-2 per kg. Blue hydrogen narrows the gap but entails carbon-capture costs and regulatory scrutiny. Only premium applications with carbon-pricing compliance can presently absorb these premiums, temporarily limiting widespread uptake across the hydrogen gas market.
Other drivers and restraints analyzed in the detailed report include:
- Government Incentives for Green H2
- Rising Fuel-Cell Vehicle Rollout
- Expensive Storage and Transport Logistics
For complete list of drivers and restraints, kindly check the Table Of Contents.
Segment Analysis
Pipeline networks captured 58.36% of the hydrogen gas market share in 2025 as large industrial corridors exploit existing right-of-way assets, and this modality is growing at 4.06% CAGR through 2031. The European Hydrogen Backbone's planned 28,000 km of lines will lower delivered costs by 30-50% relative to road trailers, reinforcing scale economies across the hydrogen gas market. High-pressure tube trailers remain crucial for islanded demand centers and early-stage deployments, while cylinders serve specialized or remote users.
In emerging markets without legacy gas grids, tube-trailer logistics bridge the readiness gap, fostering early adoption despite premium transport costs. As permitting accelerates in Europe and the United States, dedicated hydrogen pipelines will broaden from refining clusters to include steel and chemical plants, providing the backbone required for deeper industrial decarbonization and wider hydrogen gas market reach.
The Hydrogen Gas Market Report is Segmented by Distribution (Pipeline, High-Pressure Tube Trailer, and Cylinder), Application (Ammonia, Methanol, Refining, Direct Reduced Iron, Fuel-Cell Vehicles, and Other Applications), and Geography (Asia-Pacific, North America, Europe, South America, and Middle East and Africa). The Market Forecasts are Provided in Terms of Volume (Tons).
Geography Analysis
Asia-Pacific accounted for 34.12% of the hydrogen gas market size in 2025, anchored by China's heavy-industry uptake, Japan's hydrogen-society agenda, and South Korea's fuel-cell power rollouts. China's carbon-neutrality pledge and pilot hydrogen-steel projects keep regional volumes elevated. Japan's USD 20 billion public-funding pool accelerates both supply and demand infrastructure, while South Korea's K-New Deal integrates hydrogen into power and transport goals.
Europe positions hydrogen as a strategic lever for gas-supply diversification under REPowerEU, catalyzing domestic electrolyzer builds and import-terminal investments. Germany leads installed electrolysis capacity, and the Netherlands is remaking Rotterdam into a continental intake hub for global hydrogen shipments. Nordic hydro and wind resources underpin green-hydrogen export ambitions, with Norway exploring pipeline and maritime routes to serve continental demand.
North America leverages ample natural-gas reserves for blue-hydrogen economics while boosting green output under the USD 9.5 billion hydrogen-hubs program. California's Low Carbon Fuel Standard underwrites the world's largest non-Asian refueling network, and Canada targets export parity with liquefied shipments to Asia. Middle East and Africa score the fastest 4.03% CAGR, led by Saudi Arabia's NEOM and the UAE's export road map, stitching together sun-rich renewable resources with scale electrolysis to supply both local industry and overseas consumers.
- Aditya Birla Chemicals
- Air Liquide
- Air Products and Chemicals, Inc.
- BASF SE
- Equinor ASA
- Gulf Cryo
- Iwatani Corp.
- Kawasaki Heavy Industries, Ltd.
- Linde plc
- MATHESON Tri-Gas, Inc.
- Messer SE & Co. KGaA
- TAIYO NIPPON SANSO CORPORATION
Additional Benefits:
- The market estimate (ME) sheet in Excel format
- 3 months of analyst support
TABLE OF CONTENTS
1 Introduction
- 1.1 Study Assumptions and Market Definition
- 1.2 Scope of the Study
2 Research Methodology
3 Executive Summary
4 Market Landscape
- 4.1 Market Overview
- 4.2 Market Drivers
- 4.2.1 Demand for Low-Carbon Ammonia Production
- 4.2.2 Refinery Desulfurization Regulations
- 4.2.3 Government Incentives for Green H2
- 4.2.4 Rising Fuel-Cell Vehicle Rollout
- 4.2.5 Hydrogen-Gas-Grid Blending Mandates
- 4.3 Market Restraints
- 4.3.1 High Cost of Green/Blue H2 Production
- 4.3.2 Expensive Storage and Transport Logistics
- 4.3.3 Community Opposition to New H2 Pipelines
- 4.4 Value Chain Analysis
- 4.5 Porter's Five Forces
- 4.5.1 Bargaining Power of Suppliers
- 4.5.2 Bargaining Power of Buyers
- 4.5.3 Threat of New Entrants
- 4.5.4 Threat of Substitutes
- 4.5.5 Competitive Rivalry
5 Market Size and Growth Forecasts (Volume)
- 5.1 By Distribution
- 5.1.1 Pipeline
- 5.1.2 High-pressure tube trailer
- 5.1.3 Cylinder
- 5.2 By Application
- 5.2.1 Ammonia
- 5.2.2 Methanol
- 5.2.3 Refining
- 5.2.4 Direct Reduced Iron (DRI)
- 5.2.5 Fuel-cell Vehicles (FCVs)
- 5.2.6 Other Applications
- 5.3 By Geography
- 5.3.1 Asia-Pacific
- 5.3.1.1 China
- 5.3.1.2 India
- 5.3.1.3 Japan
- 5.3.1.4 South Korea
- 5.3.1.5 ASEAN Countries
- 5.3.1.6 Rest of Asia-Pacific
- 5.3.2 North America
- 5.3.2.1 United States
- 5.3.2.2 Canada
- 5.3.2.3 Mexico
- 5.3.3 Europe
- 5.3.3.1 Germany
- 5.3.3.2 United Kingdom
- 5.3.3.3 France
- 5.3.3.4 Italy
- 5.3.3.5 Russia
- 5.3.3.6 NORDIC Countries
- 5.3.3.7 Rest of Europe
- 5.3.4 South America
- 5.3.4.1 Brazil
- 5.3.4.2 Argentina
- 5.3.4.3 Rest of South America
- 5.3.5 Middle East and Africa
- 5.3.5.1 Saudi Arabia
- 5.3.5.2 South Africa
- 5.3.5.3 Rest of Middle East and Africa
- 5.3.1 Asia-Pacific
6 Competitive Landscape
- 6.1 Market Concentration
- 6.2 Strategic Moves
- 6.3 Market Share/Ranking Analysis
- 6.4 Company Profiles (includes Global level Overview, Market level overview, Core Segments, Financials as available, Strategic Information, Market Rank/Share for key companies, Products and Services, and Recent Developments)
- 6.4.1 Aditya Birla Chemicals
- 6.4.2 Air Liquide
- 6.4.3 Air Products and Chemicals, Inc.
- 6.4.4 BASF SE
- 6.4.5 Equinor ASA
- 6.4.6 Gulf Cryo
- 6.4.7 Iwatani Corp.
- 6.4.8 Kawasaki Heavy Industries, Ltd.
- 6.4.9 Linde plc
- 6.4.10 MATHESON Tri-Gas, Inc.
- 6.4.11 Messer SE & Co. KGaA
- 6.4.12 TAIYO NIPPON SANSO CORPORATION
7 Market Opportunities and Future Outlook
- 7.1 White-space and Unmet-need Assessment
