
|
시장보고서
상품코드
1910885
사륜차 및 삼륜차 : 시장 점유율 분석, 업계 동향 및 통계, 성장 예측(2026-2031년)Quadricycle And Tricycle - Market Share Analysis, Industry Trends & Statistics, Growth Forecasts (2026 - 2031) |
||||||
사륜차 및 삼륜차 시장은 2025년 89억 1,000만 달러로 평가되었으며, 2026년 98억 5,000만 달러에서 2031년까지 162억 9,000만 달러에 이를 것으로 예상됩니다. 예측 기간(2026-2031년)에 있어서 CAGR은 10.58%를 나타낼 것으로 전망됩니다.

이 성장은 도시 지역의 배송 밀도 증가, 전기자동차 소유 비용을 줄이는 국가 인센티브 프로그램, 소형 및 저 배출 운송 수단을 촉진하는 규제 프레임 워크에 의해 견인되었습니다. 현재 내연기관 제품은 출하를 지배하고 있지만, 배터리 비용의 지속적인 감소와 교체 네트워크의 다운타임 감소로 인해 전기 모델이 생산 라인의 시간을 확보하고 있습니다. 유럽의 엄격한 배출 규제와 인도의 BS7 규제 도입 계획이 비용 계산을 재구축하는 한편, 이집트의 툭툭 대체 계획은 사륜 마이크로 EV의 정식 인가가 새로운 수요를 창출하는 좋은 예입니다. 주요 자동차 제조업체는 마이크로모빌리티를 신규 참가의 수익원으로 자리매김해, 지역 정책에 호응한 제품 라인 확충을 진행하고 있습니다. 이러한 요인이 함께, 사륜차 및 삼륜차 시장은 화물·여객 양 분야에서 급격한 보급 곡선을 그리고 있습니다.
세계의 사륜차 및 삼륜차 시장 동향과 인사이트
E-삼륜차/마이크로EV용 정부 보조금·우대조치
인센티브 방식으로 전기차와 가솔린차의 가격차가 점차 줄어들고 있습니다. 인도의 생산 연동형 인센티브 제도에서는 현지 부품 생산의 촉진과 단가 저감을 목적으로 하는 다액의 자금이 배분되어 있습니다. 태국의 EV 3.5 정책에서는 전동 삼륜차를 조립하는 기업에 대해 대폭적인 법인세 감면이 적용됩니다. 한편, 몰타는 사륜차 구입에 현저한 재정 조성에 의한 인센티브를 제공합니다. 중국은 소형 차량의 구매세 면제를 수년간 연장해, 그 대처를 강조하는 움직임을 보이고 있습니다. 이러한 조치는 배터리 비용이 낮아짐에 따라 전기자동차 판매 확대를 목표로합니다. 이러한 예측 가능한 인센티브를 배경으로 제조업체들은 설비 투자 위험을 줄이고 공장 가동률을 향상시키는 수단으로 생산 능력 계획을 확대하고 있습니다.
증가하는 전자상거래 마일리지 배송 수요
도시 지역의 배송 비용은 총 배송비의 약 5분의 4를 차지하기 때문에 차량 관리자는 주차 시간과 정체 요금을 줄일 수 있는 차량을 찾고 있습니다. 아마존은 유럽 주요 도시에서 전동 삼륜 화물차의 시험 운용을 실시하고, 플립 카트는 인도의 도시 허브에 배터리 교환 기능이 있는 삼륜차를 배치하고 있습니다. Gogoro와 Sun Mobility의 Battery Az A Service(BaaS) 모델은 자산 가동률을 높게 유지하여 운전자가 항속 거리의 불안 없이 장시간 전환를 해낼 수 있도록 합니다. 저 배출 가스 지역의 규제 강화와 함께 이러한 경제성은 루트 계획을 컴팩트한 전기자동차로 기울이고 있습니다. 따라서 소포 배송량 증가는 섀시 수주로 직접 연결되어 부품 제조업체에게 선순환을 지속시키고 있습니다.
급속 충전/교환 인프라 부족
신흥 시장의 대부분에서는 충전소 설치 밀도가 국제 에너지 기관(IEA)의 가이드라인인 '차량 10대당 충전기 1기'를 밑돌고 있습니다. 민간투자자는 이용률이 불투명한 지역에서는 망설이고 공공계획 담당자는 특히 지방에서 예산 제약에 직면하고 있습니다. 전력망이 불안정한 지역에서는 사업자가 상용 차량의 가동률을 보장하기 위해 고생하고 있습니다. 충전기에 보조금을 제공하는 정부도 있지만 정비속도는 여전히 수요를 따라잡지 못하고 전기차 판매를 둔화시키고 있습니다. 에너지 공급을 예측할 수 없는 상황에서 함대 관리자는 내연 기관 모델의 구매를 계속할 수 있으며 완전 전기화의 전환점을 지연시킬 수 있습니다.
부문 분석
2025년에 있어서 사륜차 및 삼륜차 시장 점유율에서는 삼륜차가 압도적인 87.05%를 차지했습니다. 이것은 인도, 태국, 인도네시아에서 확립된 제조 기지 그룹에 의해 지원된 결과입니다. 삼륜차 시장 규모는 꾸준히 확대될 것으로 예측되지만, 사륜차 형식에 비하면 성장률은 완만해질 전망입니다. 사륜차 및 삼륜차는 절대 수량이야말로 작은 것, 유럽과 북아프리카의 정책이 안전성과 날씨 보호를 이유로 밀폐 캐빈을 우대하고 있기 때문에 2031년까지 연평균 복합 성장률(CAGR) 10.62%를 나타낼 것으로 예측됩니다. 버저지 오토는 이집트의 대체 프로그램을 위해 쿼트 생산을 확대하고 있으며, 피아지오는 유럽의 밀집 도시 지역을 위해 포터 기반 마이크로 EV 플랫폼을 개선하고 있습니다. 따라서 지역별 보급 패턴은 비용 우선순위, 기후 조건, 차량 등급을 다른 기준으로 분류하는 규제 등 복잡한 요소가 혼합되어 형성됩니다.
삼륜차 플랫폼은 배터리 교환 호환성과 텔레매틱스를 통합하고 그 존재의 의의를 유지하기 위해 진화를 계속하고 있습니다. 사륜차 설계에서는 배터리의 중량을 상쇄하기 위해 지붕 설치형 태양 어시스트나 경량 복합재를 채용하게 되었습니다. 이를 통해 OEM 각사는 단일 플랫폼을 지역 횡단적으로 밀어붙이는 것이 아니라, 다른 사용자 요건에 맞춘 R&D 파이프라인을 구축하고 있습니다. 경쟁 우위는 부품을 공유하면서 지역별 규제 적합성을 조정할 수 있는 모듈식 구조에 따라 달라지므로 유연성과 적응성이 실현됩니다. 선진 운전자 경보 시스템과 기본 연결 기능의 통합은 사륜 모델이 '사고 제로' 안전 목표를 내걸고 있는 도시에서의 규제 승인 취득에도 기여하고 있습니다. 자금원이 제로 방출 목표와 일치함에 따라, 사륜차 및 삼륜차 시장은 다양해지고, 두 형식이 완전히 통합되는 것이 아니라 공존하는 형태로 전환하고 있습니다.
2025년 시점에서 상용 운영은 사륜차 및 삼륜차 시장 규모의 73.10%를 차지했고 소포 배송 네트워크의 커버 범위 확대에 따라, 이 점유율은 더욱 증가할 것으로 예상됩니다. 상업 운용은 예측 가능한 루트 밀도와 저배출 구역에서의 요금 면제에 힘입어 2031년까지 연평균 복합 성장률(CAGR) 10.7%를 나타낼 것으로 예측되고 있습니다. 남아시아 전역에서는 승합 형식이 여전히 라이드 쉐어링과 비공식 택시 서비스를 지배하고 있지만, 새로운 지하철 노선과 버스 고속 운송 시스템의 도입으로 성장은 둔화 경향이 있습니다. 대규모 전자상거래 플랫폼은 전용 조립 라인을 지원하는 수량 보증을 제공하며 공급업체가 다년간 계약을 확보할 수 있도록 합니다.
플릿 소유자는 밀폐형 캐빈이나 공조 시스템의 도입에 의해 드라이버의 정착율 향상에 임하고 있습니다. 이를 통해 편안함을 향상시키면서 킬로미터당 비용을 낮게 억제할 수 있습니다. 도시계획 담당자는 주거지 근처에 마이크로 물류 거점을 지정하고 이동거리를 단축함으로써 콤팩트한 화물 공간의 적성을 강조하고 있습니다. 소프트웨어 제공업체는 현재 삼륜차 전용 루트 계획 기능을 통합하여 피크 시 정체에 연료 또는 배터리 소모를 줄입니다. 승용 유닛은 규제가 허용하는 범위에서 관광 셔틀과 캠퍼스 운송으로 전환하고 있습니다. 예측 기간에 사륜차 및 삼륜차 시장은 일반 여객 운송에서 수익성이 높고 자산 회전율 향상을 정당화하는 전문적인 화물 생태계로 전환하고 있습니다.
지역별 분석
2025년 시점에서 아시아태평양은 사륜차 및 삼륜차 시장의 41.05%를 차지했으며, 인도의 광범위한 삼륜차 제조거점과 중국의 리튬철 인산염화학에서 규모의 우위성이 이를 지원했습니다. 인도의 중요한 생산 연동형 보조금(PLI) 시스템은 공급망을 재구성하고 배터리 제조업체와 부품 공급업체 모두를 끌어들입니다. 한편 중국에서는 저출력 차량에 대한 구매세 면제를 연장하여 마이크로EV의 비용 경쟁력을 확보하고 있습니다. 태국의 EV 프로그램은 이 나라를 지역 수출 거점으로 자리매김하고 인도네시아와 필리핀과공급 기반을 원활하게 연계하고 있습니다. 이 전략적 연계는 국경을 넘어선 경제활동이 리드타임을 단축하고 재고사이클을 효율화하기 때문에 사륜차 및 삼륜차 시장에 이익을 가져옵니다.
유럽은 현재의 출하 대수가 소규모이지만, 2031년까지 연평균 복합 성장률(CAGR) 10.65%를 나타낼 것으로 예측되고 있습니다. 이것은 지자체가 정체요금제도와 주차공간삭감을 법제화하고 있는 것이 성장의 원동력입니다. 런던의 초저 배출 구역에서는 적합 사륜 경차가 면제 대상이 되고, 파리에서는 노상 주차 공간을 삭감하는 것으로 주민의 콤팩트 카 선택을 촉진하고 있습니다. 몰타의 사륜 경차에 대한 우대 조치와 규칙 168/2013에 따른 표준화된 규정이 결합되어 형식 인증 프로세스가 효율화되었습니다. 이 명확한 틀을 활용해, 제조업체 각사는 EU 전역에서의 발매를 계획해, 연구 개발 코스트를 복수 시장에서 분산시키는 것과 동시에, 이 지역에 있어서 사륜차 및 삼륜차 시장에서의 존재감을 강화하고 있습니다.
북미에서는 신중하면서도 페이스를 올리고 있으며, 캘리포니아 주의 선진적 클린 차량 규칙 등 주 수준의 규제를 활용하고 있습니다. 중동 및 아프리카에서는 이집트가 사륜 택시를 공식적으로 인가한 것이 성장의 원동력이 되고 있어 인도공급업체에게 수출 경로의 길이 열리고 있습니다. 남미에서는 거시경제 문제나 인프라의 미비 등 과제에 직면하고 있습니다. 그러나 브라질 상파울루시가 제로 방출 영역을 도입하고 아르헨티나가 마이크로 EV의 시험 운용을 개시하고 있기 때문에 신용 상황이 안정되는 대로 성장 가능성이 예상됩니다. 지역별로 다른 규제 타임라인은 향후 10년 동안 주도권이 역동적으로 전환될 것임을 시사하며, 이는 유연한 공급망을 확보할 것입니다.
기타 혜택 :
- 엑셀 형식 시장 예측(ME) 시트
- 애널리스트 서포트(3개월간)
자주 묻는 질문
목차
제1장 서론
- 조사 전제조건과 시장 정의
- 조사 범위
제2장 조사 방법
제3장 주요 요약
제4장 시장 상황
- 시장 개요
- 시장 성장 촉진요인
- 전동 삼륜차(E-3W)/마이크로 EV용 정부 보조금·우대 조치
- 전자상거래에서 라스트마일 배송 수요 증가
- 배출 가스 규제가 내연 기관차로부터 전기자동차로의 이행을 가속
- 사륜 스쿠터를 유리하게 하는 도시의 정체와 주차 제한
- 상용 삼륜차용 배터리 교환 비즈니스 모델
- 이집트에서 툭툭에서 사륜차로 대체 프로그램
- 시장 성장 억제요인
- 급속 충전/배터리 교환 인프라의 부족
- 리튬 이온 전지의 고액의 초기 비용
- 개량형 전동 이륜차로의 소비자 전환
- EU에 있어서 L6E/L7E용 충돌 안전 기준의 제정 대기 상황
- 가치/공급망 분석
- 규제 상황
- 기술 전망
- Porter's Five Forces
- 신규 참가업체의 위협
- 공급기업의 협상력
- 구매자의 협상력
- 대체품의 위협
- 업계 간 경쟁
제5장 시장 규모와 성장 예측(금액(달러) 및 수량(대))
- 차량 유형별
- 사륜차
- 삼륜차
- 용도별
- 개인용
- 상업용
- 파워트레인 유형별
- 내연기관
- 전기자동차
- 설계 및 구성별
- 승용
- 화물
- 지역
- 북미
- 미국
- 캐나다
- 기타 북미
- 남미
- 브라질
- 아르헨티나
- 기타 남미
- 유럽
- 독일
- 영국
- 프랑스
- 이탈리아
- 스페인
- 기타 유럽
- 아시아태평양
- 중국
- 인도
- 일본
- 한국
- 기타 아시아태평양
- 중동 및 아프리카
- 아랍에미리트(UAE)
- 사우디아라비아
- 남아프리카
- 튀르키예
- 기타 중동 및 아프리카
- 북미
제6장 경쟁 구도
- 시장 집중도
- 전략적 동향
- 시장 점유율 분석
- 기업 프로파일
- Bajaj Auto Ltd.
- Piaggio & C. SpA
- Mahindra & Mahindra Ltd.(Last Mile Mobility)
- YC Electric Vehicle Private Limited
- Groupe Renault
- TVS Motor Company Ltd.
- Atul Auto Ltd.
- Kinetic Green Energy & Power Solutions Ltd.
- Terra Motors Corp.
- Ligier Group
- AIXAM MEGA SAS
- Speego Vehicles Co. Pvt. Ltd.
- Saera Electric Auto Pvt. Ltd.
- E-Tuk Factory BV
- Polaris Inc.(Ranger LSV)
- Toyota Motor Corp.(C Pod)
- BYD Co. Ltd.(mini-EV platforms)
제7장 시장 기회와 향후 전망
KTH 26.01.26The Quadricycle and Tricycle Market was valued at USD 8.91 billion in 2025 and estimated to grow from USD 9.85 billion in 2026 to reach USD 16.29 billion by 2031, at a CAGR of 10.58% during the forecast period (2026-2031).
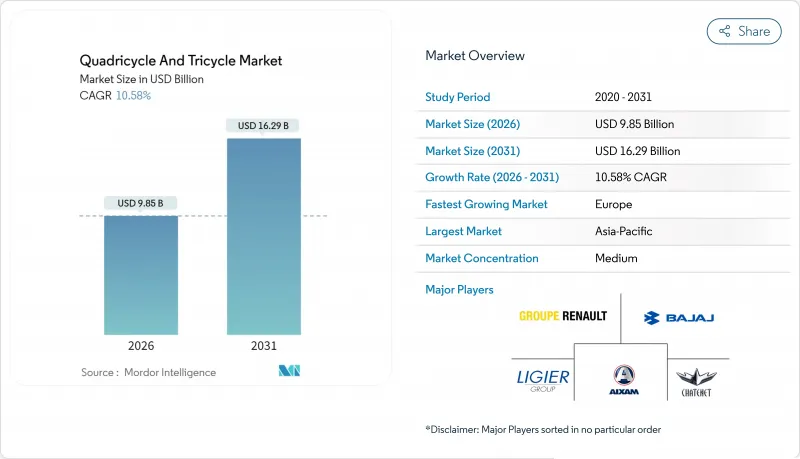
This growth is driven by increasing urban delivery density, national incentive programs that reduce the cost of electric-vehicle ownership, and regulatory frameworks that incentivize compact, low-emission transportation. Internal-combustion products currently dominate shipments, yet electric models are securing factory line time because battery costs continue to fall and swap networks reduce downtime. Tight emission limits in Europe and planned India BS7 rules reshape cost calculations, while Egypt's tuk-tuk replacement scheme illustrates how formal recognition of four-wheel micro-EVs unlocks fresh demand. Major automakers now treat micro-mobility as an entry-level profit pool, prompting portfolio extensions that mirror regional policy cues. Together, these forces propel the quadricycle and tricycle market onto a steep adoption curve across both freight and passenger niches.
Global Quadricycle And Tricycle Market Trends and Insights
Government Subsidies & Incentives For E-3W / Micro-EVs
Incentive packages are increasingly bridging the price gap between electric and gasoline vehicles. India's Production Linked Incentive scheme is allocating significant funding to boost local component production and reduce unit costs. Under Thailand's EV 3.5 policy, firms assembling electric tricycles are eligible for substantial corporate tax relief. Meanwhile, Malta is incentivizing quadricycle purchases with notable financial grants. In a move underscoring its commitment, China has extended purchase-tax exemptions for smaller vehicles for several more years. These initiatives, coinciding with falling battery costs, aim to boost electric car sales. With these predictable incentives, manufacturers are ramping up capacity planning, seeing it as a way to mitigate risks in capital spending and enhance plant utilization.
Rising E-Commerce Last-Mile Delivery Demand
Urban fulfillment costs account for almost three-fifths of shipping expenses, so fleet managers seek vehicles that reduce parking time and congestion fees. Amazon pilots electric cargo tricycles in several European capitals, while Flipkart equips Indian city hubs with swap-enabled three-wheelers. Battery-as-a-service models from Gogoro and Sun Mobility maintain high asset uptime, enabling operators to run longer shifts without range anxiety. Combined with stricter low-emission zones, these economics tilt route planning toward compact, electric vehicles. Volume growth in parcel shipments, therefore, transmits directly to chassis orders, sustaining a virtuous cycle for component makers.
Sparse Fast-Charging / Swap Infrastructure
Station density remains below the International Energy Agency guideline of one charger per ten vehicles across most emerging markets. Private investors hesitate where utilization rates are uncertain, and public planners face budget constraints, especially in rural areas. In regions with unreliable electricity grids, operators struggle to guarantee uptime for commercial fleets. Some governments subsidize chargers, but the rollout speed still lags behind demand, slowing electric vehicle sales. Without predictable access to energy, fleet managers may continue to purchase internal-combustion models, thereby delaying the tipping point for full electrification.
Other drivers and restraints analyzed in the detailed report include:
- Emission Regulations Accelerating ICE-To-EV Shift
- Urban Congestion & Parking Limits Favouring Quadricycles
- High Li-Ion Battery Upfront Cost
For complete list of drivers and restraints, kindly check the Table Of Contents.
Segment Analysis
Tricycles accounted for a commanding 87.05% of the quadricycle and tricycle market share in 2025, sustained by entrenched manufacturing clusters in India, Thailand, and Indonesia. The quadricycle and tricycle market size for tricycles is projected to expand steadily, yet at a slower pace than four-wheel formats. Quadricycles, though smaller in absolute volume, are projected to register a 10.62% CAGR through 2031 as European and North African policies reward enclosed cabins for safety and weather protection. Bajaj Auto scales Qute production for Egypt's replacement program, while Piaggio refines its Porter-based micro-EV platform for dense European cores. Regional adoption patterns, therefore, reflect a complex mix of cost priorities, climate conditions, and rulebooks that classify vehicle classes differently.
Tricycle platforms continue to evolve, integrating battery-swap compatibility and telematics to maintain their relevance. Quadricycle engineering now incorporates roof-mounted solar assistance and lightweight composites to offset the mass of the battery. OEMs thus tailor R&D pipelines to distinct user requirements rather than forcing a single platform across geographies. Competitive positioning relies on modular architectures that share components while allowing for local variations in compliance, thereby enabling flexibility and adaptability. The integration of advanced driver alerts and basic connectivity features also helps four-wheel models gain regulatory approval in cities targeting Zero-Accident safety outcomes. As funding pools align with zero-emission targets, the quadricycle and tricycle markets diversify, with both formats coexisting rather than fully converging.
Commercial operations controlled 73.10% of the quadricycle and tricycle market size in 2025, a share expected to increase as parcel networks expand their coverage. Commercial operations are forecast to post a 10.7% CAGR through 2031, driven by predictable route density and fee exemptions in low-emission zones. Passenger formats still dominate ride-hailing and informal taxi services across South Asia; however, the introduction of new metro lines and bus rapid transit corridors is tempering incremental growth. Large e-commerce platforms offer volume guarantees that support dedicated assembly lines, allowing suppliers to secure multi-year contracts.
Fleet owners address driver retention by installing enclosed cabins and climate control systems, which enhance comfort while keeping the cost per kilometer low. Urban planners designate micro-logistics hubs near residential areas, shortening trip lengths and underscoring the suitability of compact cargo beds. Software providers are now integrating route planning specifically for three-wheel vehicles, which reduces fuel or battery consumption during peak congestion. Passenger units pivot toward tourism shuttles and campus transport where regulation permits. Over the forecast window, the quadricycle and tricycle market therefore shifts from general people movement toward specialized freight ecosystems whose earnings justify faster asset turnover.
The Quadricycle and Tricycle Market Report is Segmented by Vehicle Type (Quadricycle and Tricycle), Application Type (Personal and Commercial), Powertrain Type (Internal Combustion Engine and Electric), Design & Configuration (Passenger and Cargo), and Geography. The Market Forecasts are Provided in Terms of Value (USD) and Volume (Units).
Geography Analysis
Asia-Pacific commanded 41.05% of the quadricycle and tricycle market share in 2025, anchored by India's expansive three-wheeler manufacturing base and China's scale advantages in lithium-iron-phosphate chemistry. India's significant PLI initiative is reshaping supply chains, attracting both cell manufacturers and component vendors. Meanwhile, China has extended purchase-tax waivers for vehicles with lower power output, ensuring cost parity for micro-EVs. Thailand's EV program is positioning the nation as a regional export hub, seamlessly connecting its supply bases with those of Indonesia and the Philippines. This strategic alignment benefits the quadricycle and tricycle market, as cross-border economies reduce lead times and streamline inventory cycles.
Europe, while smaller in current shipments, is projected to log a 10.65% CAGR through 2031 as city halls codify congestion fees and parking reductions. This growth is driven by city halls implementing congestion fees and parking reductions. London's Ultra Low Emission Zone offers exemptions for compliant quadricycles, while Paris is reducing curbside stalls, encouraging residents to opt for compact vehicles. Malta's incentive for quadricycles, combined with the standardized rules of Regulation 168/2013, streamlines the homologation process. Capitalizing on this clarity, manufacturers are orchestrating pan-EU launches, distributing R&D costs across multiple markets, and bolstering the region's stake in the quadricycle and tricycle market.
North America is treading cautiously yet picking up pace, harnessing state-level mandates, such as California's Advanced Clean Fleets Rule. In the Middle East and Africa, growth is driven by Egypt's official recognition of quadricycle taxis, which paves the way for export routes for Indian suppliers. South America faces challenges from macroeconomic issues and inconsistent infrastructure. Yet, with Brazil's Sao Paulo introducing a zero-emission zone and Argentina piloting micro-EVs, there's potential for growth once credit conditions stabilize. The varying regulatory timelines across regions suggest a dynamic shift in leadership roles over the decade, ensuring nimble supply chains.
- Bajaj Auto Ltd.
- Piaggio & C. SpA
- Mahindra & Mahindra Ltd. (Last Mile Mobility)
- YC Electric Vehicle Private Limited
- Groupe Renault
- TVS Motor Company Ltd.
- Atul Auto Ltd.
- Kinetic Green Energy & Power Solutions Ltd.
- Terra Motors Corp.
- Ligier Group
- AIXAM MEGA SAS
- Speego Vehicles Co. Pvt. Ltd.
- Saera Electric Auto Pvt. Ltd.
- E-Tuk Factory BV
- Polaris Inc. (Ranger LSV)
- Toyota Motor Corp. (C+Pod)
- BYD Co. Ltd. (mini-EV platforms)
Additional Benefits:
- The market estimate (ME) sheet in Excel format
- 3 months of analyst support
TABLE OF CONTENTS
1 Introduction
- 1.1 Study Assumptions & Market Definition
- 1.2 Scope of the Study
2 Research Methodology
3 Executive Summary
4 Market Landscape
- 4.1 Market Overview
- 4.2 Market Drivers
- 4.2.1 Government Subsidies & Incentives For E-3W / Micro-Evs
- 4.2.2 Rising E-Commerce Last-Mile Delivery Demand
- 4.2.3 Emission Regulations Accelerating ICE-To-EV Shift
- 4.2.4 Urban Congestion & Parking Limits Favouring Quadricycles
- 4.2.5 Battery-Swap Business Models For Commercial Tricycles
- 4.2.6 Egypt Tuk-Tuk-To-Quadricycle Replacement Programme
- 4.3 Market Restraints
- 4.3.1 Sparse Fast-Charging / Swap Infrastructure
- 4.3.2 High Li-Ion Battery Upfront Cost
- 4.3.3 Consumer Shift To Improved Electric Two-Wheelers
- 4.3.4 Pending EU Crash-Safety Rules For L6E/L7E
- 4.4 Value / Supply-Chain Analysis
- 4.5 Regulatory Landscape
- 4.6 Technological Outlook
- 4.7 Porter's Five Forces
- 4.7.1 Threat of New Entrants
- 4.7.2 Bargaining Power of Suppliers
- 4.7.3 Bargaining Power of Buyers
- 4.7.4 Threat of Substitutes
- 4.7.5 Industry Rivalry
5 Market Size & Growth Forecasts (Value (USD) and Volume (Units))
- 5.1 By Vehicle Type
- 5.1.1 Quadricycle
- 5.1.2 Tricycle (Three-Wheeler)
- 5.2 By Application Type
- 5.2.1 Personal
- 5.2.2 Commercial
- 5.3 By Powertrain Type
- 5.3.1 Internal Combustion Engine
- 5.3.2 Electric
- 5.4 By Design & Configuration
- 5.4.1 Passenger
- 5.4.2 Cargo
- 5.5 Geography
- 5.5.1 North America
- 5.5.1.1 United States
- 5.5.1.2 Canada
- 5.5.1.3 Rest of North America
- 5.5.2 South America
- 5.5.2.1 Brazil
- 5.5.2.2 Argentina
- 5.5.2.3 Rest of South America
- 5.5.3 Europe
- 5.5.3.1 Germany
- 5.5.3.2 United Kingdom
- 5.5.3.3 France
- 5.5.3.4 Italy
- 5.5.3.5 Spain
- 5.5.3.6 Rest of Europe
- 5.5.4 Asia Pacific
- 5.5.4.1 China
- 5.5.4.2 India
- 5.5.4.3 Japan
- 5.5.4.4 South Korea
- 5.5.4.5 Rest of Asia Pacific
- 5.5.5 Middle East and Africa
- 5.5.5.1 United Arab Emirates
- 5.5.5.2 Saudi Arabia
- 5.5.5.3 South Africa
- 5.5.5.4 Turkey
- 5.5.5.5 Rest of Middle East and Africa
- 5.5.1 North America
6 Competitive Landscape
- 6.1 Market Concentration
- 6.2 Strategic Moves
- 6.3 Market Share Analysis
- 6.4 Company Profiles (Includes Global Level Overview, Market Level Overview, Core Segments, Financials as Available, Strategic Information, Market Rank/Share for Key Companies, Products and Services, SWOT Analysis, and Recent Developments)
- 6.4.1 Bajaj Auto Ltd.
- 6.4.2 Piaggio & C. SpA
- 6.4.3 Mahindra & Mahindra Ltd. (Last Mile Mobility)
- 6.4.4 YC Electric Vehicle Private Limited
- 6.4.5 Groupe Renault
- 6.4.6 TVS Motor Company Ltd.
- 6.4.7 Atul Auto Ltd.
- 6.4.8 Kinetic Green Energy & Power Solutions Ltd.
- 6.4.9 Terra Motors Corp.
- 6.4.10 Ligier Group
- 6.4.11 AIXAM MEGA SAS
- 6.4.12 Speego Vehicles Co. Pvt. Ltd.
- 6.4.13 Saera Electric Auto Pvt. Ltd.
- 6.4.14 E-Tuk Factory BV
- 6.4.15 Polaris Inc. (Ranger LSV)
- 6.4.16 Toyota Motor Corp. (C+Pod)
- 6.4.17 BYD Co. Ltd. (mini-EV platforms)
7 Market Opportunities & Future Outlook
- 7.1 White-space & Unmet-Need Assessment

