
|
시장보고서
상품코드
1910924
라이선스 관리 : 시장 점유율 분석, 업계 동향 및 통계, 성장 예측(2026-2031년)License Management - Market Share Analysis, Industry Trends & Statistics, Growth Forecasts (2026 - 2031) |
||||||
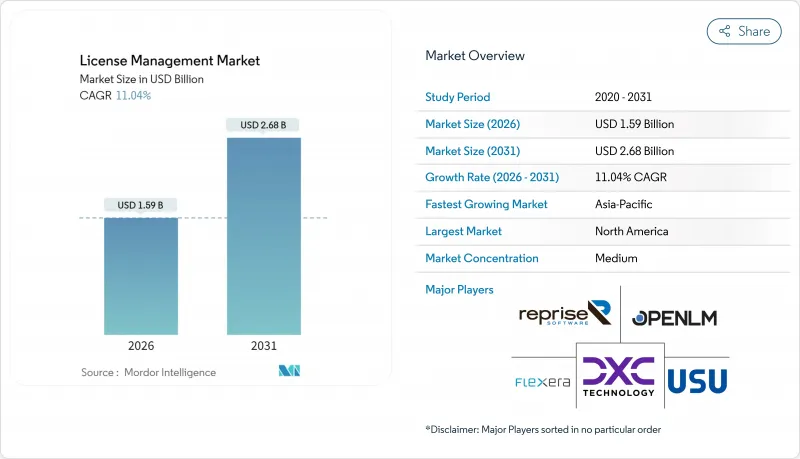
라이선스 관리 시장은 2025년 14억 3,000만 달러에서 2026년에는 15억 9,000만 달러로 성장하고 2026년에서 2031년에 걸쳐 CAGR 11.04%를 나타낼 전망입니다. 2031년까지 26억 8,000만 달러에 달할 것으로 예측됩니다.

디지털화 가속화, SaaS 인플레이션 확대, EU 디지털 비즈니스 탄력성 법 등 새로운 규제 요건으로 인해 하이브리드 IT 환경 전반에서 자동화된 거버넌스에 대한 수요가 증가하고 있습니다. 규제 당국의 모니터링 강화, 감사 빈도 증가 및 실시간 비용 관리의 필요성으로 인해 소프트웨어 자산 거버넌스는 지원 기능에서 이사회 수준 우선순위로 전환하고 있습니다. 벤더 각사는 플랫폼 통합, AI를 활용한 검출 기능, 구독형 비즈니스 모델을 통해 대응을 진행하고 있어, 기업은 컴플라이언스 리스크를 억제하면서 최적화의 이점을 누릴 수 있습니다. 동시에 FinOps 도입의 확대와 미사용 라이선스의 비용 증가(대기업 1사당 연간 1억 2,730만 달러로 추정)는 적극적인 라이선스 인텔리전스에 의한 구체적인 비용 절감 효과를 부각하고 있습니다. 이러한 요인들이 결합되어 라이선스 관리 시장은 2030년까지 지속적인 성장 궤도가 확고해질 것입니다.
세계의 라이선스 관리 시장 동향과 인사이트
SaaS 및 구독형 라이선싱으로의 가속 전환
SaaS 지출은 2023년부터 2025년까지 31% 증가해 3,000억 달러에 이르렀으며, 현재 평균 기업의 비용 기반의 25%를 차지하고 있습니다. 구독 갱신, 사용량 기반 가격 및 다층 사용 권한으로 조달 팀은 라이선스 상태를 최신 상태로 유지하기 위한 자동화를 추진하고 있습니다. 고객의 27%에 영향을 미치는 슈링크플레(가격 상승을 숨기는 전략)는 계약 내용을 미세 조정하여 가격 인상을 은폐하므로 비용 예측 가능성에 있어서는 상세한 사용 상황의 인사이트가 필수적입니다. 그 결과, 청구 데이터를 기능 수준까지 분석할 수 있는 클라우드 네이티브 플랫폼이 라이선스 관리 시장 전체에서 보급되고 있습니다.
벤더 감사의 빈도와 비용 증가
출판사의 수익 회복 방법의 일환으로 감사 빈도가 증가하고 있으며 미국 정부 감사원이 지적한 공공 부문의 부족분이 이를 뒷받침하고 있습니다. 하이브리드 클라우드의 확장은 복잡성을 높이고 있으며 기존의 발견 도구는 가상화 환경, 컨테이너화 환경 및 SaaS 자산을 쉽게 정렬할 수 없습니다. 이를 통해 기업은 단일 관리 인프라에서 발견 기능, 권한 데이터 및 계약 로직을 통합하는 솔루션에 더 큰 컴플라이언스 예산을 할당합니다. 이 모니터링 강화는 라이선스 관리 시장에서 지속적인 두 자리 성장을 지원합니다.
불투명한 공급업체별 라이선스 조항 및 메트릭
빈번한 지표 재설계(사용자 수 기반, 코어 수 기반, 사용량 기반 등)는 비용 가시성을 저하시킵니다. Broadcom의 VMware 판매 일주일 중단은 공급업체의 시스템 변경이 고객의 거버넌스 워크플로를 방해하는 사례를 보여주었습니다. 조직은 계약 문장의 해독에 불균형한 법적·기술적 노력을 쓰고 최적화 사이클을 지연시킵니다. 이로 인해 전문적인 조언을 받을 수 없는 중소기업의 라이선싱 시장 진입에 억제적인 압력이 발생하고 있습니다.
부문 분석
소프트웨어 플랫폼은 핵심 발견·표준화·조합 엔진이 거버넌스 운용에 있어서 여전히 기반적 역할을 담당하고 있기 때문에 2025년에도 라이선스 관리 시장 점유율의 61.74%를 유지했습니다. 이러한 이점은 2025년 라이선스 관리 시장 규모 중 8억 8,000만 달러를 차지하는 기반이 되어 기업이 구성 가능한 정책 중심 자동화를 대규모로 요구하고 있음을 반영했습니다. 그러나 서비스 부문은 14.56%의 연평균 복합 성장률(CAGR)로 확대될 것으로 예상되며, 기업이 희귀한 전문 지식을 가진 파트너에게 최적화 업무를 위탁하는 움직임이 라이선스 관리 시장 규모를 급속히 확대하고 있습니다.
관리형 서비스 제공업체는 AI를 통합하고 업데이트 피크를 예측하며 공급업체 감사 전에 컴플라이언스 위반을 감지합니다. 이 지속적인 모니터링 모델은 특히 아시아태평양 및 라틴아메리카에서 인증 소프트웨어 자산 관리 인력의 만성적 부족에 직면하는 조직의 요구에 부합합니다. 그 결과 서비스 수익은 2031년까지 소프트웨어 수익과의 차이를 줄이고 기존 라이선스에 중점을 둔 공급업체의 경쟁 전략을 변화시킬 것으로 예측됩니다.
2025년 클라우드 구축은 라이선스 관리 시장 점유율의 57.36%를 차지했습니다. 이는 지속적인 On-Premise 도구에서 보다 광범위한 IT 전략을 반영하는 구독형 SaaS 플랫폼으로의 전환을 추진하는 기업에 의해 추진되고 있습니다. 클라우드 아키텍처는 즉각적인 업데이트, 탄력적인 스케일링, API 레벨 통합을 제공하여 멀티클라우드 환경에서 실시간 소비 분석을 가능하게 합니다. 이로 인해 14.02%의 연평균 복합 성장률(CAGR)이 유지되고 이 부문은 라이선스 관리 시장에서 핵심적인 위치를 유지할 전망입니다.
On-Premise 솔루션은 로컬 데이터 보존이 요구되는 고도로 규제된 업계와 레거시 인프라 의존성을 유지하는 분야에서 계속 채택되고 있습니다. 그러나 클라우드 분석과 On-Premise 감지를 결합하고 민첩성을 희생하지 않고 주권 요구 사항을 충족하는 하이브리드 모델이 주목을 받고 있습니다. 클라우드 퍼스트 거버넌스를 채택한 기업은 관리 오버헤드를 40% 줄이는 것으로 보고되었으며, 지속적인 전환의 경제적 근거를 강화하고 라이선스 관리 시장 전체의 규모 확대에 기여하고 있습니다.
지역별 분석
북미의 라이선스 관리 시장 규모는 2025년 5억 4,000만 달러에 이르렀으며, 성숙한 기업 IT 지출과 활발한 감사 문화에 힘입어 37.68%라는 압도적인 점유율을 차지했습니다. SEC의 사이버 리스크 공개 규칙에 따른 엄격한 기한 설정은 소프트웨어의 완전한 시각화 달성에 긴급성을 추가합니다. 캐나다의 공공 부문 근대화 프로그램은 지역 수요를 더욱 밀어 올리고 있지만 대기업 침투가 포화 상태에 도달했기 때문에 성장률은 한 자리에 둔화되고 있습니다.
아시아태평양은 2025년 기준치는 소규모였지만, 2031년까지 시장을 선도하는 13.29%의 연평균 복합 성장률(CAGR)을 달성할 것으로 예측되고 있습니다. 생성형 AI에 대한 투자는 34억 달러로 3배로 증가하고 중국에서는 전년 대비 160%의 지출 증가가 전망됩니다. 이러한 급속한 도입은 언어 모델, 데이터 파이프라인 및 분석 테넌트 전반에 걸쳐 라이선스의 복잡성을 높입니다. 현지 공급업체는 라이선싱 전문가와 제휴하여 권리 추적 및 비용 거버넌스의 격차를 해소함으로써 지역적인 기세를 가속화하고 있습니다.
유럽은 DORA(디지털 오퍼레이션 탄력성법)의 준수 기한을 배경으로 라이선스 관리 시장에서 큰 점유율을 차지하고 있습니다. 금융기관은 엄격한 탄력성 지표를 충족하기 위해 자산 로그 및 감사 워크플로우를 재구성하고 있습니다. 한편, 라틴아메리카, 중동, 아프리카에서는 클라우드 보급이 진행되고 있는 가운데, 스프레드시트 관리에서 상용 플랫폼으로의 이행이 진행되고 있습니다. 이러한 지역은 아직 개발 도상이지만, 금세기 말까지 세계의 라이선스 관리 시장 규모에 점진적인 성장을 가져올 것으로 예측됩니다.
기타 혜택 :
- 엑셀 형식 시장 예측(ME) 시트
- 애널리스트 지원(3개월간)
자주 묻는 질문
목차
제1장 서론
- 조사 전제조건 및 시장 정의
- 조사 범위
제2장 조사 방법
제3장 주요 요약
제4장 시장 상황
- 시장 개요
- 시장 성장 촉진요인
- SaaS 및 구독형 라이선싱으로의 이행 가속
- 벤더 감사의 빈도와 비용 증가
- FinOps 정책에 따른 IT 자산 최적화의 의무화
- AI를 활용한 「섀도우 IT」라이선스의 발견
- EU 디지털 운용 레지리언스법(DORA)의 준수 기한
- IIoT 플랫폼에서 임베디드 디바이스 라이선싱 수익화
- 시장 성장 억제요인
- 불투명한 벤더 고유의 라이선스 조항과 측정 기준
- 단편화된 포인트 툴 생태계는 통합 비용을 증가
- 인정된 SAM 인재공급 부족
- 오픈소스 채용 증가로 상용 라이선스 수요 감소
- 업계 밸류체인 분석
- 규제 상황
- 기술 전망
- Porter's Five Forces 분석
- 공급기업의 협상력
- 구매자의 협상력
- 신규 참가업체의 위협
- 대체품의 위협
- 경쟁 기업 간 경쟁 관계
제5장 시장 규모와 성장 예측
- 구성 요소별
- 소프트웨어
- 서비스
- 배포별
- On-Premise
- 클라우드
- 용도별
- 감사 서비스
- 자문 서비스
- 컴플라이언스 관리
- 라이선스 권한 및 최적화
- 운영 및 분석
- 기타 용도
- 최종 사용자 산업별
- 은행, 금융 서비스 및 보험(BFSI)
- 헬스케어 및 생명과학
- IT 및 통신
- 미디어 및 엔터테인먼트
- 기타 최종 사용자 산업
- 지역별
- 북미
- 미국
- 캐나다
- 멕시코
- 유럽
- 영국
- 독일
- 프랑스
- 이탈리아
- 기타 유럽
- 아시아태평양
- 중국
- 일본
- 인도
- 한국
- 기타 아시아
- 중동
- 이스라엘
- 사우디아라비아
- 아랍에미리트(UAE)
- 튀르키예
- 기타 중동
- 아프리카
- 남아프리카
- 이집트
- 기타 아프리카
- 남미
- 브라질
- 아르헨티나
- 기타 남미
- 북미
제6장 경쟁 구도
- 시장 집중도
- 전략적 동향
- 시장 점유율 분석
- 기업 프로파일
- Flexera Software LLC
- USU Software AG
- Snow Software AB
- IBM Corporation
- ServiceNow Inc.
- Oracle Corporation
- Broadcom Inc.(CA Technologies)
- Micro Focus International plc
- DXC Technology Company
- OpenLM Ltd
- SAP SE
- Thales Group(Gemalto)
- Quest Software Inc.
- Reprise Software Inc.
- Ivanti, Inc.
- License Dashboard Ltd
- Certero Ltd
- Zylo Inc.
- LeanIX GmbH
- OpenText Corporation
제7장 시장 기회와 향후 전망
KTH 26.01.22The license management market is expected to grow from USD 1.43 billion in 2025 to USD 1.59 billion in 2026 and is forecast to reach USD 2.68 billion by 2031 at 11.04% CAGR over 2026-2031.
Accelerating digitization, swelling SaaS inflation, and new regulatory mandates such as the EU Digital Operational Resilience Act are amplifying demand for automated governance across hybrid IT estates. Regulatory scrutiny, higher audit frequency, and the need for real-time cost control have shifted software asset governance from a support function to a board-level priority. Vendors are responding through platform consolidation, AI-powered discovery, and subscription-based commercial models that help enterprises curb compliance risk while unlocking optimization gains. At the same time, expanding FinOps adoption and the rising cost of unused licenses, estimated at USD 127.3 million per large enterprise annually, underscore the tangible savings available through proactive license intelligence. Together, these forces solidify a sustained growth runway for the license management market through 2030.
Global License Management Market Trends and Insights
Accelerated Shift to SaaS and Subscription-Based Licensing
SaaS spending climbed 31% between 2023 and 2025 to USD 300 billion and now absorbs 25% of the average company's cost base. Subscription renewals, usage-based pricing, and multi-tier entitlements have pushed procurement teams toward automation so that license positions remain current. Shrinkflation tactics affecting 27% of customers conceal price hikes behind contractual tweaks, making granular usage insights indispensable for cost predictability. As a result, cloud-native platforms capable of parsing billing data down to the feature level are gaining ground across the license management market.
Heightened Frequency and Cost of Vendor Audits
Audit frequency is rising as publishers pursue revenue recovery, a trend reinforced by public sector shortfalls identified by the U.S. Government Accountability Office. The hybrid-cloud sprawl adds complexity because legacy discovery tools cannot easily reconcile virtual, containerized, and SaaS assets. Enterprises, therefore, allocate larger compliance budgets to solutions that merge discovery, entitlement data, and contractual logic within a single control plane. The heightened scrutiny supports sustained double-digit growth across the license management market.
Opaque, Vendor-Specific Licence Terms and Metrics
Frequent metric redesigns, seat-based, core-based, or consumption-based, blur cost visibility. Broadcom's week-long VMware sales suspension illustrated how supplier system changes can derail customer governance workflows. Organizations expend disproportionate legal and technical effort decoding contract language, which slows optimization cycles and puts downward pressure on license management market adoption among smaller firms lacking specialist counsel.
Other drivers and restraints analyzed in the detailed report include:
- Mandatory IT-Asset Optimisation Under FinOps Mandates
- AI-Driven Discovery of Shadow IT Licences
- Fragmented Point-Tool Ecosystem Increases Integration Costs
For complete list of drivers and restraints, kindly check the Table Of Contents.
Segment Analysis
Software platforms retained a 61.74% license management market share in 2025 as core discovery, normalization, and reconciliation engines remain fundamental to governance operations. This dominance underpins a USD 0.88 billion slice of the 2025 license management market size and reflects enterprises' need for configurable, policy-driven automation at scale. Yet the services segment, projected to register a 14.56% CAGR, is rapidly expanding the license management market size as firms outsource optimization to partners holding scarce domain specialists.
Managed service providers embed AI to anticipate renewal spikes and detect non-compliance before vendor inspections occur. This continuous oversight model resonates with organizations facing a chronic shortage of certified Software Asset Management talent, especially across APAC and Latin America. As a result, service revenue is expected to narrow the gap with software by 2031, transforming the competitive calculus for vendors historically focused on licenses rather than consulting.
Cloud deployments represented 57.36% of the license management market share in 2025, propelled by enterprises migrating away from perpetual on-premises tools to subscription SaaS platforms that mirror their broader IT strategies. Cloud architectures deliver instant updates, elastic scaling, and API-grade integration, enabling real-time consumption analytics across multi-cloud estates and supporting a 14.02% CAGR that will keep this segment pivotal in the license management market.
On-premises solutions persist in highly regulated verticals that demand local data residency or maintain legacy infrastructure dependencies. However, hybrid models are gaining traction, combining cloud analytics with on-premises discovery to satisfy sovereignty mandates without sacrificing agility. Enterprises adopting cloud-first governance report 40% lower administrative overhead, reinforcing the economic case for continued migration and expanding the overall license management market size.
The License Management Market Report is Segmented by Component (Software, Services), Deployment (On-Premise, Cloud), Application (Audit Services, Advisory Services, Compliance Management, Licence Entitlement and Optimisation, Operations and Analytics, Other Applications), End-User Industry (BFSI, Healthcare and Life Sciences, and More), and Geography. The Market Forecasts are Provided in Terms of Value (USD).
Geography Analysis
The license management market size in North America totalled USD 0.54 billion in 2025, translating into a dominant 37.68% share backed by mature enterprise IT spending and an active audit culture. Tight timelines imposed by the SEC's cyber-risk disclosure rules add urgency to achieving full software visibility. Canada's public sector modernization programs further swell regional demand, though growth is tapering to single-digit rates as penetration saturates large enterprises.
Asia-Pacific generated a smaller base value in 2025, yet is projected to deliver a market-leading 13.29% CAGR through 2031. Investments in generative AI are tripling to USD 3.4 billion, with China lifting spending by 160% year-over-year. Such rapid adoption inflates license complexity across language models, data pipelines, and analytics tenants. Local vendors are partnering with global license management specialists to address gaps in entitlement tracking and cost governance, thereby accelerating regional momentum.
Europe commands a sizeable slice of the license management market, propelled by the DORA compliance deadline. Financial institutions are rearchitecting asset logs and audit workflows to meet stringent resilience metrics. Meanwhile, Latin America, the Middle East, and Africa are shifting from spreadsheet tracking toward commercial platforms as cloud penetration deepens. Although still nascent, these regions are expected to contribute incremental gains to the global license management market size by the close of the decade.
- Flexera Software LLC
- USU Software AG
- Snow Software AB
- IBM Corporation
- ServiceNow Inc.
- Oracle Corporation
- Broadcom Inc. (CA Technologies)
- Micro Focus International plc
- DXC Technology Company
- OpenLM Ltd
- SAP SE
- Thales Group (Gemalto)
- Quest Software Inc.
- Reprise Software Inc.
- Ivanti, Inc.
- License Dashboard Ltd
- Certero Ltd
- Zylo Inc.
- LeanIX GmbH
- OpenText Corporation
Additional Benefits:
- The market estimate (ME) sheet in Excel format
- 3 months of analyst support
TABLE OF CONTENTS
1 INTRODUCTION
- 1.1 Study Assumptions and Market Definition
- 1.2 Scope of the Study
2 RESEARCH METHODOLOGY
3 EXECUTIVE SUMMARY
4 MARKET LANDSCAPE
- 4.1 Market Overview
- 4.2 Market Drivers
- 4.2.1 Accelerated shift to SaaS and subscription-based licensing
- 4.2.2 Heightened frequency and cost of vendor audits
- 4.2.3 Mandatory IT-asset optimisation under FinOps mandates
- 4.2.4 AI-driven discovery of "shadow IT" licences
- 4.2.5 EU's Digital Operational Resilience Act (DORA) compliance deadline
- 4.2.6 Embedded-device licence monetisation in IIoT platforms
- 4.3 Market Restraints
- 4.3.1 Opaque, vendor-specific licence terms and metrics
- 4.3.2 Fragmented point-tool ecosystem increases integration costs
- 4.3.3 Limited availability of certified SAM talent
- 4.3.4 Rising open-source adoption reduces commercial-licence volume
- 4.4 Industry Value-Chain Analysis
- 4.5 Regulatory Landscape
- 4.6 Technological Outlook
- 4.7 Porter's Five Forces Analysis
- 4.7.1 Bargaining Power of Suppliers
- 4.7.2 Bargaining Power of Buyers
- 4.7.3 Threat of New Entrants
- 4.7.4 Threat of Substitutes
- 4.7.5 Intensity of Competitive Rivalry
5 MARKET SIZE AND GROWTH FORECASTS (VALUE)
- 5.1 By Component
- 5.1.1 Software
- 5.1.2 Services
- 5.2 By Deployment
- 5.2.1 On-premise
- 5.2.2 Cloud
- 5.3 By Application
- 5.3.1 Audit Services
- 5.3.2 Advisory Services
- 5.3.3 Compliance Management
- 5.3.4 Licence Entitlement and Optimisation
- 5.3.5 Operations and Analytics
- 5.3.6 Other Applications
- 5.4 By End-User Industry
- 5.4.1 Banking, Financial Services and Insurance (BFSI)
- 5.4.2 Healthcare and Life Sciences
- 5.4.3 Information Technology and Telecommunications
- 5.4.4 Media and Entertainment
- 5.4.5 Other End-User Industries
- 5.5 By Geography
- 5.5.1 North America
- 5.5.1.1 United States
- 5.5.1.2 Canada
- 5.5.1.3 Mexico
- 5.5.2 Europe
- 5.5.2.1 United Kingdom
- 5.5.2.2 Germany
- 5.5.2.3 France
- 5.5.2.4 Italy
- 5.5.2.5 Rest of Europe
- 5.5.3 Asia-Pacific
- 5.5.3.1 China
- 5.5.3.2 Japan
- 5.5.3.3 India
- 5.5.3.4 South Korea
- 5.5.3.5 Rest of Asia
- 5.5.4 Middle East
- 5.5.4.1 Israel
- 5.5.4.2 Saudi Arabia
- 5.5.4.3 United Arab Emirates
- 5.5.4.4 Turkey
- 5.5.4.5 Rest of Middle East
- 5.5.5 Africa
- 5.5.5.1 South Africa
- 5.5.5.2 Egypt
- 5.5.5.3 Rest of Africa
- 5.5.6 South America
- 5.5.6.1 Brazil
- 5.5.6.2 Argentina
- 5.5.6.3 Rest of South America
- 5.5.1 North America
6 COMPETITIVE LANDSCAPE
- 6.1 Market Concentration
- 6.2 Strategic Moves
- 6.3 Market Share Analysis
- 6.4 Company Profiles (includes Global level Overview, Market level overview, Core Segments, Financials as available, Strategic Information, Market Rank/Share for key companies, Products and Services, and Recent Developments)
- 6.4.1 Flexera Software LLC
- 6.4.2 USU Software AG
- 6.4.3 Snow Software AB
- 6.4.4 IBM Corporation
- 6.4.5 ServiceNow Inc.
- 6.4.6 Oracle Corporation
- 6.4.7 Broadcom Inc. (CA Technologies)
- 6.4.8 Micro Focus International plc
- 6.4.9 DXC Technology Company
- 6.4.10 OpenLM Ltd
- 6.4.11 SAP SE
- 6.4.12 Thales Group (Gemalto)
- 6.4.13 Quest Software Inc.
- 6.4.14 Reprise Software Inc.
- 6.4.15 Ivanti, Inc.
- 6.4.16 License Dashboard Ltd
- 6.4.17 Certero Ltd
- 6.4.18 Zylo Inc.
- 6.4.19 LeanIX GmbH
- 6.4.20 OpenText Corporation
7 MARKET OPPORTUNITIES AND FUTURE OUTLOOK
- 7.1 White-space and Unmet-need Assessment

