
|
시장보고서
상품코드
1911490
MOSFET 파워 트랜지스터 시장 : 시장 점유율 분석, 산업 동향 및 통계, 성장 예측(2026-2031년)MOSFET Power Transistors - Market Share Analysis, Industry Trends & Statistics, Growth Forecasts (2026 - 2031) |
||||||
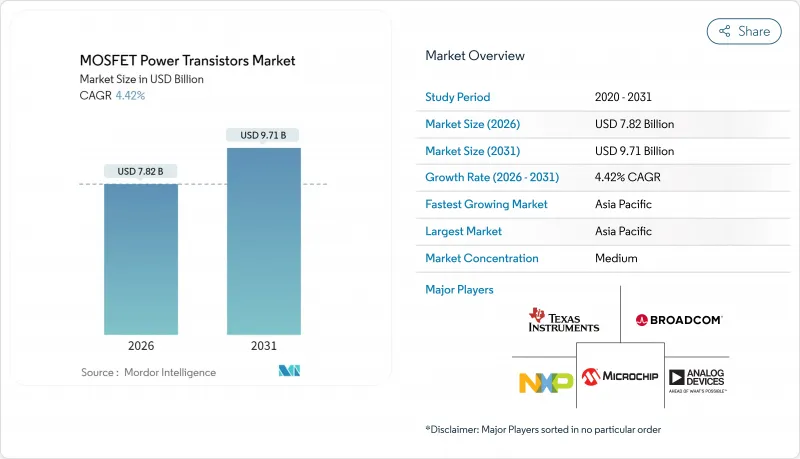
MOSFET 파워 트랜지스터 시장 규모는 2026년 78억 2,000만 달러로 추정되고, 2025년 74억 9,000만 달러에서 성장할 전망이며, 2031년에는 97억 1,000만 달러에 이를 것으로 예측됩니다.
2026-2031년 연평균 성장률(CAGR)은 4.42%로 성장할 전망입니다.

이 꾸준한 확대는 수송 분야에서의 전자 추진, 재생에너지 설비 확충, AI 중심의 데이터센터 갱신 등 수요 증가를 반영한 것입니다. 한편, 공급 병목 및 제조 제약이 단기적인 기세를 억제하는 요인이 되고 있습니다. 수요는 전기자동차, 태양광 및 풍력 인버터, AI 서버 등 고성장 최종 사용자 분야에 집중하고 있으며, 와이드 밴드 갭 재료, 고전압 아키텍처, 선진적인 패키징 기술이 현저한 효율 향상을 가져오고 있습니다. 경쟁의 심각성은 여전히 중간 정도입니다. 주요 공급업체는 수직 통합 제조, 자동차 등급 품질 시스템, 플랫폼 포트폴리오를 활용하여 점유율을 보호하고, 민첩한 신규 진출 기업은 틈새 생산 능력 및 광대역 갭 재료의 전문성을 활용합니다. 정부에 의한 '국내 제조' 장려책, 특히 미국의 CHIPS법이나 동등한 아시아 및 유럽의 프로그램은 조달 판단을 공급 탄력(회복력)으로 방향 전환시켜, 순수한 코스트 최적화로부터 조달 결정을 멀리 하는 방향으로 이끌고 있습니다.
세계의 MOSFET 파워 트랜지스터 시장 동향 및 인사이트
EV 생산 급증이 트랙션 MOSFET 채용 가속
전기자동차의 생산 확대에 따라 고전류 트랙션 인버터 수요가 증가하고 자동차용 반도체의 탑재량은 내연기관 모델에서 약 400달러에서 1대 당 600-800달러로 상승하고 있습니다. 탄화규소 MOSFET은 800V 구동 시스템을 실현하고 충전 시간을 400V 시스템의 45분에서 15분으로 80% 단축하기 때문에 3-4배의 재료 비용 증가를 정당화합니다. 인피니언이 2024년 12월에 발표한 OptiMOS 7 제품군은 스위칭 손실을 30% 줄이고 차세대 인버터의 열 설계 요구 사항을 충족합니다. AEC-Q101 표준에 따른 자동차 등급 인증은 설계 사이클을 연장하지만 검증된 신뢰성 기록을 가진 기존 공급업체의 지위를 확고히 합니다.
정부의 반도체 우대책이 제조 거점의 지역 구조 재구축
530억 달러 규모의 CHIPS and Science Act는 미국 국내 반도체 제조를 조성하고 조달 판단을 최저 비용에서 탄력 중심으로 전환시킵니다. 66억 달러의 보조금을 받은 TSMC의 애리조나 공장은 2028년 파워 반도체 생산을 시작했으며 인텔의 오하이오 공장은 자동차 등급 MOSFET 노드를 목표로 합니다. 한국, 일본, 유럽연합(EU)에서 병행 프로그램은 지역 클러스터를 육성해, 지역 자동차 제조업체나 재생에너지 통합 사업자를 위한 리드 타임 단축을 도모하지만, 실질적인 생산 능력은 2027년 이후에만 실현됩니다.
와이드 밴드갭 재료의 비용 프리미엄이 보급 억제
SiC(탄화규소) 및 GaN(질화갈륨) 다이의 가격은 실리콘의 3-10배에 달하고, 150mm SiC 웨이퍼는 1,500-2,000달러로 판매되는 반면 실리콘 슬라이스는 50달러입니다. 수율은 60-80% 전후로 추이해, 전용 고전압 패키지에 의해 디바이스당 2-5달러가 추가됩니다. 200mm의 채용에 의해 비용 곡선은 개선되지만, 재료 특성 및 자본 집약도에 의해 예측 기간을 통해 절대 가격은 종래의 실리콘을 크게 웃돌게 됩니다.
부문 분석
2025년 매출의 72.55%를 N채널 디바이스가 차지하고 있으며, 고주파 컨버터에서 결정적인 우위성인 낮은 온 저항과 높은 전자 이동도의 이점이 강조되고 있습니다. 이 점유율은 트랙션 인버터, 태양광 MPPT, 서버 VRM 시장에서 MOSFET 파워 트랜지스터의 지배적 지위에 해당합니다. 보완형 및 듀얼 디바이스는 규모가 작은 것, 동기 정류의 이점을 해방해, 컨버터 손실을 2-3퍼센트 포인트 삭감하기 위해, 예측 기간 중 톱 5.48%의 연평균 복합 성장률(CAGR)로 성장이 전망됩니다.
디자이너는 DC-DC 컨버터용 하프 브리지 구성으로 상보적인 MOSFET을 결합하여 데드 타임 동안 전도성을 최적화하고 슈트 스루 위험을 줄입니다. AI 서버 및 통신용 정류기에서의 채용이 확대되고 있어, 절약된 전력은 냉각 부하의 저감에 직결합니다. P채널 디바이스는 높은 쪽에서의 틈새 용도를 유지하는 반면, 높은 온 저항이 성장의 대부분을 듀얼 채널 실장에 양보해, 성능과 비용 효율의 밸런스를 실현하고 있습니다.
실리콘은 성숙한 200mm 팹, 풍부한 공급량, 다이당 0.05-0.15달러라는 경제성으로 인해 2025년 수익의 68.75%를 차지했습니다. 이로 인해 실리콘은 600V 미만의 소켓에 고정됩니다. 여기에서는 SiC에 대한 관심이 높아지는 가운데 MOSFET 파워 트랜지스터 시장에서의 실리콘 점유율은 견조하게 추이하고 있습니다. 탄화규소의 5.65% CAGR은 800V EV 구동 시스템, 1,500V 태양광 발전 스트링 및 200℃ 이상의 접합부 내열성을 요구하는 산업용 구동 장치를 반영합니다.
높은 열전도성과 3배의 내내압 특성으로 SiC MOSFET은 고전압 영역에서 낮은 스위칭 손실과 낮은 도통 손실을 실현합니다. GaN은 650V·1-2MHz 스위칭의 최적 영역을 차지해, 급속 충전 AC어댑터나 LIDAR 펄서단으로 수요가 높아지고 있습니다만, 2031년까지는 웨이퍼 미세화 및 기판 공급의 제약에 의해 대량 생산은 곤란합니다. 다른 화합물 반도체는 특수 용도에 머물며 수익에 대한 기여는 제한적입니다.
지역별 분석
아시아태평양은 2025년 수익의 45.20%를 차지했으며, 예측 CAGR은 7.25%로 선두를 유지했습니다. 중국, 대만, 한국은 성숙한 파운드리 노드 및 다운스트림 전자 장비 조립 클러스터를 결합하여 지역 수요 순환을 지속하고 있습니다. 일본은 정부 보조금을 활용해 파워 디바이스 및 선진 패키징 라인에 130억 달러 이상을 투입해 반도체 산업 기반의 활성화를 도모하고 있습니다. 인도의 생산 연동형 인센티브(PLI) 제도는 소규모이면서 국내 EV 및 태양광 시장을 견인하고 있습니다.
북미는 데이터센터 건설과 EV 보급 가속의 혜택을 누리고 있습니다. 인텔, 울프스피드, 온세미가 캐롤라이나주와 애리조나주에 200mm SiC 생산 능력을 추가하여 수입 의존도를 저하시킴으로써 북미의 MOSFET 파워 트랜지스터 시장 규모는 확대될 것으로 전망됩니다. CHIPS법에 의해 특히 방위 중요 부품이나 자동차용 인증 라인에 있어서, 국내 노드에 대한 조달 시프트가 진행되고 있습니다.
유럽은 독일의 자동차 대기업과 이탈리아의 아날로그 전문 팹을 기반으로 약 17.80%의 점유율을 차지했습니다. 엄격한 환경 규제는 신재생 에너지용 인버터 및 급속 충전기를 위한 고효율 1,200V SiC 디바이스 수요를 촉진하고 있습니다. 한편 사우디아라비아 및 아랍에미리트(UAE)는 중동 수요를 대규모 태양광 발전소나 산업용 드라이브로 이끌고 있지만, 생산 능력은 여전히 수입 의존형입니다. 라틴아메리카의 성장은 브라질 지역 EV 인센티브와 칠레의 재생에너지 입찰에 연동하고 있지만, 생산량은 아시아태평양과 북미에 비해 여전히 소규모입니다.
기타 혜택 :
- 엑셀 형식 시장 예측(ME) 시트
- 애널리스트에 의한 3개월간의 지원
자주 묻는 질문
목차
제1장 서론
- 조사의 전제조건 및 시장 정의
- 조사 범위
제2장 조사 방법
제3장 주요 요약
제4장 시장 상황
- 시장 개요
- 시장 성장 촉진요인
- EV 생산 붐에 의해 트랙션용 및 차재 충전기용 MOSFET 수요 증가
- 태양광 및 풍력 발전에 있어서 재생에너지용 인버터 도입 확대
- 저소비 전력 MOSFET을 필요로 하는 스마트폰 및 웨어러블 단말 출하 대수 급증
- 정부의 '국내 팹 유치' 우대책이 틈새 시장 파운더리 생산 능력 계약 창출
- AI 서버 전원의 고전압 SiC/GaN 스테이지로의 이행
- 200mm SiC 웨이퍼의 비용 급락에 의해 1200V 설계의 채용 확대
- 시장 성장 억제요인
- 와이드 밴드갭 MOSFET의 고비용 다이 및 패키징 비용
- 웨이퍼 생산 능력 부족 및 긴 리드 타임
- 게이트 드라이버 인터페이스 규격의 미정비가 설계 사이클 지연
- 불소계 가스 에칭에 대한 환경세가 생산 비용 촉진
- 업계 공급망 분석
- 규제 상황
- 기술 전망
- Porter's Five Forces 분석
- 공급기업의 협상력
- 구매자의 협상력
- 신규 참가업체의 위협
- 대체품의 위협
- 경쟁도
- 거시 경제적 영향 평가
제5장 시장 규모 및 성장 예측
- 채널 유형별
- N채널
- P채널
- 컴플리멘터리 및 듀얼
- 재료별
- 실리콘
- 탄화규소(SiC)
- 질화갈륨(GaN)
- 기타 재료(GaAs 등)
- 패키지 유형별
- 이산(TO-247/TO-220)
- 표면 실장(DPAK, QFN)
- 파워 모듈
- 웨이퍼 레벨 CSP
- 기타 패키지 유형
- 최종 사용자 산업별
- 자동차 및 운송 장비
- 소비자용 전자 기기
- 산업 및 제조업
- 헬스케어
- 항공우주 및 방위 산업
- 기타 최종 사용자 산업
- 지역별
- 북미
- 미국
- 캐나다
- 멕시코
- 남미
- 브라질
- 아르헨티나
- 콜롬비아
- 기타 남미
- 유럽
- 영국
- 독일
- 프랑스
- 이탈리아
- 스페인
- 기타 유럽
- 아시아태평양
- 중국
- 일본
- 한국
- 인도
- 기타 아시아태평양
- 중동 및 아프리카
- 중동
- 사우디아라비아
- 아랍에미리트(UAE)
- 기타 중동
- 아프리카
- 남아프리카
- 이집트
- 기타 아프리카
- 중동
- 북미
제6장 경쟁 구도
- 시장 집중도
- 전략적 동향
- 시장 점유율 분석
- 기업 프로파일
- Infineon Technologies AG
- STMicroelectronics NV
- ON Semiconductor Corporation
- Texas Instruments Incorporated
- Toshiba Corporation
- Renesas Electronics Corporation
- Mitsubishi Electric Corporation
- Vishay Intertechnology Inc.
- NXP Semiconductors NV
- Analog Devices, Inc.
- Broadcom Inc.
- Microchip Technology Incorporated
- ROHM Co., Ltd.
- Wolfspeed, Inc.
- Alpha and Omega Semiconductor Ltd.
- Littelfuse, Inc.
- Diodes Incorporated
- Nexperia BV
- Fuji Electric Co., Ltd.
- Power Integrations, Inc.
제7장 시장 기회 및 장래 전망
AJY 26.01.30MOSFET power transistors market size in 2026 is estimated at USD 7.82 billion, growing from 2025 value of USD 7.49 billion with 2031 projections showing USD 9.71 billion, growing at 4.42% CAGR over 2026-2031.
This measured expansion reflects escalating electrification in transportation, renewable-energy build-outs, and AI-centric data-center upgrades, even as supply bottlenecks and manufacturing constraints temper near-term momentum. Demand concentrates in high-growth end-user arenas-electric vehicles, solar and wind inverters, and AI servers-where wide-bandgap materials, high-voltage architectures, and advanced packaging provide measurable efficiency gains. Competitive intensity remains moderate; top suppliers leverage vertically integrated fabrication, automotive-grade quality systems, and platform portfolios to defend share while nimble entrants exploit niche capacity and wide-bandgap specialization. Government "fab-on-shore" incentives, most prominently the U.S. CHIPS Act and comparable Asian and European programs, reshape sourcing considerations toward supply resilience, nudging procurement decisions away from pure cost-optimization.
Global MOSFET Power Transistors Market Trends and Insights
EV Production Surge Accelerates Traction MOSFET Adoption
Electric-vehicle output scaling propels high-current traction inverter requirements, lifting automotive semiconductor content toward USD 600-800 per car from roughly USD 400 in combustion models. Silicon-carbide MOSFETs enable 800 V drivetrains that trim 80%-charge times to 15 minutes versus 45 minutes on 400 V systems, justifying 3-4 X material premiums. Infineon's OptiMOS 7 family, introduced in December 2024, cuts switching losses by 30% to meet next-generation inverter thermal envelopes. Automotive-grade qualification under AEC-Q101 standards extends design cycles but entrenches incumbent suppliers with proven reliability records.
Government Semiconductor Incentives Reshape Manufacturing Geography
The USD 53 billion CHIPS and Science Act subsidizes domestic U.S. fabrication, shifting sourcing decisions toward resiliency over lowest cost. TSMC's Arizona site, backed by USD 6.6 billion in grants, will commence power semiconductor output in 2028, while Intel's Ohio fabs target automotive-grade MOSFET nodes. Parallel programs in South Korea, Japan, and the European Union foster localized clusters that shorten lead-times for regional automakers and renewable-energy integrators, though meaningful capacity only arrives post-2027.
Wide-Bandgap Cost Premiums Limit Mass-Market Penetration
SiC and GaN dies command 3-10 X silicon prices, with 150 mm SiC wafers selling for USD 1,500-2,000 versus USD 50 slices of silicon. Yields linger around 60-80%, and specialized high-voltage packages add USD 2-5 per device. Cost curves improve with 200 mm adoption, yet material properties and capital intensity keep absolute pricing well above legacy silicon through the forecast window.
Other drivers and restraints analyzed in the detailed report include:
- AI Server Power Architecture Migration Drives SiC Adoption
- Renewable-Energy Inverter Scaling Expands Grid-Tied Applications
- Supply Chain Bottlenecks Extend Lead-Times
For complete list of drivers and restraints, kindly check the Table Of Contents.
Segment Analysis
N-channel devices represented 72.55% of 2025 revenue, underscoring their lower on-resistance and higher electron mobility advantages that remain decisive in high-frequency converters. This share equates to a dominant MOSFET power transistors market position across traction inverters, solar MPPTs, and server VRMs. Complementary/dual devices, while smaller, unlock synchronous rectification benefits that shave 2-3 percentage-point converter losses, propelling a forecast-leading 5.48% CAGR.
Designers pair complementary MOSFETs in half-bridge topologies for DC-DC converters, optimizing conduction during dead-time and trimming shoot-through risk. Adoption scales with AI server and telecom rectifiers, where every watt saved converts to lower cooling loads. Although P-channel devices retain niche high-side roles, their higher on-resistance cedes most growth to dual-channel implementations that balance performance and cost efficiency.
Silicon accounts for 68.75% of 2025 revenue on the back of mature 200 mm fabs, ample supply, and USD 0.05-0.15 per die economics that lock silicon into sub-600 V sockets. Here, the MOSFET power transistors market share for silicon remains sticky despite SiC enthusiasm. Silicon-carbide's 5.65% CAGR reflects 800 V EV drivetrains, 1,500 V solar strings, and industrial drives demanding >200 °C junction capability.
Higher thermal conductivity and three-fold critical electric field tolerance grant SiC MOSFETs lower switching and conduction losses at elevated voltages. GaN occupies the 650 V, 1-2 MHz switching sweet spot, coveted by quick-charge AC adapters and LIDAR pulser stages, yet wafer scaling and substrate availability restrain mass volumes through 2031. Other compound semiconductors remain specialty plays with minimal revenue contribution.
The MOSFET Power Transistors Market Report is Segmented by Channel Type (N-Channel, P-Channel, and Complementary/Dual), Material Technology (Silicon, Silicon-Carbide, Gallium-Nitride, and More), Package Type (Discrete, Surface-Mount, Power Modules, and More), End-User Industry (Automotive, Consumer Electronics, Industrial and Manufacturing, and More), and Geography. The Market Forecasts are Provided in Terms of Value (USD).
Geography Analysis
Asia-Pacific led with 45.20% of 2025 revenue and a 7.25% forecast CAGR. China, Taiwan, and South Korea combine mature foundry nodes with downstream electronics assembly clusters, sustaining localized demand loops. Japan rejuvenates its semiconductor footprint with government subsidies topping USD 13 billion for power device and advanced-packaging lines. India's production-linked incentive (PLI) schemes tap into domestic EV and solar markets, albeit from a small base.
North America benefits from data-center buildouts and accelerating EV adoption. The MOSFET power transistors market size for North America is poised to expand as Intel, Wolfspeed, and onsemi add 200 mm SiC capacity in the Carolinas and Arizona, reducing import reliance. The CHIPS Act tilts sourcing toward domestic nodes, especially for defense-critical and automotive qualification streams.
Europe commands close to 17.80% share, anchored by Germany's automotive giants and Italy's analog specialist fabs. Stricter eco-regulations spur demand for high-efficiency 1,200 V SiC devices in renewable-energy inverters and fast-chargers. Meanwhile, Saudi Arabia and the United Arab Emirates steer Middle East demand toward utility-scale solar farms and industrial drives, yet capacity remains import-oriented. Latin American growth tracks regional EV incentives in Brazil and renewable-energy tenders in Chile, though volume remains modest relative to APAC or NA.
- Infineon Technologies AG
- STMicroelectronics N.V.
- ON Semiconductor Corporation
- Texas Instruments Incorporated
- Toshiba Corporation
- Renesas Electronics Corporation
- Mitsubishi Electric Corporation
- Vishay Intertechnology Inc.
- NXP Semiconductors N.V.
- Analog Devices, Inc.
- Broadcom Inc.
- Microchip Technology Incorporated
- ROHM Co., Ltd.
- Wolfspeed, Inc.
- Alpha and Omega Semiconductor Ltd.
- Littelfuse, Inc.
- Diodes Incorporated
- Nexperia B.V.
- Fuji Electric Co., Ltd.
- Power Integrations, Inc.
Additional Benefits:
- The market estimate (ME) sheet in Excel format
- 3 months of analyst support
TABLE OF CONTENTS
1 INTRODUCTION
- 1.1 Study Assumptions and Market Definition
- 1.2 Scope of the Study
2 RESEARCH METHODOLOGY
3 EXECUTIVE SUMMARY
4 MARKET LANDSCAPE
- 4.1 Market Overview
- 4.2 Market Drivers
- 4.2.1 EV-production boom elevating demand for traction and onboard-charger MOSFETs
- 4.2.2 Renewable-energy inverter build-outs in solar and wind
- 4.2.3 Explosive smartphone and wearable shipments needing low-power MOSFETs
- 4.2.4 Government "fab-on-shore" incentives spawning niche foundry capacity deals
- 4.2.5 AI-server power-supply migration to high-voltage SiC/GaN stages
- 4.2.6 Cost collapse from 200 mm SiC wafers unlocking 1200 V design wins
- 4.3 Market Restraints
- 4.3.1 Wide-bandgap MOSFETs' high die and packaging costs
- 4.3.2 Wafer-capacity shortages and long lead-times
- 4.3.3 Lack of gate-driver interface standard slows design cycles
- 4.3.4 Eco-taxes on fluorinated-gas etching raise production costs
- 4.4 Industry Supply Chain Analysis
- 4.5 Regulatory Landscape
- 4.6 Technological Outlook
- 4.7 Porter's Five Forces Analysis
- 4.7.1 Bargaining Power of Suppliers
- 4.7.2 Bargaining Power of Buyers
- 4.7.3 Threat of New Entrants
- 4.7.4 Threat of Substitutes
- 4.7.5 Degree of Competition
- 4.8 Assessment of Macroeconomic Impact
5 MARKET SIZE AND GROWTH FORECASTS (VALUE)
- 5.1 By Channel Type
- 5.1.1 N-channel
- 5.1.2 P-channel
- 5.1.3 Complementary / Dual
- 5.2 By Material
- 5.2.1 Silicon
- 5.2.2 Silicon-Carbide (SiC)
- 5.2.3 Gallium-Nitride (GaN)
- 5.2.4 Other Materials (GaAs, etc.)
- 5.3 By Package Type
- 5.3.1 Discrete (TO-247/TO-220)
- 5.3.2 Surface-Mount (DPAK, QFN)
- 5.3.3 Power Modules
- 5.3.4 Wafer-Level CSP
- 5.3.5 Other Package Types
- 5.4 By End-user Industry
- 5.4.1 Automotive and Transportation
- 5.4.2 Consumer Electronics
- 5.4.3 Industrial and Manufacturing
- 5.4.4 Healthcare
- 5.4.5 Aerospace and Defense
- 5.4.6 Other End-user Industries
- 5.5 By Geography
- 5.5.1 North America
- 5.5.1.1 United States
- 5.5.1.2 Canada
- 5.5.1.3 Mexico
- 5.5.2 South America
- 5.5.2.1 Brazil
- 5.5.2.2 Argentina
- 5.5.2.3 Colombia
- 5.5.2.4 Rest of South America
- 5.5.3 Europe
- 5.5.3.1 United Kingdom
- 5.5.3.2 Germany
- 5.5.3.3 France
- 5.5.3.4 Italy
- 5.5.3.5 Spain
- 5.5.3.6 Rest of Europe
- 5.5.4 Asia-Pacific
- 5.5.4.1 China
- 5.5.4.2 Japan
- 5.5.4.3 South Korea
- 5.5.4.4 India
- 5.5.4.5 Rest of Asia-Pacific
- 5.5.5 Middle East and Africa
- 5.5.5.1 Middle East
- 5.5.5.1.1 Saudi Arabia
- 5.5.5.1.2 United Arab Emirates
- 5.5.5.1.3 Rest of Middle East
- 5.5.5.2 Africa
- 5.5.5.2.1 South Africa
- 5.5.5.2.2 Egypt
- 5.5.5.2.3 Rest of Africa
- 5.5.5.1 Middle East
- 5.5.1 North America
6 COMPETITIVE LANDSCAPE
- 6.1 Market Concentration
- 6.2 Strategic Moves
- 6.3 Market Share Analysis
- 6.4 Company Profiles (includes Global level Overview, Market level overview, Core Segments, Financials as available, Strategic Information, Market Rank/Share for key companies, Products and Services, and Recent Developments)
- 6.4.1 Infineon Technologies AG
- 6.4.2 STMicroelectronics N.V.
- 6.4.3 ON Semiconductor Corporation
- 6.4.4 Texas Instruments Incorporated
- 6.4.5 Toshiba Corporation
- 6.4.6 Renesas Electronics Corporation
- 6.4.7 Mitsubishi Electric Corporation
- 6.4.8 Vishay Intertechnology Inc.
- 6.4.9 NXP Semiconductors N.V.
- 6.4.10 Analog Devices, Inc.
- 6.4.11 Broadcom Inc.
- 6.4.12 Microchip Technology Incorporated
- 6.4.13 ROHM Co., Ltd.
- 6.4.14 Wolfspeed, Inc.
- 6.4.15 Alpha and Omega Semiconductor Ltd.
- 6.4.16 Littelfuse, Inc.
- 6.4.17 Diodes Incorporated
- 6.4.18 Nexperia B.V.
- 6.4.19 Fuji Electric Co., Ltd.
- 6.4.20 Power Integrations, Inc.
7 MARKET OPPORTUNITIES AND FUTURE OUTLOOK
- 7.1 White-space and Unmet-Need Assessment
