


|
시장보고서
상품코드
1911744
전기 자전거 시장 : 시장 점유율 분석, 산업 동향 및 통계, 성장 예측(2026-2031년)E-Bike - Market Share Analysis, Industry Trends & Statistics, Growth Forecasts (2026 - 2031) |
||||||
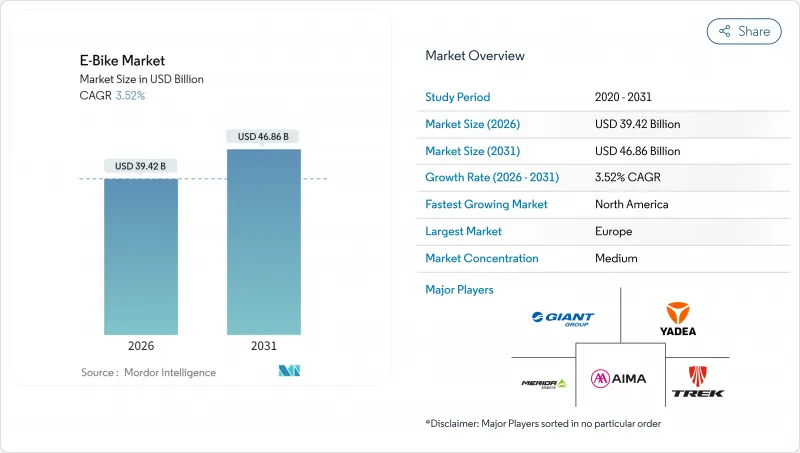
전기 자전거 시장 규모는 2026년 394억 2,000만 달러로 추정되고, 2025년 380억 8,000만 달러에서 성장이 예상됩니다.
2031년까지 468억 6,000만 달러에 달할 것으로 예측되며, 2026-2031년 CAGR 3.52%로 확대될 전망입니다.
이 측정된 확대는 기업용 리스 제도에 의해 직원이 급여 공제 방식으로 자전거를 이용할 수 있게 됨으로써 초기 도입 단계에서 주류 이용 단계로의 이행을 반영하고 있습니다. 수요는 3,500-5,999달러의 프리미엄 모델로 이동하고 있으며, 이 가격대가 가장 빠르게 성장하고 있습니다. 한편, 프랑스의 4,000유로(약 4,622달러) 보조금과 폴란드의 3억 즈워티(약 8,100만 달러) 프로그램 등 대상을 좁힌 보조금이 대상 고객층의 확대를 계속하고 있습니다. 배터리 기술은 여전히 기초이며, 리튬 이온이 주요 점유율을 차지하고 있지만, 나트륨 이온 및 고체 화학 물질이 중국 중심의 원재료 위험을 완화하기 위해 등장하고 있습니다.
세계의 전기 자전거 시장 동향 및 인사이트
도시 지역의 정체가 미세 이동성을 촉진
일선 도시의 주차 공간 비용은 3만 달러에 달하며 5-15km의 이동(도시 이동의 40%를 차지하는 거리)에서 전기 자전거는 비용 효율적인 통근수단이 되고 있습니다. 런던의 초저 배출 구역(ULEZ) 확대 및 7,000파운드(약 9,319달러)의 폐차 보조금으로 배송 업체에서의 보급이 가속되고 있습니다. 한편, 아마존과 구글과 같은 기업들은 주차 문제를 완화하고 지속가능성 목표를 달성하기 위해 전기 자전거의 월 사용료를 보조하고 있습니다.
리튬 이온 배터리의 에너지 밀도 및 비용 저하
리튬 이온 배터리 팩의 가격은 2010년 이후 크게 떨어졌으며, 100km 이상의 항속 거리를 가진 자전거가 2,000달러 미만인 수준이 되었습니다. 급속 충전 설계에서는 30분에 80%의 충전이 가능해져 고가동률의 상용 플릿 도입의 길이 열리고 있습니다. 나트륨 이온 배터리의 프로토타입은 비용을 30% 절감하면서 동등한 사이클 수명을 약속하고 있으며, 고체 배터리의 기술 로드맵에서는 2028년까지 에너지 밀도를 2배로 높이는 것을 목표로 하고 있습니다.
배터리 화재 사고 및 엄격한 안전 기준
뉴욕시에서는 2023년에 187건의 전동 이동성 화재가 발생하여 4년간의 손해액은 5억 1,860만 달러에 달했습니다. 캘리포니아의 SB 1271 법안 및 UL 2849 표준은 인증된 팩을 사용해야 하며, 단위당 200-500달러의 추가 비용이 발생합니다. 제조업체는 열 관리 기술 및 원격 진단 시스템에 대한 투자를 강화하고 규제 대응을 추진하고 있습니다.
부문 분석
2025년 페달 어시스트 모델 시장 규모는 78.90%라는 압도적인 점유율에 도달했습니다. EU 규정이 자전거로 분류하는 유리한 환경이 기여합니다. 시속 45km까지의 어시스트를 제공하는 스피드 페데렉 모델은 밀집 도시에서 자동차 수준의 이동 시간을 요구하는 통근자 수요를 받아 CAGR 4.02%로 확대중입니다.
제조업체 각 회사는 지형과 라이더 습관에 따라 출력을 최적화하기 위해 모터 컨트롤러에 AI 알고리즘을 통합합니다. 시마노가 곧 발표 예정인 자동 변속 드라이브 트레인은 공급업체가 고토크 모터와 스마트 기어 박스를 결합하여 도시의 전문층에 대한 소구력을 강화하고 있는 좋은 예입니다.
도시형 자전거는 땀을 흘리지 않고 통근할 수 있는 편리성으로부터, 2025년에는 시장 점유율의 76.05%를 차지했습니다. 한편, 트레킹 및 마운틴 모델은 투어 사업자가 전동 어시스트 차량을 표준 장비하게 된 영향으로 3.65%의 연평균 복합 성장률(CAGR)로 성장을 계속하고 있습니다.
사업자 측은 이용층 확대, 노인 사이클리스트, 체력 수준이 다른 그룹을 주요 성장 요인으로 파악하고 있습니다. 트레일 이용 규칙의 진화에 따라, 이 부문은 국립공원 및 리조트지에 대한 추가 침투가 기대되고 있습니다.
2025년 시점에서 리튬 이온 배터리는 전기 자전거 시장의 98.41%를 차지했으며, 높은 비용 경쟁력 및 에너지 밀도를 나타내고 있습니다. 나트륨 이온 배터리 및 초기 단계의 고체 배터리 프로토타입을 포함한 '기타' 카테고리는 브랜드가 원재료 위험을 분산시키는 움직임을 받으며 CAGR 4.32%로 확대 중입니다.
OEM 제조업체는 중국 의존 가공 공정을 줄이기 위해 각형 및 원통형 배터리를 듀얼 소싱합니다. 나트륨 이온 배터리가 2027년까지 예상되는 가격 경쟁력을 달성한 경우, 이 화학 기술은 전통적인 팩에서 두 자리 점유율을 빼앗을 수 있습니다.
지역별 분석
유럽은 2025년 전기 자전거 시장 수익의 54.80%를 차지했습니다. 독일 단독으로 1,570만 대가 유통되어 2024년에는 210만대를 판매했습니다. 여러 노동자를 대상으로 하는 급여 공제 제도가 뒷받침되고 있습니다. 네덜란드에서는 전 연령층에 보급된 포화 경향을 볼 수 있는 한편, 프랑스에서는 4,000유로(약 4,622달러)의 저소득자용 보조금에 의해 신규 구매자가 계속적으로 유입하고 있습니다. 연속 자전거 도로 네트워크와 자전거 우선 도시 계획은 유럽의 지속적인 경쟁 우위를 유지합니다.
북미는 현재 규모야말로 작은 반면, CAGR 7.19%에서 가장 빠르게 성장하고 있는 지역입니다. 캘리포니아주와 뉴욕주에서 최대 1,750달러의 주 보조금 및 기업 보조금이 결합되어 잠재적인 수요를 유발하고 있습니다. 캐나다에서는 4억 캐나다 달러(약 2억 8,600만 달러)의 인프라 정비에 의해 전기 자전거 전용 레인과 충전 거점을 연결했습니다. 통근자나 배달 라이더를 위한 엔드 투 엔드의 플릿을 창출하고 있습니다.
아시아태평양은 다양한 상황이 짜여져 있습니다. 중국은 미국을 위한 전기 자전거 수입의 대부분을 공급하고 2024년에는 현저한 수출 수입을 기록했습니다. 인도는 2024년에 전기 자동차의 대폭적인 보급을 달성했지만, 원부 자전거가 페달 어시스트형을 여전히 웃돌고 있습니다. 일본과 한국은 하이테크를 중시한 프리미엄 시장에 대응하고, 호주는 에코 투어리즘 루트를 활용해 트레킹 수요를 견인하고 있습니다. 지역별 규제 및 소득 수준에 따라 판매 채널, 가격 및 사양 전략을 개별적으로 책정할 필요가 있습니다.
기타 혜택 :
- 엑셀 형식 시장 예측(ME) 시트
- 애널리스트에 의한 3개월간의 지원
자주 묻는 질문
목차
제1장 서론
- 조사의 전제조건 및 시장 정의
- 조사 범위
제2장 조사 방법
제3장 주요 요약
제4장 주요 업계 동향
- 연간 자전거 판매 대수
- 평균 판매 가격 및 가격대 구성
- 전기 자전거 및 부품의 월경 무역(수입 및 수출)
- 전기 자전거의 총 자전거 판매에 차지하는 비율
- 편도 5-15km의 통근자 비율(%)
- 자전거 및 전동 어시스트 자전거 렌탈 시장 규모
- 전기 자전거용 배터리 팩의 가격
- 배터리 화학의 가격 비교
- 라스트 마일(초로컬) 배송량
- 보호된 자전거 전용 레인(km)
- 트레킹 및 아웃도어 활동에 대한 참가율
- 전기 자전거용 배터리의 용량(Wh)
- 도시 교통 정체 지수
- 규제 프레임워크
- 전기 자전거의 형식 인정 및 인증
- 수출입 및 무역 규제
- 분류, 도로 이용 및 이용자 규칙
- 배터리, 충전기 및 충전 안전성
제5장 시장 상황
- 시장 개요
- 시장 성장 촉진요인
- 도시의 정체가 마이크로모빌리티 촉진
- 리튬 이온 배터리의 에너지 밀도 및 비용 저하 동향
- 정부의 장려책 및 구입 보조금
- 기업용 종업원 전기 자전거 복리 후생 프로그램
- 화물용 전기 자전거 보험료 할인
- 전기 자전거 관광 루트의 성장
- 시장 성장 억제요인
- 배터리 화재 사고 및 엄격한 안전 기준
- 기존의 오토바이에 비해 높은 초기 비용
- 도상 지역에서 충전 인프라 부족
- 중요 광물 공급 변동성
- 밸류체인 및 공급망 분석
- 규제 상황
- 기술 전망
- Porter's Five Forces
- 신규 참가업체의 위협
- 공급기업의 협상력
- 구매자의 협상력
- 대체품의 위협
- 경쟁 기업 간 경쟁 관계
제6장 시장 규모 및 성장 예측(금액 및 수량)
- 추진 유형별
- 페달 어시스트
- 스피드 페데렉
- 스로틀 어시스트
- 용도 유형별
- 화물 및 유틸리티
- 거리 및 도시
- 트레킹 및 마운틴
- 배터리 유형별
- 납축전지
- 리튬 이온 배터리
- 기타
- 모터 설치 장소별
- 허브(프론트 및 리어)
- 미드 드라이브
- 구동 시스템별
- 체인 구동
- 벨트 구동
- 모터 출력별
- 250W 미만
- 251-350 W
- 351-500 W
- 501-600 W
- 600W 이상
- 가격대별
- 1,000달러 미만
- 1,000-1,499 USD
- 1,500-2,499 USD
- 2,500-3,499 USD
- 3,500-5,999 USD
- 6,000달러 이상
- 판매 채널별
- 온라인
- 오프라인
- 최종 용도별
- 상용 배송
- 소매 및 상품 배송
- 식품 및 음료 배달
- 서비스 제공업체
- 개인 및 가족 이용
- 공공 공익
- 기타
- 상용 배송
- 지역별
- 북미
- 미국
- 캐나다
- 기타 북미
- 남미
- 아르헨티나
- 브라질
- 기타 남미
- 유럽
- 독일
- 영국
- 프랑스
- 이탈리아
- 스페인
- 네덜란드
- 오스트리아
- 스웨덴
- 스위스
- 기타 유럽
- 아시아태평양
- 중국
- 인도
- 일본
- 한국
- 호주
- 뉴질랜드
- 기타 아시아태평양
- 중동 및 아프리카
- 사우디아라비아
- 아랍에미리트(UAE)
- 남아프리카
- 기타 중동 및 아프리카
- 북미
제7장 경쟁 구도
- 시장 집중도
- 전략적 동향
- 시장 점유율 분석
- 기업 프로파일
- Aima Technology Group Co., Ltd.
- Canyon Bicycles GmbH
- Fritzmeier Systems GmbH & Co. KG(M1 Sporttechnik)
- Giant Manufacturing Co., Ltd.
- Jiangsu Xinri E-Vehicle Co., Ltd.
- Luyuan Electric Vehicle Co., Ltd.
- Merida Industry Co., Ltd.
- Myvelo Co., Ltd.
- Rad Power Bikes Inc.
- Riese & Muller GmbH
- Pon Holdings BV
- Samchuly Bicycle
- Specialized Bicycle Components, Inc.
- Dongguan Tailing Electric Vehicle Co., Ltd
- Tianjin Fuji-Ta Bicycle Co., Ltd.
- Trek Bicycle Corporation
- VanMoof BV
- Yadea Group Holdings Ltd.
- Yamaha Motor Co., Ltd.
제8장 시장 기회 및 장래 전망
제9장 CEO에 대한 주요 전략적 질문
AJY 26.01.30e-bike market size in 2026 is estimated at USD 39.42 billion, growing from 2025 value of USD 38.08 billion with 2031 projections showing USD 46.86 billion, growing at 3.52% CAGR over 2026-2031.

The measured expansion reflects the transition from early adoption to mainstream use as corporate leasing schemes now give employees access to salary-sacrifice bikes. Demand is tilting toward premium models priced USD 3,500-5,999, the fastest-growing band, while targeted subsidies-France's EUR 4,000 (~USD 4,622) incentive and Poland's PLN 300 million (~USD 81 million) program-continue to widen the addressable base. Battery technology remains a cornerstone; lithium-ion captures a major share, yet sodium-ion and solid-state chemistries are lining up to ease China-centric raw-material risk.
Global E-Bike Market Trends and Insights
Urban Congestion Driving Micro-Mobility
Parking spaces in tier-1 cities cost as high as USD 30,000, making e-bikes a cost-efficient commute tool over 5-15 km trips-the distance that accounts for 40% of urban journeys. London's ULEZ expansion, plus GBP 7,000 (~USD 9,319) scrappage grants, has accelerated uptake among couriers, while companies such as Amazon and Google subsidize monthly e-bike subscriptions to ease parking stress and hit sustainability targets .
Li-ion Battery Energy-Density and Cost Declines
Lithium-ion pack prices have declined significantly since 2010, moving 100+ km range bikes under the USD 2,000 mark. Fast-charge designs now reach 80% in 30 minutes, opening doors for high-utilization commercial fleets. Sodium-ion prototypes promise similar cycle life at 30% reduced cost, while solid-state roadmaps target 2X energy density by 2028.
Battery-Fire Incidents and Stricter Safety Norms
NYC recorded 187 e-mobility fires in 2023, lifting four-year costs to USD 518.6 million. California's SB 1271 and the UL 2849 standard now require certified packs, adding USD 200-500 per unit. Manufacturers are investing in thermal management and remote diagnostics to keep pace.
Other drivers and restraints analyzed in the detailed report include:
- Government Incentives and Purchase Subsidies
- Corporate Employee E-Bike Benefit Programs
- High Upfront Cost vs. Conventional Bikes
For complete list of drivers and restraints, kindly check the Table Of Contents.
Segment Analysis
The market size for pedal-assist models reached a commanding 78.90% share in 2025, benefiting from favorable EU regulations that classify them as bicycles. Speed-pedelec variants, offering assistance up to 45 km/h, are charting a 4.02% CAGR as commuters seek car-like travel times in dense cities.
Manufacturers are layering AI algorithms onto motor controllers to optimize output by terrain and rider habits. Shimano's forthcoming automatic-shift drivetrain illustrates how suppliers bundle smart gearboxes with high-torque motors, strengthening their appeal among urban professionals.
City/urban bikes generated 76.05% of the market share in 2025 as urban riders opted for sweat-free commuting. Trekking/mountain models, however, are advancing at 3.65% CAGR, spurred by tour operators that now default to e-assisted fleets.
Operators see expanded demographics, older cyclists and mixed-fitness groups, as key growth levers. As trail access rules evolve, the segment is poised for further penetration into national parks and resort destinations.
Lithium-ion cells controlled 98.41% of the e-bike market share in 2025, underlining cost leadership and energy density. The "Others" bucket, housing sodium-ion and early solid-state prototypes, is growing at 4.32% CAGR as brands hedge raw-material exposure.
OEMs are dual-sourcing prismatic and cylindrical formats to mitigate China-centric processing. Should sodium-ion hit expected price parity by 2027, the chemistry could siphon double-digit share from legacy packs.
The Global E-Bike Market Report is Segmented by Propulsion Type (Pedal Assisted, Speed Pedelec, and More), Application Type (Cargo/Utility, City/Urban, and More), Battery Type (Lead Acid Battery, Lithium-Ion Battery, and More), Motor Placement (Hub (Front/Rear), Mid-Drive), Drive Systems, Motor Power, Price Band, Sales Channel, End Use, and Geography. The Market Forecasts are Provided in Terms of Value (USD) and Volume (Units).
Geography Analysis
Europe retained 54.80% of the 2025 e-bike market revenue. Germany alone has 15.7 million units in circulation and sold 2.1 million in 2024, helped by salary-sacrifice programs covering several workers . The Netherlands shows saturation traits, with e-bikes normalized across age groups, while France's EUR 4,000 (~USD 4,622) low-income grant keeps funneling new buyers. Continuous path networks and bicycle-first urban planning remain Europe's durable competitive edge.
North America, though smaller today, is the quickest-growing region at 7.19% CAGR. State rebates of up to USD 1,750 in California and New York, alongside corporate stipends, are unlocking latent demand. Canada's CAD 400 million (~USD 286 million) infrastructure rollout links e-bike lanes to charging nodes, creating end-to-end fleets for commuters and delivery riders alike.
Asia-Pacific reflects a tapestry of conditions. China supplies a major share of e-bike imports in the United States and posted notable export receipts in 2024. India crossed a significant electric two-wheeler mark in 2024, though mopeds still outweigh pedal-assist formats. Japan and South Korea cater to premium, tech-heavy niches, while Australia leans on eco-tourism routes to lift trekking sales. Localized regulation and income profiles dictate tailored channel, price, and specification strategies.
- Aima Technology Group Co., Ltd.
- Canyon Bicycles GmbH
- Fritzmeier Systems GmbH & Co. KG (M1 Sporttechnik)
- Giant Manufacturing Co., Ltd.
- Jiangsu Xinri E-Vehicle Co., Ltd.
- Luyuan Electric Vehicle Co., Ltd.
- Merida Industry Co., Ltd.
- Myvelo Co., Ltd.
- Rad Power Bikes Inc.
- Riese & Muller GmbH
- Pon Holdings B.V.
- Samchuly Bicycle
- Specialized Bicycle Components, Inc.
- Dongguan Tailing Electric Vehicle Co., Ltd
- Tianjin Fuji-Ta Bicycle Co., Ltd.
- Trek Bicycle Corporation
- VanMoof BV
- Yadea Group Holdings Ltd.
- Yamaha Motor Co., Ltd.
Additional Benefits:
- The market estimate (ME) sheet in Excel format
- 3 months of analyst support
TABLE OF CONTENTS
1 Introduction
- 1.1 Study Assumptions & Market Definition
- 1.2 Scope of the Study
2 Research Methodology
3 Executive Summary
4 Key Industry Trends
- 4.1 Annual Bicycle Sales
- 4.2 Average Selling Price & Price-Band Mix
- 4.3 Cross-Border Trade in E-Bikes & Parts (Imports/Exports)
- 4.4 E-Bike Share of Total Bicycle Sales
- 4.5 Commuters with 5-15 km One-Way Trips (%)
- 4.6 Bicycle/E-Bike Rental Market Size
- 4.7 E-Bike Battery Pack Price
- 4.8 Battery Chemistry Price Comparison
- 4.9 Last-Mile (Hyper-Local) Delivery Volume
- 4.10 Protected Bicycle Lanes (km)
- 4.11 Trekking/Outdoor Activity Participation
- 4.12 E-Bike Battery Capacity (Wh)
- 4.13 Urban Traffic Congestion Index
- 4.14 Regulatory Framework
- 4.14.1 Homologation and Certification of E-Bicycles
- 4.14.2 Export-Import and Trade Regulation
- 4.14.3 Classification, Road Access and User Rules
- 4.14.4 Battery, Charger and Charging Safety
5 Market Landscape
- 5.1 Market Overview
- 5.2 Market Drivers
- 5.2.1 Urban Congestion Driving Micro-Mobility
- 5.2.2 Li-ion Battery Energy-Density and Cost Declines
- 5.2.3 Government Incentives and Purchase Subsidies
- 5.2.4 Corporate Employee E-Bike Benefit Programs
- 5.2.5 Insurance Discounts for Cargo E-Bikes
- 5.2.6 Growth of E-Bike Tourism Routes
- 5.3 Market Restraints
- 5.3.1 Battery-Fire Incidents and Stricter Safety Norms
- 5.3.2 High Upfront Cost vs. Conventional Bikes
- 5.3.3 Limited Charging Infra in Developing Regions
- 5.3.4 Critical-Mineral Supply Volatility
- 5.4 Value / Supply-Chain Analysis
- 5.5 Regulatory Landscape
- 5.6 Technological Outlook
- 5.7 Porter's Five Forces
- 5.7.1 Threat of New Entrants
- 5.7.2 Bargaining Power of Suppliers
- 5.7.3 Bargaining Power of Buyers
- 5.7.4 Threat of Substitutes
- 5.7.5 Competitive Rivalry
6 Market Size & Growth Forecasts (Value (USD) and Volume (Units))
- 6.1 By Propulsion Type
- 6.1.1 Pedal Assisted
- 6.1.2 Speed Pedelec
- 6.1.3 Throttle Assisted
- 6.2 By Application Type
- 6.2.1 Cargo/Utility
- 6.2.2 City/Urban
- 6.2.3 Trekking/Mountain
- 6.3 By Battery Type
- 6.3.1 Lead Acid Battery
- 6.3.2 Lithium-ion Battery
- 6.3.3 Others
- 6.4 By Motor Placement
- 6.4.1 Hub (Front/Rear)
- 6.4.2 Mid-Drive
- 6.5 By Drive Systems
- 6.5.1 Chain Drive
- 6.5.2 Belt Drive
- 6.6 By Motor Power
- 6.6.1 Below 250 W
- 6.6.2 251-350 W
- 6.6.3 351-500 W
- 6.6.4 501-600 W
- 6.6.5 Above 600 W
- 6.7 By Price Band
- 6.7.1 Up to USD 1,000
- 6.7.2 USD 1,000-1,499
- 6.7.3 USD 1,500-2,499
- 6.7.4 USD 2,500-3,499
- 6.7.5 USD 3,500-5,999
- 6.7.6 Above USD 6,000
- 6.8 By Sales Channel
- 6.8.1 Online
- 6.8.2 Offline
- 6.9 By End Use
- 6.9.1 Commercial Delivery
- 6.9.1.1 Retail and Goods Delivery
- 6.9.1.2 Food and Beverage Delivery
- 6.9.2 Service Providers
- 6.9.3 Personal and Family Use
- 6.9.4 Institutional
- 6.9.5 Others
- 6.9.1 Commercial Delivery
- 6.10 By Geography
- 6.10.1 North America
- 6.10.1.1 United States
- 6.10.1.2 Canada
- 6.10.1.3 Rest of North America
- 6.10.2 South America
- 6.10.2.1 Argentina
- 6.10.2.2 Brazil
- 6.10.2.3 Rest of South America
- 6.10.3 Europe
- 6.10.3.1 Germany
- 6.10.3.2 United Kingdom
- 6.10.3.3 France
- 6.10.3.4 Italy
- 6.10.3.5 Spain
- 6.10.3.6 Netherlands
- 6.10.3.7 Austria
- 6.10.3.8 Sweden
- 6.10.3.9 Switzerland
- 6.10.3.10 Rest of Europe
- 6.10.4 Asia-Pacific
- 6.10.4.1 China
- 6.10.4.2 India
- 6.10.4.3 Japan
- 6.10.4.4 South Korea
- 6.10.4.5 Australia
- 6.10.4.6 New Zealand
- 6.10.4.7 Rest of Asia-Pacific
- 6.10.5 Middle East and Africa
- 6.10.5.1 Saudi Arabia
- 6.10.5.2 United Arab Emirates
- 6.10.5.3 South Africa
- 6.10.5.4 Rest of the Middle East and Africa
- 6.10.1 North America
7 Competitive Landscape
- 7.1 Market Concentration
- 7.2 Strategic Moves
- 7.3 Market Share Analysis
- 7.4 Company Profiles (Includes Global Level Overview, Market Level Overview, Core Segments, Financials as Available, Strategic Information, Market Rank/Share for Key Companies, Products and Services, SWOT Analysis, and Recent Developments)
- 7.4.1 Aima Technology Group Co., Ltd.
- 7.4.2 Canyon Bicycles GmbH
- 7.4.3 Fritzmeier Systems GmbH & Co. KG (M1 Sporttechnik)
- 7.4.4 Giant Manufacturing Co., Ltd.
- 7.4.5 Jiangsu Xinri E-Vehicle Co., Ltd.
- 7.4.6 Luyuan Electric Vehicle Co., Ltd.
- 7.4.7 Merida Industry Co., Ltd.
- 7.4.8 Myvelo Co., Ltd.
- 7.4.9 Rad Power Bikes Inc.
- 7.4.10 Riese & Muller GmbH
- 7.4.11 Pon Holdings B.V.
- 7.4.12 Samchuly Bicycle
- 7.4.13 Specialized Bicycle Components, Inc.
- 7.4.14 Dongguan Tailing Electric Vehicle Co., Ltd
- 7.4.15 Tianjin Fuji-Ta Bicycle Co., Ltd.
- 7.4.16 Trek Bicycle Corporation
- 7.4.17 VanMoof BV
- 7.4.18 Yadea Group Holdings Ltd.
- 7.4.19 Yamaha Motor Co., Ltd.
