
|
시장보고서
상품코드
1940640
3D 프린팅 필라멘트 : 시장 점유율 분석, 업계 동향과 통계, 성장 예측(2026-2031년)3D Printing Filament - Market Share Analysis, Industry Trends & Statistics, Growth Forecasts (2026 - 2031) |
||||||
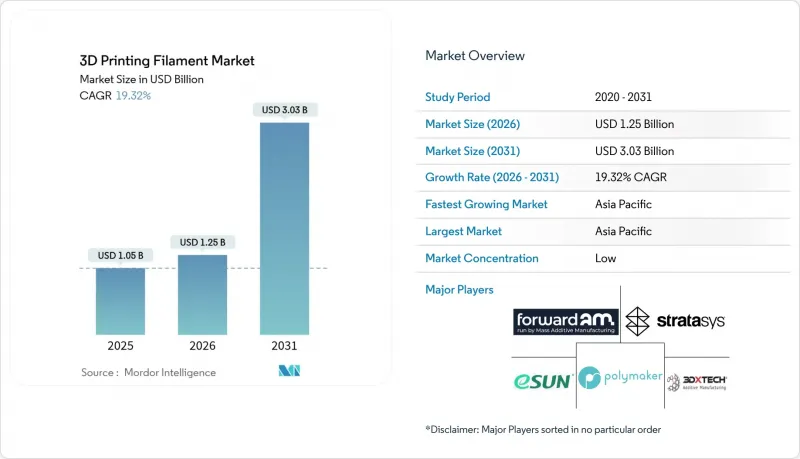
3D 프린팅 필라멘트 시장은 2025년에 10억 5,000만 달러로 평가되었으며, 2026년 12억 5,000만 달러에서 2031년까지 30억 3,000만 달러에 달할 것으로 예측됩니다.
예측 기간(2026-2031년) 동안 CAGR은 19.32%로 예상됩니다.

데스크톱 프린터의 가격 하락과 재료 과학의 꾸준한 발전과 함께 항공우주, 의료, 소비재 분야에서 적층 가공 기술은 시제품 제작 단계에서 대량 생산 환경으로 계속 이동하고 있습니다. 중견 업체들이 사출 성형과 동등한 성능을 갖추면서도 금형 비용을 절감할 수 있는 최종 용도 부품에 용융 적층법(FDM) 라인을 도입하려는 움직임이 가속화되고 있습니다. 플라스틱은 여전히 주요 소재군으로, 바이오 기반 PLA에서 엔지니어링 등급 PEEK에 이르기까지 다양한 등급이 제공되어 거의 모든 사용 사례에서 비용과 성능을 최적화할 수 있습니다. 지역별로는 아시아태평양이 프린터 조립과 필라멘트 배합을 통합한 응집력 있는 공급망에 힘입어 수량 측면에서 주도권을 쥐고 있습니다. 반면, 북미와 유럽은 엄격한 규제 프레임워크를 충족하는 인증된 고성능 배합에 초점을 맞추고 있습니다.
세계 3D 프린팅 필라멘트 시장 동향과 인사이트
프로토타이핑에서 대량 생산으로의 적층 가공 기술 전환
항공우주 및 자동차 제조업체들이 FDM(용융 적층법) 부품을 캐빈 부품, 보닛 아래 브래킷, 지그 등으로 인증함에 따라 수요가 인증된 엔지니어링 열가소성 플라스틱으로 전환되고 있습니다. 대형 제조업체의 경우, 일반적으로 부품이 설계 실험실에서 생산 현장으로 이동하면 필라멘트 구매량이 3배로 증가합니다. 로트 간 치수 정확도를 ±1% 이내로 보장할 수 있는 기업으로 시장이 확대되고 있습니다. 조달 부문은 현재 중합 제어 및 ISO 13485, AS9100 품질 관리 시스템에 대한 투자 실적이 있는 기존 폴리머 공급업체를 우선적으로 채용하고 있으며, 가격 경쟁력보다 재료 보증을 중시하는 경향이 두드러집니다.
소비자 및 의료 분야에서의 대량 맞춤화의 경제성
병원에서는 환자별 드릴 가이드와 두개골 플레이트를 3D 프린팅하는 사례가 증가하여 수술 시간을 최대 45분까지 단축할 수 있습니다. 고가의 재료비도 쉽게 흡수되고 있습니다. 의족 제조업체들은 인증된 PEEK(폴리에테르에테르케톤) 또는 PEKK(폴리에테르에테르케톤케톤) 필라멘트로 전환한 후, 절삭 가공 대비 40-60%의 단가 절감을 실현했다고 보고하고 있습니다. 소비자 브랜드도 비슷한 소량 생산 로직을 채택하여 개인화된 이어폰과 신발 깔창을 생산하고 있습니다. 금형투자를 재료비 추가와 맞바꾸는 방식으로 조수익률을 유지하고 있습니다. 개별 생산에 내재된 생산량 변동성은 유연한 적층 가공 워크플로우를 더욱 촉진하고, 안료와 로트 크기에 관계없이 기계적 특성을 유지할 수 있는 전문 컴파운더에 대한 안정적인 수요를 창출하고 있습니다.
산업용 프린터 및 후처리 고가 설비 투자
고온 폴리머 가공에는 밀폐형 빌드 챔버와 인라인 어닐링 처리가 필요하며, 시스템 가격은 10만 달러 이상입니다. 중소기업의 예산 제약으로 인해 프리미엄 필라멘트의 도입이 지연되고 있으며, 단기적인 수요 증가를 제한하고 있습니다. 북미 이외 지역에서는 장비리스가 미성숙하기 때문에 많은 신흥시장 제조업체들이 고성능 소재 생태계에서 배제되고 있습니다. 공급업체들은 자본을 빠르게 상각할 수 있는 1등급 항공우주 및 의료 고객을 타겟으로 하여 판매량 증가가 부진한 것을 상쇄하고 있습니다.
부문 분석
플라스틱은 2025년 3D 프린팅 필라멘트 시장 점유율의 71.90%를 차지했으며, 2031년까지 21.05%의 CAGR을 달성할 것으로 예상됩니다. 성장은 특수 나일론, 탄소섬유 강화 PETG, PEKK 등급에 집중되어 있으며, 이들은 알루미늄에 근접한 탄성률을 가지면서 개선된 데스크톱 시스템에서 인쇄가 가능합니다. 범용 PLA와 ABS는 교육 현장과 소비자 가젯용으로 계속 공급되고 있지만, 현재 엔지니어링 열가소성 플라스틱은 3D 프린팅 필라멘트 시장에서 플라스틱 수익의 대부분을 차지하고 있습니다. 제조업체들은 고처리량 이축압출기를 활용하여 탄소섬유, 아라미드 또는 세라믹 필러를 혼합하여 경화강 노즐의 마모 없이 인장 강도를 향상시키고 있습니다. 폐쇄형 파라미터 데이터베이스를 보유한 재료 공급업체는 첫 번째 인쇄 성공률을 높이고, 폐기물을 줄이며, 자동차 및 공구 사용자에게 매력적인 부품 단가 경제성을 입증하고 있습니다.
금속 필라멘트는 3D 프린팅 필라멘트 시장 규모의 5% 미만으로 틈새 시장이지만, 소결 후 고밀도가 요구되는 경량 항공우주용 브래킷이나 의료용 임플란트에는 스테인리스 스틸이나 티타늄 블렌드가 필수적입니다. 세라믹 충진 수지는 고온 센서 및 유전체 절연체를 지원하지만, 여러 번의 탈 바인더 사이클로 인한 처리량 병목현상에 직면해 있습니다. 탈 바인더로와 소결 프로파일을 분말 필라멘트 기술과 함께 제공하는 벤더는 분말 베드 용융 방식에서 전환하는 연구소의 채택을 단순화합니다. 이러한 통합적 접근방식은 재료 마진에 더해 서비스 수익원을 창출합니다.
지역별 분석
아시아태평양은 2025년 매출의 39.05%를 창출했으며, 심천, 쑤저우, 서울의 프린터 및 필라멘트 시너지 클러스터가 이를 뒷받침하고 있습니다. 현지 화학 대기업은 ABS, PLA, PETG 원료를 대규모로 공급하고, 위탁 컴파운딩 업체는 수출용 엔지니어링 배합을 혼합하고 있습니다. 정부의 경제대책으로 적층 가공 특화형 산업단지가 조성되어 신규 진입 기업의 자금조달 비용 절감과 프린터 하드웨어의 혁신이 촉진되고 있습니다. 국내 대형 데스크톱 프린터 업체들은 슬라이서 소프트웨어에 자체 소재 프로파일을 사전 로드하여 필라멘트 소비를 정착시키는 브랜드 생태계를 강화하고 있습니다.
북미에서는 인증과 추적성이 필수적인 용도에 대한 중요성이 강조되고 있습니다. 미국은 의료용 PEEK 및 탄소섬유 강화 PEKK의 판매를 주도하고 있으며, 이는 공급업체들이 FDA 마스터 파일 신청과 AS9100 품질 시스템에 많은 투자를 해왔기 때문입니다. 방산 관련 기업은 안보상의 이유로 국내 조달을 우선시하기 때문에 고급 필라멘트의 수익률은 더욱 보호되고 있습니다. 수요 확대는 자동차 제조업체들이 인플레이션 억제법(IRA) 혜택에 대응하기 위해 공급망을 단축하는 온쇼어링(Onshoring) 추세의 수혜를 받고 있습니다.
유럽에서는 환경 관리가 중요시되고 있으며, 최종사용자는 REACH 및 RoHS를 준수하는 바이오 기반 또는 재생 등급을 선택해야 합니다. 독일 자동차 제조업체는 내부 브래킷에 25% 유리섬유 강화 재생 PET를 지정하고, 프랑스 소비재 제조업체는 기업 배출 목표 달성을 위해 사탕수수 유래 PLA 블렌드를 시험적으로 도입하고 있습니다. EU 보조금을 통한 LCA 감사 및 소재 혁신 지원은 현지 공급업체에 R&D 우위를 가져다주고 있습니다. 이 때문에 유럽의 3D 프린팅 필라멘트 시장 규모는 지속가능성과 성능을 겸비한 중상급 부문에 편중되어 있습니다.
기타 특전:
- 엑셀 형식의 시장 예측(ME) 시트
- 애널리스트의 3개월간 지원
자주 묻는 질문
목차
제1장 소개
제2장 조사 방법
제3장 주요 요약
제4장 시장 구도
제5장 시장 규모와 성장 예측
제6장 경쟁 구도
제7장 시장 기회와 향후 전망
KSM 26.03.10The 3D Printing Filament Market was valued at USD 1.05 billion in 2025 and estimated to grow from USD 1.25 billion in 2026 to reach USD 3.03 billion by 2031, at a CAGR of 19.32% during the forecast period (2026-2031).
Rising desktop-printer affordability, coupled with steady material-science advances, continues to pull additive manufacturing from prototyping toward scaled production settings across aerospace, healthcare, and consumer products. Momentum builds as mid-sized manufacturers deploy fused-deposition modeling (FDM) lines for end-use parts that match injection-molded performance while removing tooling costs. Plastics remain the dominant material family because suppliers now offer grades ranging from bio-based PLA to engineering-level PEEK, enabling cost-to-performance matching for virtually every use case. Regionally, Asia-Pacific commands volume leadership, supported by cohesive supply chains that integrate printer assembly with filament compounding, while North America and Europe concentrate on certified, high-performance formulations that meet stringent regulatory frameworks.
Global 3D Printing Filament Market Trends and Insights
Additive Manufacturing Shift from Prototyping to Serial Production
Demand is migrating toward certified engineering thermoplastics as aerospace and automotive producers qualify FDM (Fused Deposition Modeling) parts for cabin components, under-hood brackets, and jigs. Large manufacturers typically triple filament purchases once a part moves from design lab to production floor. Batch traceability and statistical process control have become baseline supplier requirements, opening space for companies that can guarantee +-1 % dimensional consistency lot-to-lot. Procurement teams now prioritize legacy polymer suppliers that invested in polymerization control and ISO 13485 or AS9100 quality management, underlining how material assurance eclipses price sensitivity.
Mass-customisation Economics in Consumer and Medical Sectors
Hospitals increasingly print patient-specific drill guides and cranial plates, cutting operating-room time by up to 45 minutes and absorbing premium material costs with ease. Prosthetic manufacturers report 40-60 % unit savings versus subtractive machining after switching to certified PEEK (Polyetheretherketone) or PEKK (Polyetherketoneketone) filaments. Consumer brands adopt the same small-lot logic for personalized earbuds and footwear midsoles, trading tooling investments for material premiums that leave gross margins intact. Volume volatility inherent in individualized production further incentivizes flexible additive workflows, pushing steady demand to specialized compounders that can hold mechanical properties across pigments and lot sizes.
High Cap-ex for Industrial Printers and Post-processing
Processing high-temperature polymers requires enclosed build chambers and in-line annealing that push system prices beyond USD 100,000. Budget constraints among small and mid-size enterprises delay adoption, limiting near-term pull-through for premium filaments. Equipment leasing is nascent outside North America, leaving many emerging-market manufacturers locked out of high-performance material ecosystems. Suppliers offset sluggish volume growth by targeting Tier 1 aerospace and medical customers able to amortize capital quickly.
Other drivers and restraints analyzed in the detailed report include:
- Rapid Desktop-printer Price Erosion Expanding Hobbyist Base
- Sustainability Push for Bio-based/recycled PET and PLA Filaments
- Mechanical/thermal Limits of Commodity PLA and ABS
For complete list of drivers and restraints, kindly check the Table Of Contents.
Segment Analysis
Plastics held 71.90 % of 3D Printing Filament market share in 2025 and are projected to deliver a 21.05 % CAGR to 2031. Growth concentrates in specialty nylons, carbon-fiber reinforced PETG, and PEKK grades that approach aluminum's modulus yet print on modified desktop systems. Commodity PLA and ABS continue to supply classroom and consumer gadgets, but engineering thermoplastics now command over half of plastics revenue inside the 3D printing filament market. Manufacturers leverage high-throughput twin-screw extrusion to blend carbon fibers, aramid, or ceramic fillers that raise tensile strength without introducing abrasive wear beyond hardened-steel nozzles. Material suppliers with closed-loop parameter databases improve first-time print success, trimming scrap and validating cost-per-part economics attractive to automotive and tooling users.
Metal filaments remain a niche at less than 5 % of 3D Printing Filament market size, yet stainless-steel and titanium blends are indispensable for lightweight aerospace brackets and medical implants requiring high-density after sintering. Ceramic-loaded resins address high-temperature sensors and dielectric insulators but face throughput bottlenecks due to multiple debind cycles. Vendors that bundle de-binder ovens and sintering profiles along with powder-in-filament technology simplify adoption for labs migrating from powder-bed fusion. Their integrated approach generates service revenue streams in addition to material margins.
The 3D Printing Filament Market Report is Segmented by Type (Metals, Plastics, Ceramics, and Other Types), Application (Aerospace and Defense, Automotive, Medical and Dental, Electronics, and Other Applications), and Geography (Asia-Pacific, North America, Europe, South America, and Middle East and Africa). The Market Forecasts are Provided in Terms of Value (USD).
Geography Analysis
The Asia-Pacific region generated 39.05 % of revenue in 2025, underpinned by synergistic printer-and-filament clusters in Shenzhen, Suzhou, and Seoul. Local chemical giants supply ABS, PLA, and PETG feedstocks at scale, while contract compounding houses blend engineering formulations for export. Government stimulus packages fund additive-focused industrial parks, which lower financing costs for new entrants and stimulate printer hardware innovation. Domestic desktop-printer leaders preload slicer software with proprietary material profiles, reinforcing brand ecosystems that keep filament consumption sticky.
North America emphasizes applications where certification and traceability are mandatory. The United States dominates sales of medical-grade PEEK and carbon-fiber PEKK because suppliers have invested heavily in FDA master-file submissions and AS9100 quality systems. Defense contractors favor domestic procurement for security reasons, which further insulates high-end filament margins. Demand growth also benefits from the onshoring trend as automakers shorten supply chains to meet Inflation Reduction Act incentives.
Europe champions environmental stewardship, compelling end users to select bio-based or recycled grades that meet REACH and RoHS compliance. German automotive firms specify recycled PET with 25 % glass fibers for interior brackets, while French consumer-goods makers pilot sugarcane-derived PLA blends to hit corporate emissions goals. EU grants subsidize LCA audits and material innovation, giving local suppliers an R&D edge. The 3D printing filament market size in Europe thus skews toward mid-to-premium segments where sustainability and performance blend.
- 3DXTECH
- Amolen
- BASF
- Braskem
- Covestro AG
- Evonik Industries AG
- Fillamentum
- Forward AM
- Village Plastics
- Markforged
- Mitsubishi Chemical Group
- NatureWorks LLC
- Polymaker
- SABIC
- Shenzhen Esun Industrial Co., Ltd.
- Solvay
- Stratasys
Additional Benefits:
- The market estimate (ME) sheet in Excel format
- 3 months of analyst support
TABLE OF CONTENTS
1 Introduction
- 1.1 Study Assumptions and Market Definition
- 1.2 Scope of the Study
2 Research Methodology
3 Executive Summary
4 Market Landscape
- 4.1 Market Overview
- 4.2 Market Drivers
- 4.2.1 Additive Manufacturing Shift from Prototyping to Serial Production
- 4.2.2 Mass-customisation Economics in Consumer and Medical Sectors
- 4.2.3 Rapid Desktop-printer Price Erosion Expanding Hobbyist Base
- 4.2.4 Sustainability Push for Bio-based/recycled PET and PLA Filaments
- 4.2.5 AI-optimised High-speed Printing of PEEK/PEKK Aerospace Parts
- 4.3 Market Restraints
- 4.3.1 High Cap-ex for Industrial Printers and Post-processing
- 4.3.2 Mechanical/thermal Limits of Commodity PLA and ABS
- 4.3.3 PLA feed-stock Price Swings Linked to Climate-hit Corn Supply
- 4.4 Value Chain Analysis
- 4.5 Porter's Five Forces
- 4.5.1 Bargaining Power of Suppliers
- 4.5.2 Bargaining Power of Buyers
- 4.5.3 Threat of New Entrants
- 4.5.4 Threat of Substitutes
- 4.5.5 Degree of Competition
5 Market Size and Growth Forecasts (Value)
- 5.1 By Type
- 5.1.1 Metals
- 5.1.1.1 Titanium
- 5.1.1.2 Stainless Steel
- 5.1.1.3 Other Metals
- 5.1.2 Plastics
- 5.1.2.1 Polyethylene Terephthalate (PET)
- 5.1.2.2 Polylactic Acid (PLA)
- 5.1.2.3 Acrylonitrile Butadiene Styrene (ABS)
- 5.1.2.4 Nylon
- 5.1.2.5 Other Plastics
- 5.1.3 Ceramics
- 5.1.4 Other Types
- 5.1.1 Metals
- 5.2 By Application
- 5.2.1 Aerospace and Defense
- 5.2.2 Automotive
- 5.2.3 Medical and Dental
- 5.2.4 Electronics
- 5.2.5 Other Applications
- 5.3 By Geography
- 5.3.1 Asia-Pacific
- 5.3.1.1 China
- 5.3.1.2 India
- 5.3.1.3 Japan
- 5.3.1.4 South Korea
- 5.3.1.5 Australia
- 5.3.1.6 Malaysia
- 5.3.1.7 Thailand
- 5.3.1.8 Vietnam
- 5.3.1.9 Indonesia
- 5.3.1.10 Rest of Asia-Pacific
- 5.3.2 North America
- 5.3.2.1 United States
- 5.3.2.2 Canada
- 5.3.2.3 Mexico
- 5.3.3 Europe
- 5.3.3.1 Germany
- 5.3.3.2 United Kingdom
- 5.3.3.3 France
- 5.3.3.4 Italy
- 5.3.3.5 Spain
- 5.3.3.6 Russia
- 5.3.3.7 Nordics
- 5.3.3.8 Turkey
- 5.3.3.9 Rest of Europe
- 5.3.4 South America
- 5.3.4.1 Brazil
- 5.3.4.2 Argentina
- 5.3.4.3 Colombia
- 5.3.4.4 Rest of South America
- 5.3.5 Middle East and Africa
- 5.3.5.1 Saudi Arabia
- 5.3.5.2 United Arab Emirates
- 5.3.5.3 Qatar
- 5.3.5.4 South Africa
- 5.3.5.5 Nigeria
- 5.3.5.6 Egypt
- 5.3.5.7 Rest of Middle East and Africa
- 5.3.1 Asia-Pacific
6 Competitive Landscape
- 6.1 Market Concentration
- 6.2 Strategic Moves
- 6.3 Market Share (%)/Ranking Analysis
- 6.4 Company Profiles (includes Global level Overview, Market level overview, Core Segments, Financials as available, Strategic Information, Market Rank/Share, Products and Services, Recent Developments)
- 6.4.1 3DXTECH
- 6.4.2 Amolen
- 6.4.3 BASF
- 6.4.4 Braskem
- 6.4.5 Covestro AG
- 6.4.6 Evonik Industries AG
- 6.4.7 Fillamentum
- 6.4.8 Forward AM
- 6.4.9 Village Plastics
- 6.4.10 Markforged
- 6.4.11 Mitsubishi Chemical Group
- 6.4.12 NatureWorks LLC
- 6.4.13 Polymaker
- 6.4.14 SABIC
- 6.4.15 Shenzhen Esun Industrial Co., Ltd.
- 6.4.16 Solvay
- 6.4.17 Stratasys
7 Market Opportunities and Future Outlook
- 7.1 White-space and Unmet-Need Assessment
