
|
시장보고서
상품코드
1940766
미국의 소량 화물 운송(LTL) : 시장 점유율 분석, 업계 동향과 통계, 성장 예측(2026-2031년)United States Less Than-Truck-Load (LTL) - Market Share Analysis, Industry Trends & Statistics, Growth Forecasts (2026 - 2031) |
||||||
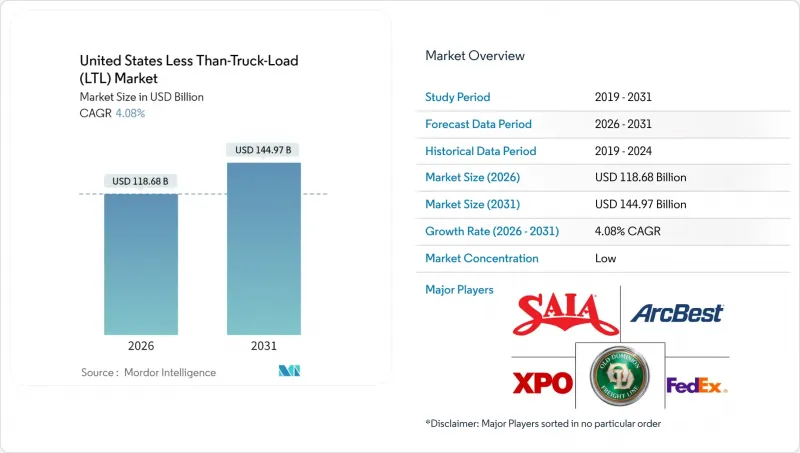
2026년 미국 소량 화물 운송(LTL) 시장 규모는 1,186억 8,000만 달러로 추정되며, 2025년 1,140억 3,000만 달러에서 성장이 전망됩니다.
2031년까지 1,449억 7,000만 달러에 달할 것으로 예상되며, 2026년부터 2031년까지 CAGR 4.08%로 확대될 것으로 전망됩니다.
E-Commerce 이행, 국내 제조의 회귀, 옴니 채널 소매 전략이 운송 형태를 재구성하는 한편, 주요 도시 터미널의 용량 제약으로 인해 로스 앤젤레스와 뉴저지 등의 시장에서는 창고 평균 임대료가 평방 피트 당 8 달러를 초과하고 있습니다. 운전자 부족에 따른 인건비 상승, 에너지 가격 변동, 옐로우 코퍼레이션의 2023년 철수 이후 업계 구조조정 가속화로 경쟁 환경이 심화되고 있으며, 지역 운송업체들이 파산관재인으로부터 해방된 터미널을 인수하려는 움직임이 가속화되고 있습니다. 인프라 투자 및 고용법(IIJA)에 따라 승인된 투자는 네트워크의 유동성을 높이기 위한 트럭 전용 차선 및 항만 시설 개선에 사용되지만, 동해안 및 멕시코만 지역의 노동 분쟁의 영향으로 화물 운송 경로가 주기적으로 변경되기 때문에 단기적인 서비스 신뢰성은 여전히 불안정합니다. 여전히 불안정합니다. 이러한 요인들이 복합적으로 작용하여 화주들이 운송 수단의 유연성, 세부적인 가시성, 기술을 활용한 가격 책정 모델을 중시하는 가운데 미국 소량화물(LTL) 시장의 회복력이 강화되고 있습니다.
미국 소량 화물 운송(LTL) 시장 동향과 인사이트
이커머스 풀필먼트의 성장
미국 소매 E-Commerce 매출은 2024년 1조 달러를 돌파할 것으로 예상되며, 소매업체들은 인구 밀집지역을 중심으로 1-2일 배송권 내에 재고를 배치하고 있습니다. 이러한 지리적 분산화로 인해 소량 배송망에 적합하지 않은 중량화물의 운송 빈도가 증가하여 미국 LTL 시장의 잠재 고객층이 확대되고 있습니다. PITT OHIO와 같은 운송업체는 인공지능을 활용한 노선 최적화를 통해 인건비를 25% 절감하고 서비스 제공 시간대를 엄격하게 하고 있습니다. 가구, 가전제품, 사무기기 등 주거용 배송은 전문적인 LTL 최종 마일 서비스를 이용하면 수익률이 높아지기 때문에 리프트게이트 설비와 화이트 글로브 대응 능력에 대한 지속적인 투자가 이루어지고 있습니다. 니어쇼어링과 관련된 크로스보더 EC는 멕시코산 제품이 북미 대도시권 배송존으로 유입되면서 취급량이 더욱 늘어날 것으로 보입니다. 소매업체들이 경쟁력 있는 가격으로 안정적인 2일 배송을 실현하기 위해 노력하는 가운데, 미국 LTL 시장은 2025년부터 2030년까지 옴니채널 대응 전략에 있어 필수적인 존재로 남을 것입니다.
리쇼어링이 주도하는 국내 제조업 회복
9,100억 달러가 넘는 연방정부의 산업 장려책은 자동차, 항공우주, 의료기기, 전자제품 생산의 국내 회귀를 촉진하고 있으며, 35번 주간 고속도로 연선 및 동종 간선도로에 활동이 집중되어 있습니다. 멕시코는 2024년 미국의 최대 무역 상대국으로 도약하고 있으며, 통관 서류 및 국경 운송에 정통한 LTL 운송업체에게 유리한 국경 간 트럭 운송량이 증가하고 있습니다. 애버릿의 샌안토니오 기지 확장(85,000평방피트, 80개의 크로스도크용 도어)은 이러한 급격한 증가를 포착하기 위한 자산 배치의 대표적인 예입니다. 인근 공장의 예측 가능한 부품 흐름은 운송 밀도를 향상시키고, 전략적으로 배치된 터미널을 보유한 운송업체에게 우수한 네트워크 경제성과 가격 협상력을 제공합니다. 그 결과, 미국의 소량화물 운송 시장은 태평양 횡단 혼란에 대한 내성을 갖춘 지역화 된 공급망에서 그 역할을 더욱 심화시키고 있습니다.
운전자 부족과 고령화되는 노동력
약물-알코올 검사 클리어링하우스 시행으로 최대 17만 7천 명의 운전자가 퇴출될 가능성이 있으며, 현재 운전자의 약 1/3이 정년퇴직 연령에 근접한 상황에서 유효 노동력이 감소할 우려가 있습니다. 운송업체들은 임금 인상으로 대응하고 있습니다(애버릿은 2025년 위험물 운송 운전자의 임금을 마일당 0.60달러에서 0.64달러로 인상할 예정입니다). 또한 이익의 20%를 직원 퇴직금 계좌에 적립하여 직원들의 정착률을 높이고 있습니다. 그러나 임금 상승은 영업비율을 높이고, 운송회사는 간선운송계획의 재검토, 적재율 향상, 차선유지시스템 등 운전보조기술의 도입으로 운전자의 경력 연장을 강요받고 있습니다. 건전한 화물 수급 환경에도 불구하고, 지속적인 채용난은 미국 소형 화물 운송 시장의 성장 궤도를 계속 압박하고 있습니다.
부문 분석
도매 및 소매업은 2025년 기준 미국 LTL 시장 규모의 34.56%를 차지하며, 2026년부터 2031년까지 CAGR 5.13%로 확대될 것으로 예상됩니다. 소매업이 소비지와 가까운 곳에서 재고를 조정하는 움직임이 가속화되고 있기 때문에 다른 모든 업종을 능가하는 성장률을 보이고 있습니다. 제조업은 여전히 두 번째로 기여도가 높은 분야로, 내륙 허브를 통해 북쪽으로 부품을 운송하는 니어쇼어링(Near-shoring)에 의해 뒷받침되고 있습니다. 건설, 농업, 에너지 분야는 계절에 따라 변동이 있지만, 이를 종합하면 2차 시장의 노선 밀도를 강화하여 그렇지 않으면 수송 능력의 불균형을 초래할 수 있는 2차 시장에서의 노선 밀도를 강화합니다.
소매 풀필먼트의 마이크로 풀필먼트와 다크 스토어 형태의 신속한 재보충 요구로 인해 중하중 화물은 트럭 적재나 소량 화물보다 LTL 운송을 더 자주 이용하고 있습니다. AI 강화형 수요 예측은 대형 체인의 재고 보유 비용을 줄였지만, 배송 빈도를 증가시키는 요인으로 작용하여 미국 LTL 시장을 확대시키고 있습니다. 제조업 화물, 특히 자동차 부품과 기계류는 남에서 북으로 가는 경로의 균형을 맞추고, 공차 주행거리를 줄이고, 네트워크 경제를 지원합니다. 따라서 미국 LTL 산업은 안정적인 수익구조를 유지하고 있으며, 수직적 다각화를 통해 섹터의 순환성을 완화하고 있습니다.
기타 특전:
- 엑셀 형식의 시장 예측(ME) 시트
- 애널리스트 지원(3개월)
자주 묻는 질문
목차
제1장 소개
제2장 조사 방법
제3장 주요 요약
제4장 시장 구도
제5장 시장 규모와 성장 예측
제6장 경쟁 구도
제7장 시장 기회와 향후 전망
KSM 26.03.10The United States Less than-Truck-Load market size in 2026 is estimated at USD 118.68 billion, growing from 2025 value of USD 114.03 billion with 2031 projections showing USD 144.97 billion, growing at 4.08% CAGR over 2026-2031.

E-commerce fulfillment, reshoring of domestic manufacturing, and omnichannel retail strategies are re-shaping shipment profiles, while capacity constraints in tier-1 metropolitan terminals have elevated average warehouse lease rates above USD 8 per square foot in markets such as Los Angeles and New Jersey. Rising labor costs linked to driver shortages, energy price volatility, and heightened consolidation following Yellow Corporation's 2023 exit are intensifying competitive dynamics and encouraging regional carriers to acquire terminals released by the bankruptcy estate. Investments authorized under the Infrastructure Investment and Jobs Act (IIJA) are earmarked for truck-only lanes and port upgrades that will enhance network fluidity, yet near-term service reliability remains sensitive to East and Gulf Coast labor disruptions that periodically reroute freight flows. Collectively, these factors reinforce the resilience of the United States Less than-Truck-Load market as shippers favor mode flexibility, granular visibility, and technology-enabled pricing models.
United States Less Than-Truck-Load (LTL) Market Trends and Insights
E-commerce Fulfillment Growth
United States retail e-commerce sales surpassed USD 1 trillion in 2024, prompting retailers to position inventory within one- to two-day ground zones around dense population centers. This geographic dispersion increases the frequency of medium-weight shipments unsuitable for parcel networks, thereby enlarging the addressable base of the United States Less than-Truck-Load market. Carriers such as PITT OHIO apply artificial-intelligence-driven route optimization to reduce labor costs by 25% and sharpen service windows. Residential deliveries of furniture, appliances, and office equipment yield higher margins when carried through specialized LTL final-mile services, encouraging ongoing investment in lift-gate equipment and white-glove capabilities. Cross-border e-commerce related to nearshoring further lifts volumes as Mexican-origin goods flow north into metropolitan delivery zones. As retailers seek consistent two-day performance at competitive rates, the United States Less than-Truck-Load market will remain integral to omnichannel fulfillment strategies across 2025-2030.
Reshoring-Led Domestic Manufacturing Rebound
Federal industrial incentives exceeding USD 910 billion stimulate the onshoring of automotive, aerospace, medical device, and electronics production, concentrating activity along the Interstate 35 corridor and similar arteries. Mexico ascended to the United States' top trading partner position in 2024, raising cross-border truck traffic that benefits LTL carriers adept at customs documentation and border drayage. Averitt's 85,000 ft2 San Antonio expansion featuring 80 cross-dock doors typifies asset deployment aimed at capturing this surge. Predictable component flows from nearshore plants allow density gains, translating into superior network economics and pricing leverage for carriers with strategically located terminals. The United States Less than-Truck-Load market consequently deepens its role in regionalized supply chains designed for resilience against trans-Pacific disruptions.
Driver Shortage and Aging Workforce
Drug and Alcohol Clearinghouse enforcement could remove up to 177,000 drivers, reducing the effective labor pool even as nearly one-third of current operators are near retirement age. Carriers counter by hiking pay-Averitt lifted hazmat driver rates from USD 0.60 to USD 0.64 per mile in 2025-and by channeling 20% of profits into employee retirement accounts to boost retention. Yet wage escalation inflates operating ratios, compelling carriers to refine linehaul planning, increase load factors, and introduce driver-assisting technology such as lane-keeping systems to lengthen career longevity. Persistent recruitment hurdles continue to weigh on the United States Less than-Truck-Load market growth trajectory despite healthy freight fundamentals.
Other drivers and restraints analyzed in the detailed report include:
- Omnichannel Retail Network Optimization
- Urban Retail Real-Estate Repurposed into Cross-Dock Micro-Hubs
- Acute Terminal-Capacity Constraints in Tier-1 Metros
For complete list of drivers and restraints, kindly check the Table Of Contents.
Segment Analysis
Wholesale and Retail Trade accounted for 34.56% of the United States less than-truck-load market size in 2025 and is advancing at a 5.13% CAGR between 2026-2031, outpacing every other vertical as retailers recalibrate inventory closer to consumption points. Manufacturing remains the second-largest contributor, buoyed by nearshoring that channels components northbound through inland hubs. Construction, Agriculture, and Energy add variability across seasons, yet together strengthen lane density in secondary markets where capacity would otherwise be imbalanced.
Retail fulfillment's requirement for rapid restocking of micro-fulfillment and dark-store formats means medium-weight loads ride LTL more often than truckload or parcel. AI-enhanced demand sensing has trimmed inventory carrying costs for large chains, yet it raises shipment frequency, a factor that ultimately expands the United States Less than-Truck-Load market. Manufacturing traffic, especially auto parts and machinery, keeps south-to-north routes balanced, reducing empty miles and undergirding network economics. The United States Less than-Truck-Load industry thus maintains a stable revenue mix, mitigating sector cyclicality through vertical diversification.
The United States Less Than-Truck-Load (LTL) Market Report is Segmented by End User Industry (Agriculture, Fishing, and Forestry, Construction, Manufacturing, Oil and Gas, Mining and Quarrying, Wholesale and Retail Trade, and Others), and Destination (Domestic and International). The Market Forecasts are Provided in Terms of Value (USD).
List of Companies Covered in this Report:
- A. Duie Pyle, Inc.
- ArcBest
- Averitt Express, Inc.
- C.H. Robinson
- Day & Ross
- Daylight Transport, LLC
- Dayton Freight Lines, Inc.
- DHL Group
- Estes Express Lines
- Fastfrate Inc.
- FedEx
- Knight-Swift Transportation Holdings Inc.
- Landstar System Inc.
- Oak Harbor Freight Lines, Inc.
- Old Dominion Freight Line
- Pitt Ohio Transportation Group
- R+L Carriers, Inc.
- Roadrunner Freight
- Saia Inc.
- Schneider National, Inc.
- Southeastern Freight Lines
- TFI International Inc.
- United Parcel Service of America, Inc. (UPS)
- Ward Transport and Logistics Corporation
- Werner Enterprises Inc.
- XPO, Inc.
Additional Benefits:
- The market estimate (ME) sheet in Excel format
- 3 months of analyst support
TABLE OF CONTENTS
1 Introduction
- 1.1 Study Assumptions and Market Definition
- 1.2 Scope of the Study
2 Research Methodology
3 Executive Summary
4 Market Landscape
- 4.1 Market Overview
- 4.2 GDP Distribution by Economic Activity
- 4.3 GDP Growth by Economic Activity
- 4.4 Economic Performance and Profile
- 4.4.1 Trends in E-Commerce Industry
- 4.4.2 Trends in Manufacturing Industry
- 4.5 Transport and Storage Sector GDP
- 4.6 Logistics Performance
- 4.7 Length of Roads
- 4.8 Export Trends
- 4.9 Import Trends
- 4.10 Fuel Pricing Trends
- 4.11 Trucking Operational Costs
- 4.12 Trucking Fleet Size by Type
- 4.13 Major Truck Suppliers
- 4.14 Road Freight Tonnage Trends
- 4.15 Road Freight Pricing Trends
- 4.16 Modal Share
- 4.17 Inflation
- 4.18 Regulatory Framework
- 4.19 Value Chain and Distribution Channel Analysis
- 4.20 Market Drivers
- 4.20.1 E-Commerce Fulfilment Growth
- 4.20.2 Reshoring-Led Domestic Manufacturing Rebound
- 4.20.3 Omnichannel Retail Network Optimisation
- 4.20.4 Urban Retail Real-Estate Repurposed into Cross-Dock Micro-Hubs
- 4.20.5 API-Enabled Parcel-To-LTL Mode Shift For SMB Shippers
- 4.20.6 Truck-Only Lane Investments Under the IIJA Boosting LTL Transit Reliability
- 4.21 Market Restraints
- 4.21.1 Driver Shortage and Ageing Workforce
- 4.21.2 Diesel-Price Volatility
- 4.21.3 Acute Terminal-Capacity Constraints in Tier-1 Metros
- 4.21.4 Warehouse Labour Unionisation Ripple-Effects
- 4.22 Technology Innovations in the Market
- 4.23 Porter's Five Forces Analysis
- 4.23.1 Threat of New Entrants
- 4.23.2 Bargaining Power of Buyers
- 4.23.3 Bargaining Power of Suppliers
- 4.23.4 Threat of Substitutes
- 4.23.5 Competitive Rivalry
5 Market Size and Growth Forecasts (Value, USD)
- 5.1 End User Industry
- 5.1.1 Agriculture, Fishing, and Forestry
- 5.1.2 Construction
- 5.1.3 Manufacturing
- 5.1.4 Oil and Gas, Mining and Quarrying
- 5.1.5 Wholesale and Retail Trade
- 5.1.6 Others
- 5.2 Destination
- 5.2.1 Domestic
- 5.2.2 International
6 Competitive Landscape
- 6.1 Market Concentration
- 6.2 Key Strategic Moves
- 6.3 Market Share Analysis
- 6.4 Company Profiles (Includes Global Level Overview, Market Level Overview, Core Segments, Financials as Available, Strategic Information, Market Rank/Share for Key Companies, Products and Services, and Recent Developments)
- 6.4.1 A. Duie Pyle, Inc.
- 6.4.2 ArcBest
- 6.4.3 Averitt Express, Inc.
- 6.4.4 C.H. Robinson
- 6.4.5 Day & Ross
- 6.4.6 Daylight Transport, LLC
- 6.4.7 Dayton Freight Lines, Inc.
- 6.4.8 DHL Group
- 6.4.9 Estes Express Lines
- 6.4.10 Fastfrate Inc.
- 6.4.11 FedEx
- 6.4.12 Knight-Swift Transportation Holdings Inc.
- 6.4.13 Landstar System Inc.
- 6.4.14 Oak Harbor Freight Lines, Inc.
- 6.4.15 Old Dominion Freight Line
- 6.4.16 Pitt Ohio Transportation Group
- 6.4.17 R+L Carriers, Inc.
- 6.4.18 Roadrunner Freight
- 6.4.19 Saia Inc.
- 6.4.20 Schneider National, Inc.
- 6.4.21 Southeastern Freight Lines
- 6.4.22 TFI International Inc.
- 6.4.23 United Parcel Service of America, Inc. (UPS)
- 6.4.24 Ward Transport and Logistics Corporation
- 6.4.25 Werner Enterprises Inc.
- 6.4.26 XPO, Inc.
7 Market Opportunities and Future Outlook
- 7.1 White-Space and Unmet-Need Assessment
