
|
시장보고서
상품코드
1940776
미국의 엔지니어링 서비스 : 시장 점유율 분석, 업계 동향과 통계, 성장 예측(2026-2031년)United States Engineering Services - Market Share Analysis, Industry Trends & Statistics, Growth Forecasts (2026 - 2031) |
||||||
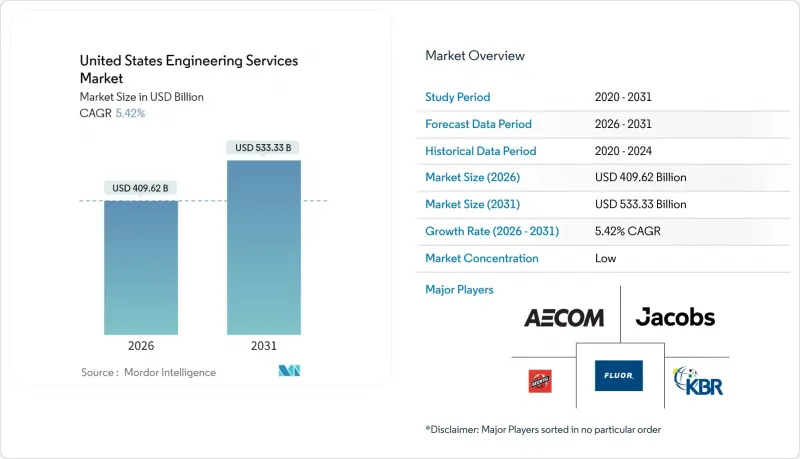
미국의 엔지니어링 서비스 시장은 2025년에 3,885억 6,000만 달러로 평가되었고, 2026년 4,096억 2,000만 달러에서 2031년까지 5,333억 3,000만 달러에 달할 것으로 예측됩니다.
예측 기간(2026-2031년)의 CAGR은 5.42%로 예상됩니다.

인프라 투자 및 일자리 창출법에 따른 연방 정부의 인프라 지출 가속화, CHIPS 및 과학법(CHIPS and Science Act)에 따른 반도체 산업에 대한 특혜, 그리고 지속적인 국방 현대화 예산은 고도의 엔지니어링 전문 지식이 필요한 복잡한 프로젝트의 다년간의 파이프라인을 뒷받침하고 있습니다. 또한, 제조업의 회귀, 전력망 현대화의 필요성, 손해를 줄이고 자산 관리 수익을 확대하는 디지털 트윈 워크플로우의 빠른 상용화로 인해 수요 패턴이 재편되고 있습니다. 특히 청정 에너지 시스템, 첨단 제조, AI를 활용한 설계 등 전문 역량을 확보하기 위한 인수로 경쟁 구도가 바뀌고 있습니다. 한편, 고객의 비용 압박은 통합형 EPCM 모델을 촉진하고 있습니다. 지역적 수요는 캘리포니아, 텍사스, 오대호 회랑, 그리고 재정적 인센티브, 낮은 토지 비용, 기업 친화적인 규제가 지속적인 자본 투입을 촉진하는 급성장하는 남동부 도시 지역에 집중되어 있습니다.
미국의 엔지니어링 서비스 시장 동향과 인사이트
2021년 IIJA에 따른 연방 인프라 자금의 급격한 증가
1조 2,000억 달러 규모의 IIJA는 주간 고속도로 시대 이후 연방정부의 물리적 자산에 대한 가장 적극적인 투자이며, 지반조사, 내재해형 수자원 시스템, 지능형 교통망 등 다분야에 걸친 업무로 인해 각 기관은 외부 전문가를 채용해야 하는 상황입니다. 주 교통국(DOT)은 2022년 이후 컨설팅 지출을 35% 증가시켰으며, '바이 아메리카' 조항으로 인해 공급망 재설계, 국내 조달품 검증, 상세한 문서화, 엔지니어링 컨설턴트에 대한 추가 보상을 의무화하고 있습니다. 자금 조달 가이드라인에 포함된 기후 변화 내성 요구 사항으로 인해 리스크 모델링, 라이프사이클 비용 분석, 자산 보강을 지원하는 디지털 트윈에 대한 수요가 증가하고 있습니다. 이러한 새로운 컴플라이언스 대응은 일정을 연장하는 동시에 프로젝트 당 수익을 증가시키고, 미국 50개 주 전역에 걸쳐 엔지니어링 서비스 시장을 확대하는 데 기여하고 있습니다.
반도체 팹 및 배터리 기가팩토리 건설 가속화
메가팹은 시설당 평균 150억-400억 달러가 소요되며, 초순수 유틸리티, 클래스 10-클래스 1 클린룸, 2마이크론 미만의 진동 격리 공차를 필요로 합니다. 이를 통해 기존 산업 프로젝트보다 20-30% 더 높은 프리미엄 단가를 책정할 수 있습니다. 인텔의 오하이오 캠퍼스와 TSMC의 애리조나 복합단지에서는 3-5년의 엔지니어링 계약에 이어 장기 운영 지원 계약이 포함되어 있습니다. 연방정부의 CHIPS 법에 따른 520억 달러 규모의 혜택은 이러한 자본 프로젝트의 리스크를 줄이고 전기, 기계, 공정 및 오염 관리 전문가를 위한 다주기 수주 기반을 구축할 것입니다. 테슬라, GM, 포드의 병렬 배터리 셀 공장 건설은 열 관리, 고전압 설계, 소방 설비 엔지니어링의 기회를 확대하여 미국의 엔지니어링 서비스 시장의 총 잠재적 수익을 확대할 것입니다.
강재-콘크리트 투입비용 변동 리스크
2023년부터 2025년까지 철강 가격은 연간 25-40%, 시멘트 및 레미콘은 15-20% 상승했습니다. 이로 인해 프로젝트 예산이 압박을 받아 범위 축소 위험이 증가하고 있습니다. 고정가격 계약은 기업의 이윤율 하락을 초래하고, 공공 부문 발주자의 입찰을 지연시키는 요인으로 작용하여 미국의 엔지니어링 서비스 시장의 단기 청구 가능 시간을 억제하고 있습니다. 비용 플러스 계약은 리스크를 줄일 수 있지만, 조달 장벽에 직면해 있습니다. 에스컬레이션 조항과 자재 지수가 확산되고 있지만, 불확실성이 여전히 설비투자 의욕을 억제하고 있어 CAGR 전망치를 하향 조정합니다.
부문 분석
토목 공학은 2025년 수익의 34.88%를 차지하며, IIJA(인프라 투자 및 고용법)의 자금 지원을 받는 교량 보수, 고속도로 확장, 재해에 강한 수자원 시스템에서 핵심적인 역할을 강조했습니다. 캘리포니아 고속철도, 게이트웨이 터널 등의 프로젝트는 내진 보강, 지반 공학 모델링, 터널 굴착 감독에 대한 수요를 증가시켜 미국의 엔지니어링 서비스 시장을 지탱하는 안정적인 수주 잔고를 확보했습니다. 설계수명 연장 요구 및 기후 변화 내성 기준 강화로 인해 설계 범위가 확대되고 청구 가능한 복잡성이 증가함에 따라 이 부문은 수혜를 받고 있습니다.
기계공학 분야는 반도체 공장, 배터리 공장, 하이퍼스케일 데이터센터의 클린룸 공조 설비, 고밀도 열 관리, 로봇 통합에 대한 수요로 인해 가장 빠르게 발전하고 있습니다. 전력망 현대화 및 EV 충전 회랑의 정비, 릴레이 보호 장치, 중전압 설계, 스마트 미터 분석 서비스 수요를 견인하는 전기 공학 분야도 마찬가지로 활발합니다. 환경공학은 복원 기술에서 기후 리스크 모델링, 탄소 포집 시스템, ESG 컴플라이언스까지 확장하여 표준 토목 범위에 추가되는 프리미엄 서비스를 제공합니다. 화학공학은 반도체 에칭 공정, 첨단 제약 라인, 특수 소재 등 틈새 시장이지만 수익성이 높은 분야로, 미국 전체 엔지니어링 서비스 시장의 평균 시간당 단가를 끌어올리는 역할을 하고 있습니다.
컨설팅 및 설계 분야는 BIM 조정, 공급망 현지화, 탄력성 계획의 프론트엔드 전문 지식에 대한 수요 증가로 인해 2025년 시장 수익의 17.76%를 차지할 것으로 예측됩니다. 클라우드 호스트형 공통 데이터 환경과 AI 지원 코드 점검을 포함한 디지털 퍼스트(Digital First) 방식의 납품은 리턴을 줄이고 가치를 업스트림 공정으로 이전함으로써 미국의 엔지니어링 서비스 시장에서 이 부문의 선도적 지위를 강화하고 있습니다.
공정 플랜트 엔지니어링은 초순수 시스템, 불활성 가스 시스템, 로봇에 의한 라인 밸런싱 등 고도의 전문성이 요구되는 메가팹 및 기가팩토리 프로젝트가 진행되면서 괄목할 만한 성장을 기록했습니다. 자동화 및 디지털 엔지니어링 서비스는 이 부문에서 가장 높은 CAGR을 나타낼 것으로 예측됩니다. 센서 통합, 엣지 애널리틱스, 디지털 트윈을 연계하고 시운전 후 최적화를 통해 수익을 창출하는 것이 특징입니다. 자산관리 서비스는 성과 기반 데이터 구독 모델로 진화하여 지속적인 현금 흐름을 창출함으로써 미국의 엔지니어링 서비스 산업 전반의 매출 안정화에 기여하고 있습니다.
기타 특전:
- 엑셀 형식 시장 예측(ME) 시트
- 애널리스트 지원(3개월)
자주 묻는 질문
목차
제1장 서론
제2장 조사 방법
제3장 주요 요약
제4장 시장 구도
제5장 시장 규모와 성장 예측
제6장 경쟁 구도
제7장 시장 기회와 향후 전망
LSH 26.03.10The U.S. engineering services market was valued at USD 388.56 billion in 2025 and estimated to grow from USD 409.62 billion in 2026 to reach USD 533.33 billion by 2031, at a CAGR of 5.42% during the forecast period (2026-2031).
Accelerated federal infrastructure outlays under the Infrastructure Investment and Jobs Act, the CHIPS and Science Act's semiconductor incentives, and persistent defense-modernization budgets are sustaining a multi-year pipeline of complex projects that require deeper engineering expertise. Demand patterns are also being reshaped by manufacturing reshoring, grid-modernization imperatives, and the rapid commercialization of digital-twin workflows that cut rework and expand lifetime asset-management revenues. Competitive behavior is shifting toward acquisitions aimed at specialty capabilities-especially in clean-energy systems, advanced manufacturing, and AI-enabled design-while clients' cost pressures are encouraging integrated EPCM models. Regional demand is clustering around California, Texas, the Great Lakes corridor, and fast-growing Southeast metros where fiscal incentives, lower land costs, and pro-business regulation encourage sustained capital deployment.
United States Engineering Services Market Trends and Insights
Federal Infrastructure-Funding Boom Under 2021 IIJA
The USD 1.2 trillion IIJA marks the most aggressive federal commitment to physical assets since the Interstate Highway era, forcing agencies to hire external specialists for multi-disciplinary tasks that span geotechnical studies, resilient water systems, and intelligent-transportation networks. State DOTs have lifted consulting outlays by 35% since 2022, and Buy America clauses are compelling redesigns of supply chains, validation of domestic inputs, and extensive documentation, which add incremental fee layers for engineering consultants. Climate-resilience mandates embedded in funding guidelines are intensifying demand for risk-modeling, life-cycle cost analysis, and digital-twins that support asset hardening. These new compliance steps elongate schedules but expand revenue-per-project, expanding the U.S. engineering services market across all 50 states.
Accelerating Chip-Fab and Battery-Gigafactory Build-outs
Mega-fabs average USD 15-40 billion each, require ultra-pure utilities, class-10 to class-1 cleanrooms, and incorporate vibration isolation tolerances below two microns, driving premium bill rates that exceed traditional industrial projects by 20-30%. Intel's Ohio campus and TSMC's Arizona complex embed three-to-five-year engineering engagements, followed by long-term operations support contracts. Federal CHIPS incentives worth USD 52 billion de-risk these capital projects and underpin a multi-cycle orderbook for electrical, mechanical, process, and contamination-control specialists. Parallel battery-cell facilities from Tesla, GM, and Ford elevate opportunities in thermal-management, high-voltage design, and fire-suppression engineering, broadening total addressable revenues inside the U.S. engineering services market.
Volatile Steel and Concrete Input-Cost Pass-Through Risks
Steel prices fluctuated 25-40% annually during 2023-2025, while cement and ready-mix concrete rose 15-20%, squeezing project budgets and elevating risk of scope reduction. Fixed-price contracts thus expose firms to margin erosion and cause public-sector owners to delay bids, suppressing near-term billable hours in the U.S. engineering services market. Cost-plus agreements mitigate exposure yet face procurement hurdles. Escalation clauses and material indexes are gaining traction, but uncertainty still dampens CAPEX confidence, trimming the CAGR projection.
Other drivers and restraints analyzed in the detailed report include:
- Near-shoring of Manufacturing Lines to the U.S.
- Record-High Utility-Scale Solar and Wind Interconnection Queues
- Lengthy NEPA Environmental Reviews Delaying Starts
For complete list of drivers and restraints, kindly check the Table Of Contents.
Segment Analysis
Civil engineering captured 34.88% of 2025 revenue, underscoring its pivotal role in the bridge rehabilitation, highway expansion, and resilient water systems funded by the IIJA. Projects such as California's high-speed rail and the Gateway Tunnel boosted demand for seismic retrofits, geotechnical modeling, and tunnel-boring oversight, ensuring a steady backlog that underpins the U.S. engineering services market. The segment benefits from increasing design-life requirements and climate-resilience standards that extend scoping phases and raise billable complexity.
Mechanical engineering is the fastest-advancing discipline due to semiconductor fabs, battery plants, and hyperscale data centers that require cleanroom HVAC, high-density thermal-management, and robotics integration. Electrical engineering demand is equally brisk, spurred by grid-modernization and EV charging corridors, pulling in relay-protection, medium-voltage design, and smart-meter analytics services. Environmental engineering has expanded beyond remediation into climate-risk modeling, carbon-capture systems, and ESG compliance, adding premium services that tack onto standard civil scopes. Chemical engineering remains a niche yet lucrative field for semiconductor etching processes, advanced pharmaceutical lines, and specialty materials, lifting average hourly rates across the U.S. engineering services market.
Consulting and design captured 17.76% of market revenue in 2025, driven by owners' desire for front-end expertise in BIM coordination, supply-chain localization, and resiliency planning. Digital-first delivery, including cloud-hosted common data environments and AI-assisted code checks, is reducing rework and shifting value upstream, reinforcing the segment's lead position in the U.S. engineering services market.
Process-and-plant engineering recorded outsized growth through mega-fab and gigafactory projects, where ultra-pure water, inert-gas systems, and robotic line-balancing demand deep specialty knowledge. Automation and digital-engineering services represent the highest CAGR outlook in the segment, linking sensor integration, edge analytics, and digital-twins that monetize post-commissioning optimization. Asset-management services are evolving into performance-based, data-subscription models that generate recurring cash flows, stabilizing top-line trajectories across the U.S. engineering services industry.
The United States Engineering Services Market Report is Segmented by Application (Civil, Mechanical, and More), Service Type (Consulting and Design, Process and Plant Engineering, and More), End-User Industry (Construction and Infrastructure, Oil and Gas, and More), Engagement Model (In-House, Outsourced / EPCM). The Market Forecasts are Provided in Terms of Value (USD).
List of Companies Covered in this Report:
- AECOM
- Jacobs Engineering Group
- Bechtel Corporation
- Fluor Corporation
- KBR Inc.
- HDR Inc.
- Terracon
- Black and Veatch
- Jensen Hughes
- ECS Group of Companies
- WSP USA
- Tetra Tech
- STV Group
- Arup (US)
- Gannett Fleming
- Burns and McDonnell
- HNTB Corporation
- Parsons Corporation
- Louis Berger (WSP)
- AtkinsRealis (U.S.)
Additional Benefits:
- The market estimate (ME) sheet in Excel format
- 3 months of analyst support
TABLE OF CONTENTS
1 INTRODUCTION
- 1.1 Study Assumptions and Market Definition
- 1.2 Scope of the Study
2 RESEARCH METHODOLOGY
3 EXECUTIVE SUMMARY
4 MARKET LANDSCAPE
- 4.1 Market Overview
- 4.2 Market Drivers
- 4.2.1 Federal Infrastructure-Funding Boom under 2021 IIJA
- 4.2.2 Accelerating Chip Fabs and Battery Gigafactory Build-outs
- 4.2.3 Near-shoring of Manufacturing Lines to the U.S.
- 4.2.4 Record-High Utility-Scale Solar and Wind Interconnection Queues
- 4.2.5 Defense Modernization (AUKUS, NGAD) Driving Specialized Design
- 4.2.6 AI-Enabled Digital-Twin Adoption Cutting Re-work
- 4.3 Market Restraints
- 4.3.1 Volatile Steel and Concrete Input-Cost Pass-Through Risks
- 4.3.2 Lengthy NEPA Environmental Reviews Delaying Starts
- 4.3.3 Skilled-Labor Shortages Inflating Billing Rates
- 4.3.4 State-by-State Licensing Variances Hindering Scale
- 4.4 Value / Supply-Chain Analysis
- 4.5 Regulatory and Technological Outlook
- 4.6 Porter's Five Forces
- 4.6.1 Bargaining Power of Buyers/Consumers
- 4.6.2 Bargaining Power of Suppliers
- 4.6.3 Threat of New Entrants
- 4.6.4 Threat of Substitute Products
- 4.6.5 Intensity of Competitive Rivalry
- 4.7 Comparative Analysis: In-house vs Outsourced Engineering
- 4.8 Vendor Service Innovation Trends
5 MARKET SIZE AND GROWTH FORECASTS (VALUE)
- 5.1 By Application
- 5.1.1 Civil
- 5.1.2 Mechanical
- 5.1.3 Electrical
- 5.1.4 Environmental
- 5.1.5 Chemical
- 5.2 By Service Type
- 5.2.1 Consulting and Design
- 5.2.2 Process and Plant Engineering
- 5.2.3 Product Engineering and Prototyping
- 5.2.4 Automation / Digital Engineering
- 5.2.5 Asset Management and OandM
- 5.3 By End-user Industry
- 5.3.1 Construction and Infrastructure
- 5.3.2 Oil and Gas
- 5.3.3 Manufacturing
- 5.3.4 Utilities (Power, Water)
- 5.3.5 Transportation (Rail, Airports, Ports)
- 5.3.6 Telecommunications and Data Centers
- 5.3.7 Healthcare Facilities
- 5.4 By Engagement Model
- 5.4.1 In-house
- 5.4.2 Outsourced / EPCM
6 COMPETITIVE LANDSCAPE
- 6.1 Market Concentration
- 6.2 Strategic Moves
- 6.3 Market Share Analysis
- 6.4 Company Profiles
- 6.4.1 AECOM
- 6.4.2 Jacobs Engineering Group
- 6.4.3 Bechtel Corporation
- 6.4.4 Fluor Corporation
- 6.4.5 KBR Inc.
- 6.4.6 HDR Inc.
- 6.4.7 Terracon
- 6.4.8 Black and Veatch
- 6.4.9 Jensen Hughes
- 6.4.10 ECS Group of Companies
- 6.4.11 WSP USA
- 6.4.12 Tetra Tech
- 6.4.13 STV Group
- 6.4.14 Arup (US)
- 6.4.15 Gannett Fleming
- 6.4.16 Burns and McDonnell
- 6.4.17 HNTB Corporation
- 6.4.18 Parsons Corporation
- 6.4.19 Louis Berger (WSP)
- 6.4.20 AtkinsRealis (U.S.)
7 MARKET OPPORTUNITIES AND FUTURE OUTLOOK
- 7.1 White-space and Unmet-Need Assessment
