|
시장보고서
상품코드
2035038
데이터센터 시장 : 점유율 분석, 업계 동향 및 통계, 성장 예측(2026-2031년)Data Center - Market Share Analysis, Industry Trends & Statistics, Growth Forecasts (2026 - 2031) |
||||||
 Mordor Intelligence
데이터센터 시장 규모는 2025년에 3,867억 1,000만 달러로 평가되었고 예측 기간(2026-2031년)에 CAGR 9.98%로 확대되어 2026년 4,253억 달러에서 2031년에는 6,843억 9,000만 달러에 이를 것으로 추정되고 있습니다.
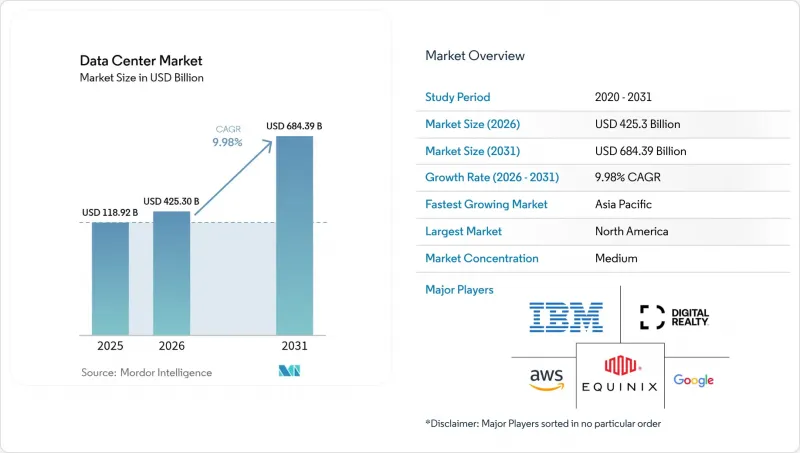
설치 기반 측면에서 시장은 2025년 118,920MW에서 2030년까지 24,050MW로 확대될 것으로 예상되며, 예측 기간(2025-2030년) 동안 15.08%의 연평균 복합 성장률(CAGR)을 보일 것으로 예측됩니다. 시장 세분화의 점유율 및 예측치는 MW 단위로 계산되어 보고됩니다. 이러한 성장 궤적은 급증하는 인공지능(AI) 워크로드, 엣지 노드의 급속한 확산, 디지털 인프라의 경제성을 변화시키고 있는 자본 집약적인 하이퍼스케일 캠퍼스 등을 반영하고 있습니다. 엔터프라이즈 컴퓨팅은 액체 냉각이 필요한 고밀도 랙으로 이동하고 있으며, 전력 조달이 사이트 선정의 결정적인 요소로 떠오르고 있습니다. 대규모 저탄소 전력을 확보할 수 있는 사업자는 특히 금융 서비스 및 생성형 AI를 이용하는 테넌트 수요를 크게 확보할 수 있습니다. 데이터 거주지 및 탄소 보고에 대한 규제 당국의 관심이 높아짐에 따라 신규 용량은 2차 도시 지역과 재생 에너지가 풍부한 지역으로 이동하고 있으며, 전체 데이터센터 시장에서 지리적 분산이 확대되고 있습니다.
세계 데이터센터 시장 동향 및 인사이트
AI 및 GPU 집약적 워크로드의 폭발적인 증가 추세
대규모 언어 모델 훈련 클러스터가 급증함에 따라 랙 밀도는 8-12kW에서 120kW로 증가했습니다. 각 사업자들은 액체냉각과 침지냉각을 표준화하고, 전용 변전소를 설치하며, 수 기가와트 규모의 확장이 가능한 캠퍼스 규모의 사이트를 설계하고 있습니다. AI에 최적화된 용량을 위한 아마존의 1,500억 달러에 달하는 설비 투자 약속은 현재 필요한 전력과 부동산의 규모를 실감할 수 있습니다. 저지연 및 고밀도 전력 공급과 내결함성 냉각 아키텍처를 결합한 서비스를 제공할 수 있는 공급자에게 경쟁 우위가 생겨나면서 데이터센터 시장 전반의 통합 추세가 강화되고 있습니다.
클라우드와 디지털 전환의 급속한 확산
기업들은 리프트 앤 시프트(lift-and-shift) 방식에서 분산 처리에 의존하는 클라우드 네이티브 마이크로 서비스로 전환하고 있습니다. 금융기관들은 결제 및 사기 감지 플랫폼을 현대화하고 있으며, 여러 클라우드 온램프에 연결된 캐리어 중립적인 코로케이션에 대한 지속적인 수요를 창출하고 있습니다. 신흥국의 데이터 프라이버시 규제는 현지 시설 확장을 촉진하고 있으며, 하이브리드 클라우드 전략은 데이터센터 시장 전체에서 상호 연결 옵션을 유지하기 위해 코로케이션 계약 기간을 연장하고 있습니다.
전력 부족과 전기요금 폭등
송전망의 제약으로 인해 용량이 부족한 지역에서는 상호접속 승인이 3년 이상 지연되고 있습니다. 전력회사는 대량의 전력을 소비하는 캠퍼스에 대응하기 위해 변전소를 신속하게 업그레이드하는 데 어려움을 겪고 있으며, 피크 시간대 요금 체계가 사업자의 수익률을 압박하고 있습니다. 개발업체들은 현장 발전, 축전지, 재생에너지 및 소형모듈로(SMR) 용량에 대한 전력구매계약(PPA)을 통해 대응하고 있지만, 리드타임과 규제 당국의 인증은 여전히 데이터센터 시장 전체에 큰 장애물로 작용하고 있습니다.
부문 분석
일반적으로 10-50MW 규모의 중규모 사이트는 2025년 수익의 60.10%를 대규모 캠퍼스가 차지했음에도 불구하고, 2031년까지 예측에서 가장 높은 CAGR 12.08%를 기록했습니다. 이 시설은 AI 클러스터가 요구하는 고밀도 랙과 빠른 배포의 균형을 이루고 있으며, 확장성이 있으면서도 유연한 설치 공간을 필요로 하는 클라우드 및 핀테크 기업 테넌트에게 매력적입니다. 이 부문의 성장은 데이터센터 시장 전체에서 적정 규모의 용량 노드로의 구조적 전환이 진행되고 있음을 보여줍니다.
이러한 모멘텀은 액체 냉각 랙, 현장 배터리 저장소, 재생에너지 마이크로그리드를 통합한 전용 설계 캠퍼스를 통해 더욱 강화되고 있으며, 이를 통해 사업자는 전력 밀도를 희생하지 않고도 지속가능성 목표를 달성할 수 있게 됩니다. 하이퍼스케일 기업들이 전력망의 제약을 완화하기 위해 부지 선정의 다양화를 꾀하는 가운데, 중규모 시설은 확장 옵션을 유지하면서 데이터센터 시장에서 수익화까지의 시간을 단축할 수 있는 잠정적인 해결책을 제공합니다.
2025년 지출의 59.10%를 차지한 Tier 3는 2031년까지 연평균 성장률(CAGR)이 14.31%로 Tier 4의 수익이 Tier 3를 능가할 것으로 예측됩니다. 알고리즘 트레이딩, 디지털 뱅킹, AI 모델 훈련에 있어 제로 다운타임 요구사항은 2N+1 리던던던시와 관련된 25%의 설비투자 프리미엄을 정당화할 수 있습니다. 이러한 사양은 진입 장벽을 높이고 고가용성 구축에 대한 자금 조달 능력을 갖춘 공급자에게 수요를 집중시킴으로써 데이터센터 시장 규모 계층에서 Tier 4로 점유율이 이동하게 될 것입니다.
신흥국에서는 국가 결제 시스템 및 소버린 AI 워크로드에 대한 내결함성 인프라를 의무화하는 새로운 규제가 도입되면서 특히 성장세가 두드러지고 있습니다. Tier 4 인증을 조기에 획득한 사업자들은 기업들이 미션 크리티컬한 용도를 데이터센터 시장 내 인증된 시설로 이전하는 과정에서 압도적인 가격 결정력을 누리며 강력한 경쟁 우위를 확보할 수 있습니다.
본 데이터센터 시장 보고서는 데이터센터 규모(대규모, 초대형, 중대형, 중형, 메가, 소형), 계층 유형(Tier 1 및 2, Tier 3, Tier 4), 데이터센터 유형(하이퍼스케일/자체 구축, 엔터프라이즈/엣지, 코로케이션), 최종 사용자(은행, 금융서비스 및 보험(BFSI), IT 및 ITES, E-커머스, 정부, 제조, 미디어-엔터테인먼트, 통신, 기타), 지역별로 구분하여 조사하였습니다. 시장 예측은 IT 부하 용량(MW) 단위로 제공됩니다.
지역별 분석
북미는 버지니아 북부, 댈러스, 피닉스 주변의 성숙한 하이퍼스케일 생태계를 배경으로 2025년 35.10%의 점유율을 유지했습니다. 지역 전력회사의 28억 2,000만 달러 투자 등 송전망 업그레이드는 새로운 메가와트급 공급 슬롯을 개척하기 위해 노력하고 있지만, 일부 하위 시장에서는 여전히 상호 연결 대기 시간이 3년을 초과하고 있습니다. 사업자들은 재생에너지가 풍부한 오하이오, 미주리, 캐나다로 사업 거점을 확장하고 있으며, 이를 통해 데이터센터 시장 내 향후 확장이 더 넓은 지역으로 확대될 것으로 예상하고 있습니다.
아시아태평양은 국가 주도의 AI 이니셔티브, 전자상거래 확산, 데이터 현지화 관련 법규에 힘입어 연평균 11.34%의 가장 높은 성장률을 나타낼 것으로 예측됩니다. 인도의 코로케이션 시설 규모는 지난 18개월 동안 약 1GW로 두 배로 증가했으며, 자카르타, 쿠알라룸푸르, 오사카의 경우 설치 용량이 300MW를 넘어섰습니다. 개인 데이터의 국내 저장을 우선시하는 국가 정책과 재생에너지 조달에 대한 인센티브는 외국인 직접투자를 지속적으로 유치하고 있으며, 데이터센터 시장 수요 증가의 중심지로서 이 지역의 입지를 더욱 공고히 하고 있습니다.
유럽, 중동, 아프리카에서는 상황이 다르게 나타나고 있습니다. 유럽의 주요 허브는 부지와 전력의 제약에 직면하고 있으며, 개발의 초점이 마드리드, 밀라노, 바르샤바 등으로 이동하고 있습니다. 동시에 아라곤 주와 같이 재생에너지가 풍부한 지역에서는 국제적인 사업자가 자금을 지원하는 300MW 규모의 프로젝트를 포함하여 기가급 규모의 캠퍼스를 유치하고 있습니다. 걸프 국가들은 저탄소 전력 및 디지털 추진 정책을 활용하여 하이퍼스케일 시설 건설을 확보하고 있으며, 아프리카의 주요 도시들은 새로운 해저 케이블의 상륙과 함께 용량을 확보하여 데이터센터 시장을 형성하는 세계 클라우드 기반에 대륙을 점차 통합하고 있습니다.
기타 특전:
- 엑셀 형식 시장 예측(ME) 시트
- 3개월간 애널리스트 지원
자주 묻는 질문
목차
제1장 서론
제2장 조사 방법
제3장 주요 요약
제4장 시장 구도
제5장 시장 규모와 성장 예측(MW)
제6장 경쟁 구도
제7장 시장 기회와 향후 전망
JHS 26.05.20The Data Center Market size was valued at USD 386.71 billion in 2025 and estimated to grow from USD 425.3 billion in 2026 to reach USD 684.39 billion by 2031, at a CAGR of 9.98% during the forecast period (2026-2031).
In terms of installed base, the market is expected to grow from 118.92 thousand megawatt in 2025 to 240.05 thousand megawatt by 2030, at a CAGR of 15.08% during the forecast period (2025-2030). The market segment shares and estimates are calculated and reported in terms of MW. This trajectory reflects surging artificial-intelligence workloads, the rapid build-out of edge nodes, and capital-intensive hyperscale campuses that are transforming digital infrastructure economics. Enterprise computing is migrating toward high-density racks that require liquid cooling, while power procurement is emerging as the decisive site-selection variable. Operators able to secure low-carbon electricity at scale are capturing outsized demand, especially from financial-services and generative-AI tenants. Heightened regulatory focus on data residency and carbon reporting is steering new capacity toward secondary metros and renewable-rich regions, widening geographic dispersion across the data center market.
Global Data Center Market Trends and Insights
AI and GPU-Intensive Workloads Explosion
Rack densities are escalating from 8-12 kW toward 120 kW as training clusters for large-language models proliferate. Operators are standardizing liquid and immersion cooling, installing dedicated substations, and designing campus-scale sites capable of multi-gigawatt expansion. Capital-spending commitments such as Amazon's USD 150 billion, targeted at AI-optimized capacity, illustrate the scale of electricity and real estate now required Competitive advantage accrues to providers that can deliver low-latency, high-density power coupled with fault-tolerant cooling architectures, reinforcing consolidation trends across the data center market.
Rapid Cloud and Digital-Transformation Adoption
Enterprises have shifted from lift-and-shift migrations to cloud-native microservices that rely on distributed processing. Financial institutions are modernizing payment and fraud-detection platforms, generating sustained demand for carrier-neutral colocation connected to multiple cloud on-ramps. Data-privacy mandates in emerging economies are stimulating local build-outs, while hybrid-cloud strategies are lengthening colocation contract terms to preserve interconnection optionality across the data center market.
Grid Power Shortages and Rising Electricity Costs
Transmission constraints are delaying interconnection approvals beyond three years in capacity-congested regions. Utilities struggle to upgrade substations fast enough to serve megawatt-hungry campuses, and peak-hour tariffs are compressing operator margins. Developers are responding with on-site generation, battery storage, and power-purchase agreements for renewable and small-modular-reactor capacity, yet lead times and regulatory certification remain formidable obstacles across the data center market.
Other drivers and restraints analyzed in the detailed report include:
- Edge and 5G Low-Latency Demand Wave
- Submarine-Cable Build-Out Unlocks Secondary Coasts
- Land and Permitting Bottlenecks in Tier-1 Hubs
For complete list of drivers and restraints, kindly check the Table Of Contents.
Segment Analysis
Medium-sized sites, generally 10-50 MW, accounted for the fastest 12.08% CAGR forecast through 2031 even though large campuses maintained 60.10% of 2025 revenue. These facilities balance rapid deployment with the high-density racks demanded by AI clusters, making them attractive to cloud and FinTech tenants that require scalable but flexible footprints. The segment's growth underscores a structural pivot toward right-sized capacity nodes throughout the data center market size landscape.
This momentum is reinforced by purpose-built campuses that integrate liquid-cooled racks, on-site battery storage, and renewable microgrids, enabling operators to meet sustainability targets without sacrificing power density. As hyperscale companies diversify site selection to mitigate grid constraints, medium facilities provide an interim solution that preserves expansion optionality and accelerates time to revenue in the data center market.
Tier 4 revenues are projected to outpace Tier 3 with a 14.31% CAGR to 2031 even though Tier 3 captured 59.10% of 2025 spending. Zero-downtime requirements for algorithmic trading, digital banking, and AI model training justify the 25% capital-expenditure premium associated with 2N+1 redundancy. These specifications lift barriers to entry and concentrate demand among providers capable of financing high-availability builds, thereby shifting share toward Tier 4 within the data center market size hierarchy.
Growth is especially strong in emerging economies where newly issued regulations demand fault-tolerant infrastructure for national payment systems and sovereign-AI workloads. Operators gaining early Tier 4 accreditation enjoy outsized pricing power and establish durable competitive moats as enterprises migrate mission-critical applications to certified facilities inside the data center market.
The Data Center Market Report is Segmented by Data Center Size (Large, Massive, Medium, Mega, and Small), Tier Type (Tier 1 and 2, Tier 3, and Tier 4), Data Center Type (Hyperscale/Self-built, Enterprise/Edge, and Colocation), End User (BFSI, IT and ITES, E-Commerce, Government, Manufacturing, Media and Entertainment, Telecom, and More), and Geography. The Market Forecasts are Provided in Terms of IT Load Capacity (MW).
Geography Analysis
North America preserved 35.10% 2025 share on the strength of mature hyperscale ecosystems around Northern Virginia, Dallas, and Phoenix. Transmission upgrades, such as a USD 2.82 billion commitment by regional utilities, aim to unlock new megawatt blocks, yet interconnection queues still exceed three years in some submarkets. Operators are extending footprints into Ohio, Missouri, and Canadian provinces rich in renewables, thereby spreading future additions across a wider geography within the data center market.
Asia-Pacific exhibits the fastest 11.34% CAGR outlook, fueled by sovereign-AI ambitions, e-commerce adoption, and data-localization statutes. India's colocation footprint doubled to roughly 1 GW over the past 18 months, while Jakarta, Kuala Lumpur, and Osaka each surpassed 300 MW installed. National policies prioritizing domestic storage of personal data and incentives for renewable power procurement continue to draw foreign direct investment, reinforcing the region's position as the epicenter of incremental demand in the data center market.
Europe, Middle East, and Africa display mixed dynamics. Core European hubs confront land and power constraints, redirecting development toward Madrid, Milan, and Warsaw. Simultaneously, renewable-rich regions such as Aragon are attracting giga-scale campuses, including a 300 MW commitment financed by international operators. Gulf states leverage low-carbon power and pro-digital agendas to win hyperscale builds, while African metros secure capacity alongside new submarine cable landings, gradually knitting the continent into global cloud fabrics shaping the data center market.
List of Companies Covered in this Report:
- Amazon Web Services, Inc.
- Google Inc.
- Microsoft Corporation
- Digital Realty Trust, Inc.
- CloudHQ
- CyrusOne
- Digital Bridge (Formely known as Switch)
- Stack Infrastructure
- QTS Realty Trust, LLC
- Quality Technology Services
- Equinix Inc
- Chindata Group Holdings Ltd
- Menlo Equities LLC
- Alibaba Cloud
- IBM Corporation
Additional Benefits:
- The market estimate (ME) sheet in Excel format
- 3 months of analyst support
TABLE OF CONTENTS
1 INTRODUCTION
- 1.1 Study Assumptions and Market Definition
- 1.2 Scope of the Study
2 RESEARCH METHODOLOGY
3 EXECUTIVE SUMMARY
4 MARKET LANDSCAPE
- 4.1 Market Overview
- 4.2 Market Drivers
- 4.2.1 AI and GPU-Intensive Workloads Explosion
- 4.2.2 Rapid Cloud and Digital-Transformation Adoption
- 4.2.3 Edge and 5G Low-Latency Demand Wave
- 4.2.4 Submarine-Cable Build-Out Unlocks Secondary Coasts
- 4.2.5 On-Site SMR Power PPA Models
- 4.2.6 Carbon-Credit Retrofits in Emerging Markets
- 4.3 Market Restraints
- 4.3.1 Grid Power Shortages and Rising Electricity Costs
- 4.3.2 Land and Permitting Bottlenecks in Tier-1 Hubs
- 4.3.3 Export Controls on Advanced Accelerators
- 4.3.4 Transformer and Switchgear Lead-Time Inflation
- 4.4 Market Outlook
- 4.4.1 IT Load Capacity
- 4.4.2 Raised Floor Space
- 4.4.3 Colocation Revenue
- 4.4.4 Installed Racks
- 4.4.5 Rack Space Utilization
- 4.4.6 Submarine Cable
- 4.5 Key Industry Trends
- 4.5.1 Smartphone Users
- 4.5.2 Data Traffic Per Smartphone
- 4.5.3 Mobile Data Speed
- 4.5.4 Broadband Data Speed
- 4.5.5 Fiber Connectivity Network
- 4.5.6 Regulatory Framework
- 4.6 Value Chain and Distribution Channel Analysis
- 4.7 Porter's Five Forces Analysis
- 4.7.1 Threat of New Entrants
- 4.7.2 Bargaining Power of Buyers
- 4.7.3 Bargaining Power of Suppliers
- 4.7.4 Threat of Substitutes
- 4.7.5 Intensity of Competitive Rivalry
5 MARKET SIZE AND GROWTH FORECASTS (MW)
- 5.1 By Data Center Size
- 5.1.1 Large
- 5.1.2 Massive
- 5.1.3 Medium
- 5.1.4 Mega
- 5.1.5 Small
- 5.2 By Tier Type
- 5.2.1 Tier 1 and 2
- 5.2.2 Tier 3
- 5.2.3 Tier 4
- 5.3 By Data Center Type
- 5.3.1 Hyperscale / Self-built
- 5.3.2 Enterprise / Edge
- 5.3.3 Colocation
- 5.3.3.1 Non-Utilized
- 5.3.3.2 Utilized
- 5.3.3.2.1 Retail Colocation
- 5.3.3.2.2 Wholesale Colocation
- 5.4 By End User
- 5.4.1 BFSI
- 5.4.2 IT and ITES
- 5.4.3 E-Commerce
- 5.4.4 Government
- 5.4.5 Manufacturing
- 5.4.6 Media and Entertainment
- 5.4.7 Telecom
- 5.4.8 Other End Users
- 5.5 By Geography
- 5.5.1 North America
- 5.5.2 South America
- 5.5.3 Europe
- 5.5.4 Asia-Pacific
- 5.5.5 Middle East and Africa
6 COMPETITIVE LANDSCAPE
- 6.1 Market Concentration
- 6.2 Strategic Moves
- 6.3 Market Share Analysis
- 6.4 Company Profiles (includes Global level Overview, Market level overview, Core Segments, Financials as available, Strategic Information, Market Rank/Share for key companies, Products and Services, and Recent Developments)
- 6.4.1 Amazon Web Services, Inc.
- 6.4.2 Google Inc.
- 6.4.3 Microsoft Corporation
- 6.4.4 Digital Realty Trust, Inc.
- 6.4.5 CloudHQ
- 6.4.6 CyrusOne
- 6.4.7 Digital Bridge (Formely known as Switch)
- 6.4.8 Stack Infrastructure
- 6.4.9 QTS Realty Trust, LLC
- 6.4.10 Quality Technology Services
- 6.4.11 Equinix Inc
- 6.4.12 Chindata Group Holdings Ltd
- 6.4.13 Menlo Equities LLC
- 6.4.14 Alibaba Cloud
- 6.4.15 IBM Corporation
7 MARKET OPPORTUNITIES AND FUTURE OUTLOOK
- 7.1 White-space and Unmet-Need Assessment