
|
시장보고서
상품코드
2035062
데이터센터 UPS 시장 : 점유율 분석, 업계 동향 및 통계, 성장 예측(2026-2031년)Data Center UPS - Market Share Analysis, Industry Trends & Statistics, Growth Forecasts (2026 - 2031) |
||||||
데이터센터 UPS 시장 규모는 2026년에 44억 8,000만 달러로 예상되며, 2031년까지 64억 6,000만 달러에 이를 것으로 예측되며, CAGR은 7.59%로 예측됩니다.

이 전망은 인공지능(AI) 워크로드, 랙 전력 밀도 증가, 데이터 주권 관련 정책으로 인해 사업자들이 열 위험을 억제하면서 지속적인 고전류 부하를 유지할 수 있는 이중 변환 방식과 모듈형 토폴로지로 전환하고 있는 상황을 반영하고 있습니다. 공급망 혼란을 상쇄하기 위해 공급업체들은 실리콘 카바이드(SiC) 반도체를 이용한 인버터 스테이지 재설계를 진행하고 있으며, 500kVA 이상의 시스템에서 리튬 이온 배터리의 경제성이 총소유비용(TCO) 패리티를 달성함에 따라 데이터센터 UPS 시장은 그리드 연계형 축전을 가능하게 하는 화학계 배터리로 전환되고 있습니다. 소매 및 통신 분야에서의 에지 구축은 분산형 소형 폼팩터에 대한 수요층을 추가하고 있으며, 이는 기존 판매 채널에 과제를 제기하는 동시에 고객 기반을 확장하고 있습니다. 동시에 유럽 주요 도시의 데이터센터 건설이 동결되면서 자본이 지방 도시로 이동하고 액체 냉각으로의 전환이 가속화되고 있습니다. 이로 인해 업스트림 UPS의 규모가 축소되고 있습니다.
세계 데이터센터 UPS 시장 동향 및 인사이트
하이퍼스케일 데이터센터 확장 가속화, 10MW 이상의 시설 증가
하이퍼스케일 사업자들은 2025년에 10MW 이상의 47개 캠퍼스를 가동시켰으며, 이는 전년 대비 38% 증가한 수치로, 다년간의 UPS 조달 파이프라인을 확정했습니다. 일반적인사이트 설계는 2-3MVA의 스트링을 4-6개 도입하여 단일 계약 금액이 1,500만 달러 이상에 달하며, 냉각 인터페이스 및 배터리 인클로저 형태에 대한 벤더의 커스터마이징을 촉진하고 있습니다. 현재 버지니아주 북부와 싱가포르의 전력회사는 계통연계까지 36-48개월의 대기시간을 예상하고 있기 때문에 개발업체들은 몇 시간에 걸친 정전에 대비하여 디젤 로터리 백업이 가능한 UPS 장치를 지정하고 있습니다. 500kVA 단위로 확장 가능한 모듈형 프레임으로 시공업체는 서버랙 도입에 맞추어 단계적으로 설비투자를 진행할 수 있어 유휴 용량으로 인한 손실을 줄일 수 있습니다. 유럽연합(EU)과 인도의 Sovereign-AI 규제는 5-8MW 규모의 설비 도입의 새로운 물결을 불러일으키고 있으며, 하이퍼스케일의 발자취를 기존 북미을 넘어 확장하고 있습니다.
AI 및 ML 워크로드의 전력 밀도 급증: 랙당 20kW 이상
2026년에는 트레이닝 클러스터의 전력 밀도가 랙당 100kW를 넘어섰으며, 불과 2년 전 15-20kW가 표준이었던 수준을 넘어섰습니다. 이러한 비약적인 변화로 인해 UPS 제조업체들은 전압 강하 없이 400A의 연속 전류를 공급할 수 있는 배전 장치를 재설계해야 하는 상황에 처해 있습니다. 집중형 룸에서는 긴 구리 배선으로 인한 저항 손실이 발생하기 때문에 이러한 고밀도 환경에서는 대응이 어려워 부하로부터 10m 이내의 위치에 설치되는 열 단위 모듈로의 전환이 가속화되고 있습니다. DTC(Direct-to-Chip) 방식의 액체 냉각은 팬에 의한 부수적인 전력 소비를 제거하여 운영자는 정격 UPS 용량을 최대 20%까지 절감할 수 있습니다. VRLA(납축전지)의 80Wh/l 대비 250Wh/l의 에너지 밀도를 가진 리튬 이온 배터리로 설치 면적을 줄임으로써 추가 랙 공간을 확보하여 랙당 UPS 비용을 절감할 수 있습니다. 복잡성 증가는 기술 격차를 확대하여 구매자를 설치, 시운전, 원격 모니터링을 패키지로 묶은 턴키 계약으로 유도하고 있습니다.
초기 설비투자(CAPEX) 프리미엄: 더블 컨버젼스 방식의 약 35% 수준
이중 변환 방식의 시스템은 듀얼 인버터 스테이지와 대형 방열판을 채택하고 있어 라인 인터랙티브형 모델보다 약 35% 더 비싸기 때문에 Tier III를 준수하고자 하는 기업의 자본 예산을 압박하고 있습니다. 현재 리스 프로그램은 UPS 용량을 서비스로 패키지화하여 설비투자(CAPEX)를 운영비(OPEX)로 전환하여 도입을 용이하게 하고 있지만, 신흥 시장의 금리가 여전히 10%를 상회하고 있어 보급에 걸림돌이 되고 있습니다. 100-500kVA 단위로 확장 가능한 모듈형 프레임은 구매자의 자금 흐름을 돕는 반면, 펌웨어 불일치 및 부하 분산 로직과 같은 상호운용성 문제로 인해 잠재적인 신뢰성 리스크가 발생할 수 있습니다. 저가 중국산 수입품이 대안이 될 수 있지만, 지적재산권 및 애프터서비스에 대한 우려로 인해 아시아태평양 이외의 지역에서는 보급이 억제되고 있습니다. 따라서 가격 차이가 예산에 민감한 소유자 계층의 데이터센터 UPS 시장의 잠재 고객층을 제한하고 있습니다.
부문 분석
모듈형 및 병렬 이중화 프레임은 CAGR 8.13%로 확대될 것으로 예상되며, 전체 데이터센터 UPS 시장보다 높은 성장률을 나타낼 것으로 보입니다. 이중화 온라인 방식의 유닛은 원활한 페일오버를 필요로 하는 Tier III 및 Tier IV 홀에 힘입어 2025년에도 44.65%의 점유율을 차지했으며 여전히 시장을 장악하고 있습니다. 라인 인터랙티브형 제품은 40%의 비용 우위가 고조파 왜곡과 짧은 가동시간을 보완하기 때문에 소규모 기업 설비에서 틈새 시장을 유지하고 있습니다. 한편, 대기형 유닛은 초저 설비투자(CAPEX)를 추구하는 엣지 캐비닛에 널리 도입되고 있습니다. 회전식 및 플라이휠식 설계는 디젤 발전기 화재 발생 시 20초 미만의 라이드 스루를 요구하는 시설에 제공되며, 배터리 유지보수를 위해 기계적 복잡성을 희생하는 대신 기계적 복잡성을 희생하는 대가로 제공됩니다.
랙 밀도가 증가함에 따라 조달 결정은 모듈성으로 기울어지고 있습니다. 이는 데이터 홀의 부하가 단일 임대 기간 내에 500kVA에서 2 MVA로 급증할 수 있기 때문입니다. 100-500kVA 단위로 확장 가능한 프레임은 30% 부하에서 가동 시 발생하는 효율 저하를 방지하고, 연간 전력 사용 효율(PUE)을 향상시킵니다. 소프트웨어 정의 제어 계층이 부하 분산을 조정하지만, 이는 운영자가 감사해야 하는 펌웨어 관리의 위험을 수반합니다. 그 결과, 온디맨드 방식으로 전력을 계량하는 코로케이션 리스 모델과 함께 모듈형 방식의 보급률이 지속적으로 증가하고 있습니다.
200kVA 이상의 시스템은 2025년 매출의 52.23%를 차지해 2031년까지 연평균 복합 성장률(CAGR) 8.56%를 나타낼 것으로 예측되며, 전체 시장 성장률을 상회할 것으로 전망됩니다. 랙당 100kW 이상의 AI 트레이닝 클러스터에서는 병렬 UPS 스트링이 일상적으로 필요하기 때문에 대형 프레임 시스템의 경제성이 입증되었습니다.
21-200kVA 계층은 랙당 전력 밀도가 15kW 미만인 기업 및 지역 코로케이션 시설을 지원합니다. 20kVA 미만의 유닛은 소매업과 통신업의 엣지 노드에 설치되지만, 외부 캐비닛이 필요 없는 서버 랙 일체형 카트리지로 인해 가격 압박에 직면하고 있습니다. 기업 사이트가 메가와트 규모의 캠퍼스로 집적화되면서 대형 프레임에 대한 수요는 더욱 증가하고 있습니다.
2025년에도 중앙집중형 홀은 46.21%의 점유율을 유지했지만, 사업자들이 에너지 절약과 빠른 복구를 추구하면서 분산형 아키텍처는 CAGR 8.72%로 확대되고 있습니다. UPS 모듈을 부하에서 10m 이내에 배치하면 구리선 손실을 최대 5%까지 줄일 수 있습니다.
그러나 Tier IV 시설에서는 인증 감사를 간소화하는 2N+1의 중앙 집중식 레이아웃이 여전히 선호되고 있습니다. 단계적 확장 시 초기 설비 도입을 1열부터 시작하여 테넌트 수요가 구체화될 때까지 UPS 설비투자의 40-60%를 미룰 수 있기 때문에 분산형 설계가 유리합니다. 기존 시설의 개보수 시 개폐장치 및 버스웨이에 대한 기존 투자를 고려하여 중앙집중형 룸을 유지하는 경우가 많습니다.
지역별 분석
북미는 버지니아주 북부, 실리콘밸리, 댈러스-포트워스에 위치한 하이퍼스케일 시설의 집적화로 인해 2025년 매출의 39.43%를 차지했습니다. 토지 부족과 48개월에 달하는 유틸리티 대기 기간으로 인해 투자자들이 피닉스, 애틀랜타, 콜럼버스로 이동함에 따라 성장이 둔화되고 있습니다. 캐나다는 수력발전의 잉여 전력과 시원한 기후를 활용해 하이퍼스케일러를 유치하고 있지만, 국경 간 데이터 규제로 인해 미국으로의 워크로드 배치는 복잡해지고 있습니다. 멕시코는 니어쇼어링 수요를 수용하기 위해 몬테레이와 케레타로의 송전망 업그레이드에 주목하고 있습니다. 2025년 리튬 이온 배터리의 보급률은 40%를 넘어섰고, TCO(총소유비용)를 중시하는 경향이 두드러집니다. 이 지역에는 120개 이상의 인증 홀을 보유하고 있으며, Tier IV 표준 채택에 있어 세계를 선도하고 있습니다.
아시아태평양은 CAGR 9.02%를 나타낼 것으로 예측됩니다. 중국의 2급 도시들은 저렴한 재생에너지를 무기로 건설을 유치하고 있는 반면, 1급 도시들은 전력 공급의 한계에 직면해 있습니다. 인도에서는 디지털 결제의 성장과 데이터 현지화 의무화를 배경으로 코로케이션 수요가 급증하고 있지만,월4-6시간에 달하는 정전으로 인해 UPS 시스템을 과도하게 설계할 수밖에 없는 상황입니다. 싱가포르는 2024년에 2019년 건설 상한선을 일부 해제했지만, 이는 전력사용효율(PUE) 1.3 미만을 달성한 시설에 한정됩니다. 일본과 호주는 성숙한 Tier III 인프라를 유지하고 있지만, 토지 부족에 직면하고 있으며, 모듈식 UPS 프레임의 채택이 진행되고 있습니다. 동남아시아, 특히 말레이시아와 인도네시아에서는 모바일 커머스 관련 엣지 수요가 있으며, 도입은 20-100kVA 대역에 집중되어 있습니다.
2025년 유럽은 전 세계 지출의 약 25%를 차지했지만, 도시별 모라토리엄으로 물과 전력 배분이 제한되는 지역에서는 성장이 둔화되고 있습니다. 2026년 발효되는 탄소국경조정 메커니즘은 탄소배출량이 많은 부품 공급망에 페널티를 부과하고, 스칸디나비아나 독일의 재생에너지 팹으로 조달을 유도하고 있습니다. 정부 주도의 AI 도입 의무화로 Tier IV 건설이 가속화되면서 스톡홀름, 밀라노 등 2차 도시권이 활기를 띠고 있습니다. 영국은 브렉시트 이후 데이터 규제의 혜택을 누리고 있는 반면, 남유럽은 태양광 발전과 저렴한 토지를 활용해 기존 허브 도시에 대항하고 있습니다. 남미는 여전히 소규모에 머물러 있지만, 브라질의 데이터 주권법, 칠레의 친환경 에너지 등이 초기 진출기업을 끌어들이고 있습니다. 중동은 지역 AI 허브에 100억 달러를 할당하여 가속화하고 있으며, 아프리카의 성장 거점은 남아공과 나이지리아에 집중되어 있고, 통신사 주도의 엣지 인프라 구축이 자리를 잡아가고 있습니다.
기타 특전:
- 엑셀 형식 시장 예측(ME) 시트
- 3개월간 애널리스트 지원
자주 묻는 질문
목차
제1장 서론
제2장 조사 방법
제3장 주요 요약
제4장 시장 구도
제5장 시장 규모와 성장 예측
제6장 경쟁 구도
제7장 시장 기회와 향후 전망
JHS 26.05.20The data center UPS market size stood at USD 4.48 billion in 2026 and is projected to reach USD 6.46 billion by 2031, reflecting a 7.59% CAGR.
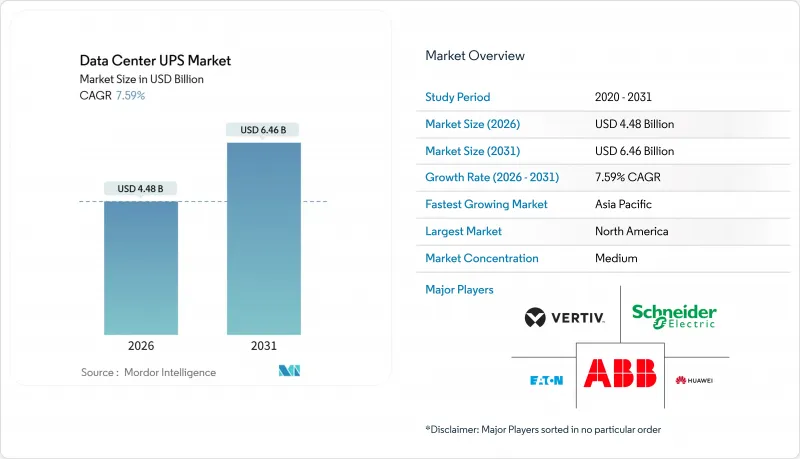
This outlook captures how artificial intelligence workloads, rising rack power density, and sovereign data-sovereignty policies are steering operators toward double-conversion and modular topologies that sustain continuous high-current loads while keeping thermal risk in check. Vendors are redesigning inverter stages around silicon-carbide semiconductors to offset supply-chain shocks, and lithium-ion battery economics have hit total-cost-of-ownership parity in systems above 500 kVA, nudging the data center UPS market toward chemistries that enable grid-interactive storage. Edge deployments in retail and telecom add a distributed, small-form-factor layer of demand that challenges legacy sales channels yet broadens the customer base. At the same time, data-center moratoriums in leading European metros divert capital toward secondary cities and accelerate the shift to liquid cooling, which reduces upstream UPS sizing.
Global Data Center UPS Market Trends and Insights
Hyperscale Data-Center Build-Outs Accelerating >=10 MW Facilities
Hyperscale operators commissioned 47 campuses above 10 MW in 2025, a 38% annual jump that locks in multi-year UPS procurement pipelines. Typical site designs deploy four to six 2-3 MVA strings, creating single-contract values of USD 15 million or more and spurring vendor customization of cooling interfaces and battery enclosure formats. Utilities in Northern Virginia and Singapore now quote interconnection queues of 36-48 months, so developers specify UPS units with diesel rotary backup to bridge multi-hour grid outages. Modular frames that scale in 500 kVA steps let builders phase capital alongside server rack deployments, trimming idle capacity losses. Sovereign-AI rules in the European Union and India add another wave of 5-8 MW installations, broadening the hyperscale footprint beyond legacy North American hubs.
AI and ML Workload Power-Density Surge >=20 kW per Rack
Training clusters exceeded 100 kW per rack in 2026, eclipsing the 15-20 kW norm seen just two years earlier. This step-change forces UPS makers to redesign power distribution units capable of carrying 400 A continuous currents without voltage sag. Centralized rooms struggle at these densities because long copper runs incur resistive losses, catalyzing a shift to row-level modules situated within 10 m of the load. Direct-to-chip liquid cooling eliminates parasitic fan power, enabling operators to downsize rated UPS capacity by up to 20%. Floor-space savings from lithium-ion batteries, which pack 250 Wh/l compared with 80 Wh/l for VRLA, free up extra rack positions and reduce per-rack UPS cost. The complexity uptick widens a skills gap, steering buyers toward turnkey contracts that bundle installation, commissioning, and remote monitoring.
Upfront CAPEX Premium ~35% of Double-Conversion Topology
Double-conversion systems cost roughly 35% more than line-interactive models because they employ dual inverter stages and larger heat sinks, stretching capital budgets for enterprises targeting Tier III compliance. Leasing programs now package UPS capacity as a service, converting capex into opex and easing adoption, but finance rates in emerging markets still exceed 10%, dampening uptake. Modular frames that scale in 100-500 kVA blocks let buyers defer cash, yet interoperability issues such as mismatched firmware or load-sharing logic can expose hidden reliability risks. Lower-priced Chinese imports offer an alternative, but concerns around intellectual property and after-sales support curb penetration outside Asia-Pacific. The price gap therefore limits the addressable segment of the data center UPS market among budget-sensitive owners.
Other drivers and restraints analyzed in the detailed report include:
- Edge Micro-Data-Center Proliferation in Retail and Telecom
- Lithium-Ion TCO Advantage Over VRLA in >=500 kVA UPS
- Supply-Chain Volatility for Power Electronic Components
For complete list of drivers and restraints, kindly check the Table Of Contents.
Segment Analysis
Modular and parallel-redundant frames are set to expand at an 8.13% CAGR, outrunning the broader data center UPS market. Double-conversion online units still dominate with a 44.65% share in 2025, anchored in Tier III and Tier IV halls that need seamless failover. Line-interactive products retain a niche in small-enterprise rooms because their 40% cost advantage compensates for harmonic distortion and shorter runtime, while standby units populate edge cabinets, chasing ultra-low capex. Rotary and flywheel designs serve facilities that demand sub-20s ride-through for diesel generator fire, trading battery maintenance for mechanical complexity.
Rising rack densities tilt the procurement calculus toward modularity because data hall load can jump from 500 kVA to 2 MVA inside a single lease cycle. Frames that click in 100-500 kVA increments avoid the efficiency penalty of operating at 30% load, lifting annualized power-usage effectiveness. Software-defined control layers orchestrate load-sharing, but they introduce firmware-management risk that operators must audit. As a result, modular penetration continues to climb in tandem with colocation leasing models that meter power on demand.
Systems above 200 kVA represented 52.23% of 2025 revenue and are forecast to post an 8.56% CAGR to 2031, ahead of overall market velocity. AI training clusters exceeding 100 kW per rack routinely require parallel UPS strings, validating the economics of large-frame systems.
The 21-200 kVA tier underpins enterprise and regional colocation halls, where power density remains below 15 kW per rack. Sub-20 kVA units inhabit edge nodes in retail and telecom and face price compression from server-rack-integrated cartridges that eliminate the need for external cabinets. Consolidation of enterprise sites into megawatt campuses further swells demand for large frames.
Centralized halls still held a 46.21% share in 2025, but distributed architectures are advancing at an 8.72% CAGR as operators hunt for energy savings and faster repairs. Positioning UPS modules within 10 m of the load cuts copper losses by up to 5%.
Tier IV facilities, however, continue to prefer 2N+1 centralized layouts that simplify certification audits. Phased buildouts reward distributed designs because initial fit-out can start with a single row, deferring 40-60% of UPS capital until tenant demand materializes. Retrofit sites often stick with centralized rooms, given sunk costs in switchgear and busway.
The Data Center UPS Market Report is Segmented by UPS Type (Standby, Line-Interactive, and More), Power Capacity (<=20 KVA, and More), Architecture (Centralized, and More), Battery Type (Lead-Acid VRLA, Lithium-Ion, and More), Tier Type (Tier 1 and 2, Tier 3, and Tier 4), Data Center Size (Small, Medium, and More), Data Center Type (Colocation, and More), and Geography. The Market Forecasts are Provided in Terms of Value (USD).
Geography Analysis
North America controlled 39.43% of 2025 revenue thanks to hyperscale density in Northern Virginia, Silicon Valley, and Dallas-Fort Worth. Growth moderates as land scarcity and 48-month utility queues push investors toward Phoenix, Atlanta, and Columbus. Canada uses hydroelectric surplus and cool weather to attract hyperscalers, yet cross-border data rules complicate U.S. workload placement. Mexico eyes grid upgrades in Monterrey and Queretaro to capture nearshoring demand. Lithium-ion penetration exceeded 40% of 2025 installs, underscoring TCO priorities. The region leads Tier IV adoption with more than 120 certified halls.
Asia-Pacific is set for a 9.02% CAGR as China's tier-2 cities entice builds with cheap renewable power while tier-1 metros face energy caps. India's colocation surge rides on digital payment growth and data-localization mandates, though 4-6-hour monthly grid outages force oversizing of UPS strings. Singapore partially lifted its 2019 build cap in 2024, but only for facilities that achieve power-usage effectiveness below 1.3. Japan and Australia maintain mature Tier III footprints but wrestle with land scarcity that favors modular UPS frames. Southeast Asia, particularly Malaysia and Indonesia, sees edge demand tied to mobile commerce, with deployments clustering in the 20-100 kVA band.
Europe accounted for roughly 25% of global spend in 2025, yet growth slows where city moratoriums cap water or power allocations. The Carbon Border Adjustment Mechanism effective 2026 penalizes carbon-heavy component supply chains, nudging procurement toward renewable-powered fabs in Scandinavia and Germany. Sovereign-AI mandates accelerate Tier IV builds, boosting secondary metros like Stockholm and Milan. The United Kingdom benefits from post-Brexit data rules, while Southern Europe leverages solar power and cheaper land to rival historic hubs. South America stays sub-scale, though Brazil's data-sovereignty law and Chile's green energy draw early movers. The Middle East accelerates with USD 10 billion earmarked for regional AI hubs, and Africa's pockets of growth center on South Africa and Nigeria where telecom-led edge builds take root.
- ABB Ltd
- Schneider Electric SE
- Eaton Corporation plc
- Vertiv Holdings Co.
- Huawei Technologies Co. Ltd.
- Power Innovations International LLC
- Mitsubishi Electric Corp.
- Riello Elettronica S.p.A
- SOCOMEC Group S.A.
- Piller Power Systems GmbH
- Toshiba Corp.
- Gamatronic (SolarEdge Technologies Inc.)
- Delta Electronics Inc.
- Kohler Co.
- Legrand SA
- Socomec UPS India Pvt Ltd.
- Caterpillar Inc.
- AEG Power Solutions BV
- Tripp Lite (Eaton)
- Kehua Tech Co. Ltd.
Additional Benefits:
- The market estimate (ME) sheet in Excel format
- 3 months of analyst support
TABLE OF CONTENTS
1 INTRODUCTION
- 1.1 Study Assumptions and Market Definition
- 1.2 Scope of the Study
2 RESEARCH METHODOLOGY
3 EXECUTIVE SUMMARY
4 MARKET LANDSCAPE
- 4.1 Market Overview
- 4.2 Market Drivers
- 4.2.1 Hyperscale Data-Center Build-Outs Accelerating >=10 MW Facilities
- 4.2.2 Edge Micro-Data-Center Proliferation in Retail and Telecom
- 4.2.3 Carbon-Neutral Procurement Mandates by Hyperscalers
- 4.2.4 Lithium-Ion TCO Advantage Over VRLA in >=500 kVA UPS
- 4.2.5 AI / ML Workload Power-Density (>=20 kW / Rack) Surge
- 4.2.6 Mandatory Tier III+ Uptime Compliance in Emerging Markets
- 4.3 Market Restraints
- 4.3.1 Upfront CAPEX Premium (≈35 %) of Double-Conversion Topology
- 4.3.2 Grid-Interactive Energy-Storage Regulations Still Nascent
- 4.3.3 Supply-Chain Volatility for Power Electronic Components
- 4.3.4 Data-Center Moratoriums on Water / Energy Use in EU Metros
- 4.4 Industry Value Chain Analysis
- 4.5 Regulatory Landscape
- 4.6 Technological Outlook
- 4.7 Porter's Five Forces Analysis
- 4.7.1 Bargaining Power of Suppliers
- 4.7.2 Bargaining Power of Buyers
- 4.7.3 Threat of New Entrants
- 4.7.4 Threat of Substitutes
- 4.7.5 Intensity of Competitive Rivalry
- 4.8 Impact of Macroeconomic Factors on the Market
5 MARKET SIZE AND GROWTH FORECASTS (VALUE)
- 5.1 By UPS Type
- 5.1.1 Standby
- 5.1.2 Line-Interactive
- 5.1.3 Double-Conversion On-Line
- 5.1.4 Modular / Parallel-Redundant
- 5.1.5 Rotary and Flywheel
- 5.2 By Power Capacity
- 5.2.1 <=20 kVA
- 5.2.2 21-200 kVA
- 5.2.3 >200 kVA
- 5.3 By Architecture
- 5.3.1 Centralized
- 5.3.2 Distributed (Row-Level)
- 5.3.3 Modular Scalable
- 5.4 By Battery Type
- 5.4.1 Lead-Acid (VRLA)
- 5.4.2 Lithium-Ion
- 5.4.3 Nickel-Cadmium and Others
- 5.5 By Tier Type
- 5.5.1 Tier 1 and 2
- 5.5.2 Tier 3
- 5.5.3 Tier 4
- 5.6 By Data Center Size
- 5.6.1 Small Data Center
- 5.6.2 Medium Data Center
- 5.6.3 Large Data Center
- 5.6.4 Hyperscale Data Center
- 5.7 By Data Center Type
- 5.7.1 Colocation Data Center
- 5.7.2 Hyperscalers Data Center/CSPs
- 5.7.3 Enterprise and Edge Data Center
- 5.8 By Geography
- 5.8.1 North America
- 5.8.1.1 United States
- 5.8.1.2 Canada
- 5.8.1.3 Mexico
- 5.8.2 South America
- 5.8.2.1 Brazil
- 5.8.2.2 Chile
- 5.8.2.3 Argentina
- 5.8.2.4 Rest of South America
- 5.8.3 Europe
- 5.8.3.1 United Kingdom
- 5.8.3.2 Germany
- 5.8.3.3 France
- 5.8.3.4 Italy
- 5.8.3.5 Spain
- 5.8.3.6 Rest of Europe
- 5.8.4 Asia-Pacific
- 5.8.4.1 China
- 5.8.4.2 Japan
- 5.8.4.3 India
- 5.8.4.4 Singapore
- 5.8.4.5 Australia
- 5.8.4.6 Malaysia
- 5.8.4.7 Rest of Asia-Pacific
- 5.8.5 Middle East and Africa
- 5.8.5.1 Middle East
- 5.8.5.1.1 United Arab Emirates
- 5.8.5.1.2 Saudi Arabia
- 5.8.5.1.3 Turkey
- 5.8.5.1.4 Rest of Middle East
- 5.8.5.2 Africa
- 5.8.5.2.1 South Africa
- 5.8.5.2.2 Nigeria
- 5.8.5.2.3 Rest of Africa
- 5.8.5.1 Middle East
- 5.8.1 North America
6 COMPETITIVE LANDSCAPE
- 6.1 Market Concentration
- 6.2 Strategic Moves
- 6.3 Market Share Analysis
- 6.4 Company Profiles (includes Global Level Overview, Market Level Overview, Core Segments, Financials as available, Strategic Information, Market Rank/Share, Products and Services, Recent Developments)
- 6.4.1 ABB Ltd
- 6.4.2 Schneider Electric SE
- 6.4.3 Eaton Corporation plc
- 6.4.4 Vertiv Holdings Co.
- 6.4.5 Huawei Technologies Co. Ltd.
- 6.4.6 Power Innovations International LLC
- 6.4.7 Mitsubishi Electric Corp.
- 6.4.8 Riello Elettronica S.p.A
- 6.4.9 SOCOMEC Group S.A.
- 6.4.10 Piller Power Systems GmbH
- 6.4.11 Toshiba Corp.
- 6.4.12 Gamatronic (SolarEdge Technologies Inc.)
- 6.4.13 Delta Electronics Inc.
- 6.4.14 Kohler Co.
- 6.4.15 Legrand SA
- 6.4.16 Socomec UPS India Pvt Ltd.
- 6.4.17 Caterpillar Inc.
- 6.4.18 AEG Power Solutions BV
- 6.4.19 Tripp Lite (Eaton)
- 6.4.20 Kehua Tech Co. Ltd.
7 MARKET OPPORTUNITIES AND FUTURE OUTLOOK
- 7.1 White-Space and Unmet-Need Assessment

