

|
시장보고서
상품코드
2043885
납 : 시장 점유율 분석, 업계 동향 및 통계, 성장 예측(2026-2031년)Lead - Market Share Analysis, Industry Trends & Statistics, Growth Forecasts (2026 - 2031) |
||||||
 Mordor Intelligence
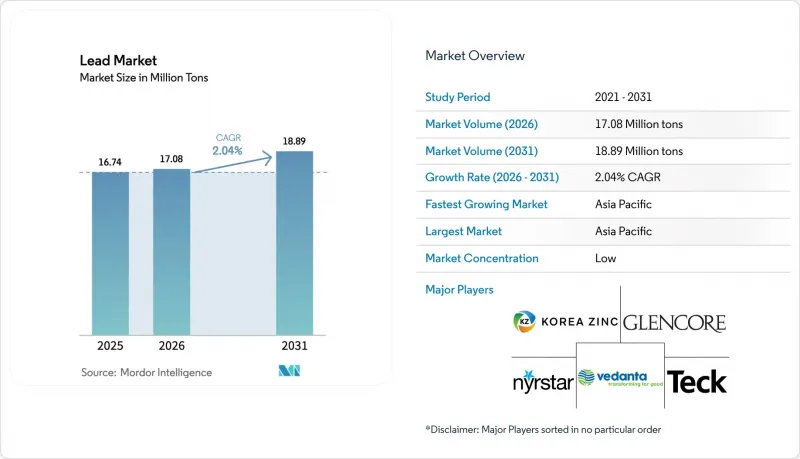
납 시장 규모는 2025년 1,674만 톤으로 평가되었습니다. 2026년에는 1,708만 톤으로 확대되어 2026년부터 2031년에 걸쳐 CAGR 2.04%를 나타내, 2031년까지 1,889만 톤에 이를 것으로 예측됩니다.
데이터센터용 UPS 수요, 아시아 신흥국들의 저속 전기차 보급, 그리고 배터리의 81.02%라는 압도적인 점유율로 인해 리튬화학이 주목받는 가운데서도 정련금속은 가격 변동에 영향을 덜 받는 대규모 판로가 유지되고 있습니다. 2차 공급은 이미 세계 생산량의 62.65%를 차지하고 있으며, 2031년까지 85%의 재활용 함량을 의무화하는 EU 규정 2023/1542에 따라 스크랩을 원료로 한 공급량은 CAGR 2.29%로 확대되고 있습니다. 이는 정광 등급 하락과 연간 15%의 설비투자(CAPEX) 인플레이션에 발목을 잡히는 1차 광업보다 더 빠른 속도입니다. 아태지역은 인도의 전기 리무진(삼륜택시) 보급, 중국의 도시광산화에 대한 보조금, 아세안 국가들의 승차공유 물류에 힘입어 51.28%의 점유율과 2.99%의 연평균 복합 성장률(CAGR)로 시장을 주도하고 있습니다. 경쟁의 강도는 중간 정도이며(주요 5개 기업이 정제 능력의 약 35%를 점유), 폐쇄 루프 수용액 제련 기술을 도입하여 낮은 에너지 소비로 납 함유량의 99%를 회수하는 수직 통합형 재활용 사업자에게 유리하게 작용하고 있습니다.
세계의 납 시장 동향 및 인사이트
데이터센터 및 5G 백업시스템으로 인한 납축전지 수요 급증
하이퍼스케일 시설의 전력 소비량은 2026년까지 2배인 1,000TWh에 달할 것이며, 이는 VRLA UPS 스트링에 대한 연간 12만-15만 톤의 납 수요 증가에 해당합니다. 리튬 소화 시스템은 설비투자(CAPEX)에 kWh당 50-80달러를 추가하기 때문에 VRLA UPS 스트링이 여전히 선호되고 있습니다. 인도와 동남아시아 통신사들도 비슷한 추세를 보이고 있습니다. 버티에어텔은 낮은 교체 비용과 성숙한 역물류 네트워크를 이유로 2025년까지 5,000개 마을에 납축 배터리로 백업되는 5G 타워를 설치했습니다. 통신용 백업은 데이터센터의 이중화와 결합하여 화학 기술의 대체에 영향을 받지 않는 탄력적이고 고수익성 있는 시장을 지원해야 합니다. 최신 VRLA 설계에 대한 OEM 보증이 15년으로 연장됨에 따라 전환 비용이 더욱 높아졌습니다. 미국 및 EU의 안전 규제 당국은 리튬 배터리의 열 폭주 위험을 지속적으로 지적하고 있으며, 검증된 납축 배터리 시스템에 대한 선호도를 높이고 있습니다.
신흥 아시아에서 저속 EV의 부활
인도의 전기 리킥샤(삼륜 택시) 보유량은 2025년 150만 대를 돌파했으며, 이 중 90%는 납축 배터리 팩으로 운영되었으며, 그 비용은 리튬 배터리보다 40-50% 저렴합니다. 이는 하루 8-12달러를 버는 운전자들에게 결정적인 요인으로 작용하고 있습니다. 2024년 '전기 모빌리티 촉진 계획'에서는 화학 성분에 관계없이 시속 25km 미만의 차량에 대한 보조금을 확대하여 기존 리튬 배터리에만 국한된 인센티브 정책을 전환했습니다. Grab과 Gojek과 같은 아세안 라이드셰어 사업자들은 유사한 세발자전거를 채택하고 있으며, 미국에서는 저주행거리 골프 카트에서 2025년까지 납축전지의 점유율이 85%를 유지했습니다. 하루 주행거리가 25km 미만인 점, 충전 인프라가 제한적이라는 점, 그리고 높은 스크랩 가치로 인해 연간 20만-25만 톤 수요가 확보되어 있습니다. 급속 교체 가능한 트레이를 갖춘 VRLA(밀폐형 납축전지)의 변형은 공유 모빌리티의 경제성에 더욱 적합합니다.
OEM의 리튬 인산철(LFP) 스타터 배터리로의 전환 가속화
중국 자동차 제조업체인 BYD와 CATL은 2025년 1kWh당 60달러 미만의 LFP 스타터 팩을 시험적으로 도입했습니다. 10년의 수명을 고려하면 납축전지와 비용 경쟁력이 거의 비슷합니다. 스타트-스톱 시스템에서 납축전지의 500-800 사이클에 비해 리튬전지는 3,000-5,000 사이클이 유리하며, 채택이 확대되면 연간 15만-20만 톤 수요를 대체할 수 있는 리스크가 있습니다. 유럽 자동차 제조업체들은 여전히 신중한 태도를 유지하고 있습니다. 폭스바겐은 -10℃ 이하의 저온 환경에서의 성능 저하를 지적하며 본격적인 도입을 미루고 있습니다. 자동차 배터리 총량의 60%를 차지하는 애프터마켓의 교체 수요는 완성차 업체들의 도입보다 5-7년 정도 늦어질 것으로 예상되며, 이로 인해 단기적인 수요 감소는 완화될 것으로 보입니다.
부문 분석
2025년 기준, 납축전지는 용도별 수요의 81.02%를 차지했으며, 전력용 틈새 시장은 CAGR 3.05%로 전체 납축전지 시장보다 빠른 속도로 성장하고 있습니다. 아마존과 같은 창고 운영 기업은 2025년에 12만 대의 전동 지게차를 도입했지만, 그중 70%는 여전히 납축 배터리로 구동되고 있습니다. 이는 차량 관리자가 익숙한 충전 프로토콜과 낮은 초기 비용을 중시하기 때문입니다. 탄약 분야 점유율은 3-4%로 안정적이며, 무연 훈련용 총알이 보급되고 있음에도 불구하고 미 육군은 소총기용 탄약으로 1만 2,000톤을 소비하고 있습니다. 건설 분야 수요는 신축 병원 방사선 차폐재와 관련하여 CAGR 1.5%의 낮은 성장률을 보이고 있습니다. 전자기기용 납땜은 RoHS 대응 주석-은-구리 합금의 보급으로 8% 축소되었으나, 항공우주 분야 적용 제외로 1만 5,000톤의 틈새 시장이 유지되고 있습니다.
지게차 OEM 제조업체는 1시간 만에 80% 충전 상태에 도달하는 급속 충전식 액체 배터리를 상품화했습니다. 이를 통해 리튬 이온 배터리와의 편의성 차이를 좁혀 40%의 비용 우위를 확보하고 있습니다. 신흥 시장에서 암 치료 능력이 확대되는 가운데, 의료용 영상진단용 차폐막에는 8-12mm의 납 시트가 채택되고 있습니다. 소형 선박용 선박용 배터리는 낚시꾼과 레저 보트 소유자가 무게보다 가격을 우선시하기 때문에 CAGR 2.0%를 유지하고 있습니다. 용도의 다양화로 인해 자동차 분야의 대체 수요로 인한 가격 변동이 억제되고 있습니다.
2차 원료는 2025년 공급량의 62.65%를 차지했으며, 2031년까지 연평균 2.29%를 나타낼 것으로 예측됩니다. 이는 광산에서 나오는 1차 원료의 완만한 성장 궤적을 뛰어넘는 수치입니다. EU의 순환경제 관련 규제만 보더라도 15만-20만 톤 수요가 신규 금속에서 전환되고 있으며, 지역 생산에서 재활용 소재가 디폴트로 자리 잡아가고 있습니다. 북미에서는 회수율이 99%에 달하며, 에코뱃(Ecobat)의 연간 45만 톤의 처리 능력을 뒷받침하고 있습니다. 1차 생산은 아프리카 일부 지역 등 재활용 체계가 미비한 지역과 특수 용도에 사용되는 초순수 등급에서 여전히 중요한 역할을 하고 있습니다. 인도 베단타(Vedanta)의 아연 제품별 생산비용은 1,000달러 이하로, 다금속 광산의 시너지 효과가 여전히 경쟁력을 유지할 수 있음을 보여줍니다.
중국의 도시광산에 대한 보조금은 2차 제품의 현금 비용을 톤당 900달러 이하로 떨어뜨려 전 세계에 디플레이션 압력을 가하고 있습니다. LME 가격이 2,000달러 이하로 떨어지면 캐나다와 호주의 고비용 광산은 생산 능력을 유휴화하여 2차 제품의 우위를 강화하여 납 시장 구조가 더욱 순환형으로 전환될 것입니다.
본 납 시장 보고서는 용도(탄약, 배터리, 건설, 전자기기 등), 공급원(1차 및 2차 정보), 제품 형태(정제된 납, 납 합금 등), 최종 사용 산업(자동차, 산업 제조 등), 지역(아시아태평양, 북미, 유럽, 남미, 중동 및 아프리카)별로 분류되어 있습니다. 시장 예측은 수량(톤) 기준으로 제공됩니다.
지역별 분석
아시아태평양은 2025년 생산량의 51.28%를 차지했으며, 2031년까지 연평균 2.99%의 성장률을 유지할 것으로 전망됩니다. 중국이 시행한 50억 위안의 도시 광산 보조금 프로그램을 통해 회수율이 98%에 달하고, 세계 2차 생산량의 55-60%를 확보했습니다. 인도의 EMPS(전기차 보급 계획)는 저속 전기차에 대한 보조금을 확대하여 리튬보다 40-50% 저렴한 납축전지에 의존하는 150만 대의 전기차에 대한 보조금을 지원하고 있습니다. 아세안의 물류차량도 비슷한 경향을 보이고 있으며, 하루 주행거리가 25km 미만인 라스트마일 배송에 세발자전거를 도입하고 있습니다. 일본과 한국은 고순도 정련 금속에 집중하고 있으며, 한국아연(Korea Zinc)의 온산 복합단지에서는 다금속 정광에서 92%의 회수율을 달성하고 있습니다. 호주의 브로큰힐 광산의 생산 축소로 인해 2025년 1차 공급량이 3만 톤 감소함에 따라 이 지역은 수입 및 재활용 금속에 대한 의존도가 높아졌습니다.
북미에서는 99%의 배터리 회수율과 에코뱃(Ecobat)의 17개 시설 네트워크가 원동력이 되고 있습니다. EPA에 의한 납 급수관 철거는 배관 수요를 감소시키지만, 회수된 금속은 제련소로 직접 보내지고 있습니다. Teck의 트레일 제련소는 아연 잔여물에서 1만 5,000톤의 아연을 회수하고 있습니다. 멕시코 몬테레이에 위치한 배터리 허브는 USMCA(미국-멕시코-캐나다 협정)의 함량 기준을 충족하기 위해 재활용 원료를 사용하고 있습니다. 그럼에도 불구하고 PFAS 규제 대응 비용은 전해제련에 의존하는 1차 제련소에게 부담으로 작용하고 있습니다.
유럽에서는 독일 OEM 업체들이 LFP 스타터를 테스트하고 있지만, 추운 지역에서의 문제로 인해 도입이 지연되고 있습니다. 에코뱃의 영국과 독일 사업장은 대규모 PFAS 대책 개보수를 피함으로써 주요 경쟁사 대비 톤당 50-70달러의 비용 우위를 확보하고 있습니다. 러시아의 생산량은 제재에 따라 국내 시장으로 전환되어 지역 내 공급 균형을 유지하고 있습니다. 남미에서는 브라질의 교체 수요가 견조한 반면, 중동 및 아프리카에서는 차폐 및 비상전원 공급이 필요한 인프라 프로젝트로 인해 수요가 확대되고 있습니다.
기타 혜택 :
- 엑셀 형식 시장 예측(ME) 시트
- 3개월간 애널리스트 지원
자주 묻는 질문
목차
제1장 서론
제2장 조사 방법
제3장 주요 요약
제4장 시장 구도
제5장 시장 규모와 성장 예측
제6장 경쟁 구도
제7장 시장 기회와 향후 전망
KTH 26.05.29The Lead Market size is expected to grow from 16.74 Million tons in 2025 to 17.08 Million tons in 2026 and is forecast to reach 18.89 Million tons by 2031 at 2.04% CAGR over 2026-2031.
Data-center UPS demand, low-speed EV adoption in emerging Asia, and 81.02% battery dominance within the application mix preserve a sizable, price-insulated outlet for refined metal even as lithium chemistries gain attention. Secondary supply already delivers 62.65% of global output, and EU Regulation 2023/1542 that mandates 85% recycled content by 2031 is accelerating a 2.29% CAGR for scrap-based feedstock, outstripping primary mining, hampered by concentrate-grade decline and 15% annual CAPEX inflation. Asia-Pacific leads with 51.28% of volume and a 2.99% CAGR, buoyed by India's e-rickshaw fleet, China's urban-mining subsidies, and ASEAN ride-hailing logistics. Moderate competitive intensity - top five players control roughly 35% of refined capacity - favors vertically integrated recyclers that deploy closed-loop hydrometallurgical technology, recovering 99% of contained lead at lower energy intensity.
Global Lead Market Trends and Insights
Booming Lead-Acid Battery Demand from Data-Center and 5G Back-Up Systems
Hyperscale facilities double electricity draw to 1,000 TWh by 2026, translating to 120,000-150,000 tons of incremental annual lead for VRLA UPS strings that remain preferred because lithium fire-suppression adds USD 50-80 per kWh to capex. Indian and Southeast Asian carriers mirror the trend; Bharti Airtel equipped 5,000 towns with lead-acid backed 5G towers during 2025, citing lower replacement cost and a mature reverse-logistics network. Telecom backup needs to combine with data-center redundancy to underpin a resilient, high-margin outlet insulated from chemistry substitution. OEM warranties extending to 15 years for the newest VRLA designs further raise switching costs. Safety regulators in the US and EU continue to flag lithium thermal-runaway risk, reinforcing preference for tried-and-tested lead systems.
Resurgence of Low-Speed EVs in Emerging Asia
India's e-rickshaw fleet surpassed 1.5 million units in 2025, 90% of which run on lead-acid packs that cost 40-50% less than lithium equivalents, a decisive factor for drivers earning USD 8-12 daily. The 2024 Electric Mobility Promotion Scheme extended subsidies to vehicles below 25 km/h regardless of chemistry, reversing earlier lithium-only incentives. ASEAN ride-hailing operators such as Grab and Gojek adopted similar trikes, and low-range golf carts in the United States kept an 85% lead-acid share through 2025. Daily duty cycles below 25 km, limited charging infrastructure, and high scrap value lock in 200,000-250,000 tons of annual demand. VRLA variants with rapid-swapping trays further align with shared-mobility economics.
Accelerating OEM Shift to Lithium-Iron-Phosphate Starter Batteries
Chinese automakers BYD and CATL piloted LFP starter packs in 2025 at cell costs under USD 60 per kWh, nearing parity with lead-acid once 10-year lifespans are factored. Start-stop systems favor 3,000-5,000 lithium cycles versus 500-800 for lead, risking the displacement of 150,000-200,000 tons of annual demand if adoption scales. European OEMs remain cautious; Volkswagen flagged cold-weather degradation below -10 °C, delaying wide deployment. Aftermarket replacement, representing 60% of automotive battery volume, will lag OEM rollout by five to seven years, cushioning near-term erosion.
Other drivers and restraints analyzed in the detailed report include:
- Mandated Minimum Recycled-Content Rules in EU and US Battery Regulations
- Multi-Metal Refinery Retrofits Unlocking Latent Primary-Lead Capacity
- Strict PFAS Limits Raising Operating Costs for Lead Smelters
For complete list of drivers and restraints, kindly check the Table Of Contents.
Segment Analysis
Lead-acid batteries accounted for 81.02% of application demand in 2025, and the motive-power niche is on track for a 3.05% CAGR, outpacing the overall lead market. Warehouse operators such as Amazon deployed 120,000 electric forklifts in 2025, 70% still powered by lead packs because fleet managers value familiar charging protocols and lower upfront costs. Ammunition remains a stable 3-4% share, with the US Army consuming 12,000 tons for small-arms rounds despite lead-free training projectiles gaining ground. Construction demand posts a muted 1.5% CAGR, linked to radiation shields in new hospitals. Electronics solder contracted 8% as RoHS tin-silver-copper alloys spread, though aerospace exemptions preserve a 15,000-ton niche.
Forklift OEMs commercialized fast-charge flooded batteries that reach 80% state of charge in one hour, narrowing the convenience gap with lithium at a 40% cost advantage. Medical-imaging shields employ 8-12 mm lead sheets as emerging markets expand cancer-treatment capacity. Marine batteries for small craft sustain a 2.0% CAGR, as anglers and pleasure-boat operators prioritize price over weight. The diversified application mix dampens volatility that could stem from automotive substitution.
Secondary material secured 62.65% of the 2025 supply and is projected to increase at a 2.29% CAGR to 2031, outstripping primary mining's slower trajectory. EU circular mandates alone divert 150,000-200,000 tons away from virgin metal, embedding recycled content as the default in regional production. North America reaches a 99% collection rate, feeding Ecobat's 450,000-ton annual throughput. Primary output clings to relevance where recycling systems lag, such as parts of Africa, and for ultra-high-purity grades used in specialty applications. Vedanta's zinc byproduct streams in India achieve sub-USD 1,000 cash costs, demonstrating that polymetallic synergies can still compete.
Urban-mining subsidies in China compress secondary cash costs to well below USD 900 per ton, exporting deflationary pressure worldwide. When LME prices dip under USD 2,000, high-cost mines in Canada or Australia idle capacity, reinforcing secondary dominance and nudging the lead market size toward a more circular structure.
The Lead Market Report is Segmented by Application (Ammunition, Batteries, Construction, Electronics, and More), Supply Source (Primary and Secondary), Product Form (Refined Lead, Lead Alloys, and More), End-User Industry (Automotive, Industrial Manufacturing, and More), and Geography (Asia-Pacific, North America, Europe, South America, and Middle East and Africa). The Market Forecasts are Provided in Terms of Volume (Tons).
Geography Analysis
Asia-Pacific captured 51.28% of 2025 volume and will pace growth at 2.99% through 2031. China's CNY 5 billion urban-mining subsidy program raised collection to 98% and secured 55-60% of global secondary output. India's EMPS lifted low-speed EV subsidies, supporting 1.5 million e-rickshaws that rely on lead packs 40-50% cheaper than lithium. ASEAN logistics fleets mirror the pattern, adopting three-wheelers for last-mile deliveries where daily mileage remains under 25 km. Japan and South Korea focus on high-purity refined metal, with Korea Zinc's Onsan complex achieving 92% recovery from polymetallic concentrates. Australia's Broken Hill curtailments sliced 30,000 tons of primary supply in 2025, nudging the region toward imported and recycled metal.
North America is fueled by a 99% battery collection rate and Ecobat's 17-facility network. EPA lead-service-line removal cuts plumbing demand, but channels recovered metal straight into smelters. Teck's Trail refinery unlocks 15,000 tons from zinc residues. Mexico's Monterrey battery hub uses recycled feedstock to meet USMCA content rules. PFAS compliance costs nevertheless weigh on primary smelters that rely on electrowinning.
In Europe, German OEMs test LFP starters but cold-weather issues slow rollout. Ecobat's UK and German sites avoid major PFAS retrofits, securing a USD 50-70 per ton cost edge over primary competitors. Russian volumes divert to domestic markets under sanctions, balancing regional supply. In South America, Brazilian replacement demand remains resilient, while the Middle East and Africa are experiencing growth owing to infrastructure projects requiring shielding and backup power.
- Battery Solutions LLC
- Canadian Metal North America Ltd.
- The Doe Run Company
- East Penn Manufacturing Company
- Ecobat
- EnerSys
- Glencore
- Gravita India Ltd
- Guangxi Nonferrous Metals
- Korea Zinc
- Nyrstar
- Teck Resources Limited
- Terrapure BR Ltd.
- Umicore
- Vedanta Resources (Hindustan Zinc)
Additional Benefits:
- The market estimate (ME) sheet in Excel format
- 3 months of analyst support
TABLE OF CONTENTS
1 Introduction
- 1.1 Study Assumptions & Market Definition
- 1.2 Scope of the Study
2 Research Methodology
3 Executive Summary
4 Market Landscape
- 4.1 Market Overview
- 4.2 Market Drivers
- 4.2.1 Booming lead-acid battery demand from data-center and 5G back-up systems
- 4.2.2 Resurgence of low-speed EVs (e-rickshaws, golf cars) in emerging Asia
- 4.2.3 Mandated minimum recycled-content rules in EU & US battery regulations
- 4.2.4 Multi-metal refinery retrofits unlocking latent primary-lead capacity
- 4.2.5 China's scrap-based "urban-mining" subsidies for secondary lead
- 4.3 Market Restraints
- 4.3.1 Accelerating OEM shift to lithium-iron-phosphate starter batteries
- 4.3.2 Strict PFAS limits raising operating costs for lead smelters
- 4.3.3 Chronic concentrate-grade decline driving CAPEX inflation
- 4.4 Value Chain Analysis
- 4.5 Porter's Five Forces
- 4.5.1 Threat of New Entrants
- 4.5.2 Bargaining Power of Buyers
- 4.5.3 Bargaining Power of Suppliers
- 4.5.4 Threat of Substitutes
- 4.5.5 Degree of Competition
- 4.6 Supply Analysis
- 4.7 Regulatory Policy Analysis
- 4.8 Trade Analysis
- 4.9 Price Trend Analysis
- 4.10 Production Cost Analysis
5 Market Size & Growth Forecasts
- 5.1 Application
- 5.1.1 Ammunition
- 5.1.2 Batteries
- 5.1.3 Construction
- 5.1.4 Electronics
- 5.1.5 Marine
- 5.1.6 Plumbing
- 5.1.7 Other Applications (Shielding, Chemical Processing, etc.)
- 5.2 Supply Source
- 5.2.1 Primary (Mining)
- 5.2.2 Secondary (Recycled)
- 5.3 Product Form
- 5.3.1 Refined Lead (Ingot)
- 5.3.2 Lead Alloys
- 5.3.3 Lead Oxide & Chemicals
- 5.3.4 Lead Concentrates
- 5.4 End-User Industry
- 5.4.1 Automotive
- 5.4.2 Energy & Utilities
- 5.4.3 Industrial Manufacturing
- 5.4.4 Construction & Infrastructure
- 5.4.5 Consumer Electronics
- 5.4.6 Defense
- 5.4.7 Maritime
- 5.4.8 Other End-user Industries (Chemicals, etc.)
- 5.5 Geography
- 5.5.1 Asia-Pacific
- 5.5.1.1 China
- 5.5.1.2 India
- 5.5.1.3 Japan
- 5.5.1.4 South Korea
- 5.5.1.5 ASEAN Countries
- 5.5.1.6 Rest of Asia-Pacific
- 5.5.2 North America
- 5.5.2.1 United States
- 5.5.2.2 Canada
- 5.5.2.3 Mexico
- 5.5.3 Europe
- 5.5.3.1 Germany
- 5.5.3.2 United Kingdom
- 5.5.3.3 France
- 5.5.3.4 Italy
- 5.5.3.5 Russia
- 5.5.3.6 Rest of Europe
- 5.5.4 South America
- 5.5.4.1 Brazil
- 5.5.4.2 Argentina
- 5.5.4.3 Rest of South America
- 5.5.5 Middle East and Africa
- 5.5.5.1 Saudi Arabia
- 5.5.5.2 United Arab Emirates
- 5.5.5.3 South Africa
- 5.5.5.4 Egypt
- 5.5.5.5 Rest of Middle East and Africa
- 5.5.1 Asia-Pacific
6 Competitive Landscape
- 6.1 Market Concentration
- 6.2 Strategic Moves
- 6.3 Market Share(%)/Ranking Analysis
- 6.4 Company Profiles (includes Global-level Overview, Market-level Overview, Core Segments, Financials as available, Strategic Information, Market Rank/Share for key companies, Products & Services, Recent Developments)
- 6.4.1 Battery Solutions LLC
- 6.4.2 Canadian Metal North America Ltd.
- 6.4.3 The Doe Run Company
- 6.4.4 East Penn Manufacturing Company
- 6.4.5 Ecobat
- 6.4.6 EnerSys
- 6.4.7 Glencore
- 6.4.8 Gravita India Ltd
- 6.4.9 Guangxi Nonferrous Metals
- 6.4.10 Korea Zinc
- 6.4.11 Nyrstar
- 6.4.12 Teck Resources Limited
- 6.4.13 Terrapure BR Ltd.
- 6.4.14 Umicore
- 6.4.15 Vedanta Resources (Hindustan Zinc)
7 Market Opportunities & Future Outlook
- 7.1 White-space & Unmet-Need Assessment
- 7.2 Expanding Lead Recycing Infrastructure


