
|
시장보고서
상품코드
2044090
우주 기술 시장 : 점유율 분석, 산업 동향 및 통계, 성장 예측(2026-2031년)Space Technology - Market Share Analysis, Industry Trends & Statistics, Growth Forecasts (2026 - 2031) |
||||||
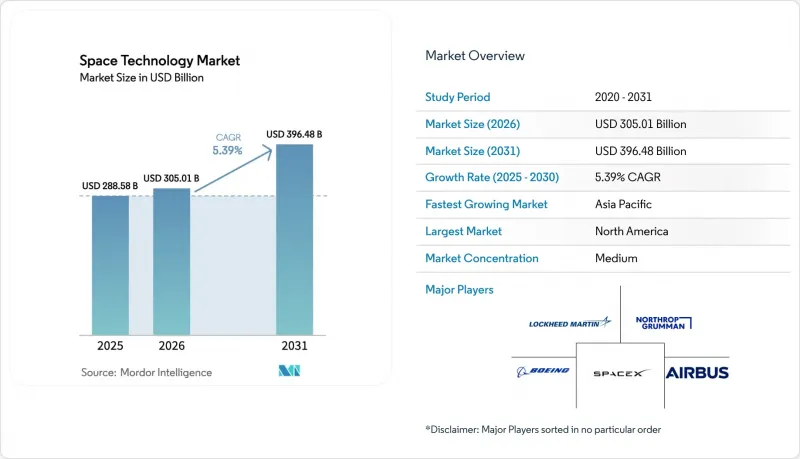
우주 기술 시장 규모는 2025년 2,885억 8,000만 달러, 2026년 3,050억 1,000만 달러에서 2031년까지 3,964억 8,000만 달러로 확대될 것으로 예측되고 있으며 2026년부터 2031년까지 연평균 복합 성장률(CAGR)은 5.39%를 나타낼 전망입니다.
민간 사업자들은 정부 중심이었던 이 분야의 양상을 바꾸어 저궤도(LEO) 광대역 위성 컨스텔레이션, 궤도 서비스, 우주여행으로 민간 자본을 유도하고 있습니다. 재사용 가능한 발사 시스템은 Kg당 비용을 낮추고, 소프트웨어 정의 위성이 고정형 페이로드를 대체하면서 국가 안보 관련 구매자는 소수의 고성능 위성 대신 장애에 강한 분산형 위성의 별자리를 조달하고 있습니다. 이러한 변화에 맞추어 설비투자를 하는 사업자들은 우주쓰레기 저감, 수출관리, 라이선싱에 대한 규제가 강화되는 가운데 새로운 수익원을 찾고 있습니다.
세계 우주 기술 시장 동향과 인사이트
재사용형 로켓을 통한 발사 비용의 급격한 감소
팔콘9 1단 로켓은 2025년 23번의 재비행을 달성하여 발사 단가를 미션당 약 2,800만 달러까지 낮추었습니다. 이를 통해 하드웨어가 대규모 개조 없이 반복적인 재진입 및 착륙 사이클을 견딜 수 있음을 입증했습니다. 로켓랩은 2024년 헬리콥터를 이용한 부스터 회수 방식을 도입하여 개보수 기간을 30일 이내로 단축함으로써 소형 위성 사업자에게 필요한 발사 빈도를 실현하였습니다. 국가 안보 관련 발사 7건을 수주한 블루오리진의 '뉴글렌'은 25회 비행을 목표로 설계되었으며, 대형 미션 1회당 가격을 5,000만 달러 미만으로 낮추는 것을 목표로 하고 있습니다. 비용 절감을 통해 위성을 보충할 수 있는 자금이 확보되고, 잦은 갱신 주기가 경제적으로 가능해져 설계부터 궤도 진입까지의 기간을 단축할 수 있습니다.
우주 프로그램에 대한 정부 투자 증가
NASA의 2026년 예산은 7% 증가한 272억 달러로, 아르테미스 계획의 달 물류, 지구과학 임무, 민간 승무원 수송 계약에 자금이 투입될 예정입니다. 유럽우주국(ESA)은 2027년까지 예산을 17% 증가한 175억 유로(198억 달러)로 책정하여 아리안 6호 발사, IRIS2 보안 통신별자리, 우주쓰레기 제로화 이니셔티브를 위한 자금을 확보했습니다. 인도는 우주국 예산을 12% 증가한 1,300억 루피(15억 6,000만 달러)로 확대하여, 가가나안 유인 비행 자금 조달과 민간 기업에 대한 발사 라이선스 라이선싱에 사용했습니다. 정부 지출은 더 이상 과학적인 목적에만 국한되지 않고, 이제는 상업용 광대역, 기후 감시, 국방 수준의 감시 체계를 지원하는 기반이 되고 있습니다.
궤도상의 잔해, 혼잡, 우주 교통 관리의 과제
미국 연방통신위원회(FCC)는 미국에서 허가된 우주선에 대해 궤도 이탈 허용 기간을 25년에서 5년으로 단축했지만, 해외에서의 집행은 불균등하여 컴플라이언스 불균형을 초래하고 있습니다. 유럽우주국(ESA)의 자발적인 '제로 데브리 헌장'은 2030년까지 데브리를 발생시키지 않는 임무를 목표로 하고 있지만, 능동적 제거를 위한 자금 조달은 여전히 불투명한 상태입니다. 아스트로스케일의 COSMIC 미션은 2026년 자기 도킹과 통제된 재진입을 시도합니다. 이것이 성공한다면, 의무적인 청소 작업의 비용 기준이 확립될 수 있습니다. 운영사업자들은 태양동기 궤도대에서의 회피작업 증가, 추진제 소비 및 운영수명 단축을 보고하고 있습니다.
부문 분석
페이로드 장비는 CAGR 6.17%로 다른 모든 하위 시스템을 능가하는 성장이 예상됩니다. 사업자들은 궤도에서 주파수 대역과 빔 패턴을 변경할 수 있는 재구성 가능한 트랜스폰더를 선호하고 있으며, 이는 시장 수요의 불확실성을 줄이고 추가적인 수익원을 창출할 수 있도록 돕습니다. 발사체 하드웨어는 2025년 매출의 31.28%를 차지하지만, 재사용형 로켓의 보급으로 가격이 낮은 수준에서 유지되고 있어 수익률 압박에 직면해 있습니다. 궤도 부문의 지상 네트워크는 클라우드 호스트형 Antenna-as-a-Service로 전환되고 있으며, 스코틀랜드와 오만에 신설되는 우주항구는 지역 수요 확보를 목표로 하고 있습니다. 소프트웨어 정의 위성은 광링크와 탑재 처리 기능을 통합하고 있으며, 설비 투자의 초점이 되고 있습니다.
이러한 전환으로 부스터에 비해 페이로드용 우주기술 시장 규모가 확대되는 한편, 소프트웨어 정의형 전자장비를 공급하는 기업들의 우주기술 시장 점유율도 상승하고 있습니다. 위성 간 광링크 제공업체, 3D 프린팅 RF 부품 제조업체, 탑재용 AI 칩 설계 업체들은 2020년 후반까지 지속될 수주 잔고에 대응하기 위해 사업 규모를 확장하고 있습니다.
민간 고객은 이미 시장 매출의 거의 절반을 차지하고 있으며, 정부 기관이나 군보다 빠르게 성장하고 있습니다. 디바이스 직접 연결형 광대역, 구독형 지구관측, 클라우드 중계 서비스는 기업에 예측 가능한 지속적인 수익원을 제공하고, 단일 정부 주요 계약을 대체할 수 있는 민간 자금 조달을 지원하고 있습니다. 방위 기관은 금액 기준으로는 여전히 중요하지만, 일정의 확실성을 확보하기 위해 발사 및 호스트 페이로드를 민간 제공업체에 위탁하는 경향이 증가하고 있습니다.
그 결과, 상업적 활동과 연계된 우주기술 시장 규모는 정부 프로그램보다 빠르게 성장하고 있으며, 이러한 수요를 포착한 기업들은 발사, 위성, 지상 부문, 분석을 하나의 계약으로 묶는 서비스를 통해 우주기술 시장에서 점유율을 확대되고 있습니다.
지역별 분석
북미는 국방부의 발사 계약, NASA의 지출, 그리고 캘리포니아, 콜로라도, 플로리다에 집적된 풍부한 벤처 자금을 배경으로 계속해서 선두를 유지하고 있습니다. 규제 당국, 특히 FCC(연방통신위원회)와 FAA(연방항공청)는 궤도 잔해 및 발사 안전에 관한 규정을 통해 개발 속도를 결정하고 있습니다. 캐나다는 달 게이트웨이 모듈로 협력하여 SAR(합성개구레이더) 위성 콘스텔레이션에 투자하고 있으며, 멕시코는 학계와 협력하여 국내 최초의 국산 위성 개발을 추진하고 있습니다.
아시아태평양은 인도가 상업적 발사를 자유화하고 중국이 세계에서 가장 바쁜 발사 계획을 실행하고 있기 때문에 지역별로 가장 높은 CAGR을 기록했습니다. 일본의 H3 로켓은 UAE와 국내 계약을 통해 비행을 재개했고, 한국의 누리 계획은 독자적인 발사 능력을 구축하고 있으며, 동남아시아 국가들은 발사대 시설과 지상 구간에 자금을 투입하고 있습니다. UAE와 사우디아라비아를 중심으로 한 중동 국가들은 경제 다변화와 국산 위성 제조 육성을 위해 수십억 달러 규모의 예산을 투입하고 있습니다.
유럽에서는 아리안 6호가 자율적인 대형 발사 능력을 회복하고, 향후 전개될 IRIS2 컨스텔레이션은 유럽이 전략적 자립을 추진하고 있음을 보여줍니다. 영국의 삭스포드 우주항구의 승인은 극궤도에 대한 기회를 열어주었고, ESA의 우주쓰레기 제로화 이니셔티브는 회원국 전체의 설계 표준에 영향을 미치고 있습니다. 아프리카와 남미는 아직 규모가 작지만 농업과 임업 모니터링을 지원하기 위해 지상 인프라와 카풀 미션에 투자하고 있습니다.
기타 특전:
- 엑셀 형식 시장 예측(ME) 시트
- 3개월간 애널리스트 지원
자주 묻는 질문
목차
제1장 서론
제2장 조사 방법
제3장 주요 요약
제4장 시장 구도
제5장 시장 규모와 성장 예측
제6장 경쟁 구도
제7장 시장 기회와 향후 전망
JHS 26.06.02The space technology market size is projected to expand from USD 288.58 billion in 2025 and USD 305.01 billion in 2026 to USD 396.48 billion by 2031, registering a CAGR of 5.39% between 2026 and 2031.

Commercial operators are reshaping what was once a government-centric domain, channelling private capital toward low Earth orbit (LEO) broadband constellations, in-orbit servicing, and space tourism. Reusable launch systems are compressing per-kilogram pricing, software-defined satellites are displacing fixed payloads, and national-security buyers are procuring resilient proliferated constellations instead of a handful of exquisite craft. Operators that align capital spending with these shifts are finding new revenue streams even as regulatory oversight around debris mitigation, export controls, and launch licensing tightens.
Global Space Technology Market Trends and Insights
Rapidly Falling Launch Costs Via Reusable Vehicles
Falcon 9 first stages completed 23 reflights in 2025, lowering marginal launch prices to roughly USD 28 million per mission and proving that hardware can survive repeated entry and landing cycles without major refurbishment. Rocket Lab introduced helicopter-assisted booster recovery in 2024, cutting refurbishment time below 30 days and giving small-satellite operators the cadence they need. Blue Origin's New Glenn, awarded seven national-security launches, is designed for 25 flights and targets sub-USD 50 million pricing per heavy mission. Cost compression frees capital for satellite replenishment, making frequent refresh cycles economical and shortening design-to-orbit timelines.
Rising Government Investments in Space Programs
NASA's FY 2026 appropriation rose 7% to USD 27.2 billion, funding Artemis lunar logistics, earth-science missions, and commercial crew contracts. The European Space Agency (ESA) secured a 17% uplift to EUR 17.5 billion (USD 19.8 billion) through 2027, ring-fencing funds for Ariane 6 flights, the IRIS2 secure-communications constellation, and zero-debris initiatives. India boosted its Department of Space budget 12% to INR 130 billion (USD 1.56 billion) to finance the Gaganyaan crewed flight and open launch licenses to private firms. State spending is no longer solely science-driven; it now anchors commercial broadband, climate monitoring, and defense-grade surveillance.
Orbital Debris, Congestion, And Space-Traffic Management Gaps
The FCC shortened permissible deorbit time from 25 years to 5 years for U.S.-licensed craft, but enforcement abroad is patchy, leading to asymmetric compliance. ESA's voluntary Zero Debris Charter seeks debris-neutral missions by 2030, yet funding for active removal remains uncertain. Astroscale's COSMIC mission will attempt magnetic docking and controlled re-entry in 2026; success could set cost benchmarks for compulsory cleanup. Operators report rising avoidance manoeuvres in sun-synchronous bands, burning propellant and shortening service life.
Other drivers and restraints analyzed in the detailed report include:
- Miniaturization Enabling Affordable Satellite Constellations
- National-Security Focus on Resilient Space Architectures
- High Up-Front CAPEX And R&D Expenditure
For complete list of drivers and restraints, kindly check the Table Of Contents.
Segment Analysis
Payload equipment is on track to outgrow every other subsystem at a 6.17% CAGR. Operators favour reconfigurable transponders that can shift spectrum or beam patterns in orbit, mitigating market-demand uncertainty and supporting incremental revenue streams. Launch vehicle hardware, despite holding 31.28% of 2025 revenue, faces margin pressure as reusable rockets standardize low pricing. Orbit segment ground networks are pivoting to cloud-hosted antenna-as-a-service, while new spaceports in Scotland and Oman aim to capture regional demand. Software-defined satellites integrate optical links and on-board processing, making them the focal point of capital spending.
The transition boosts the space technology market size for payloads relative to boosters while lifting the space technology market share of firms that supply software-defined electronics. Optical inter-satellite link providers, 3D-printed RF-component manufacturers, and on-board AI-chip designers are scaling to meet order books that stretch into the latter half of the decade.
Commercial customers already account for nearly half of market revenue and are growing faster than civil agencies and militaries. Direct-to-device broadband, subscription earth-imaging, and cloud relay services give enterprises predictable recurring income streams, supporting private financing in lieu of single government anchor contracts. Defense agencies remain critical in absolute dollars yet increasingly outsource launches and hosted payloads to commercial providers for schedule certainty.
Consequently, the space technology market size tied to commercial activity is rising faster than government programs, and companies capturing that demand are widening their space technology market share through service bundling launch, satellite, ground segment, and analytics under one contract.
The Space Technology Market Report is Segmented by Subsystem (Orbit Segment, Launch Platform, and Launch Vehicle, Payload), End-Use (Civil, Commercial, and Military and Intelligence), Application (Communication, Earth Observation, Navigation and Positioning, Space Exploration, and More), Orbit Type (LEO, MEO, and More), and Geography. The Market Forecasts are Provided in Terms of Value (USD).
Geography Analysis
North America retains leadership on the strength of Pentagon launch contracts, NASA spending, and deep venture pools clustered in California, Colorado, and Florida. Regulatory agencies, notably the FCC and FAA, shape deployment cadences through orbital-debris and launch-safety rules. Canada partners on lunar Gateway modules and invests in SAR constellations, while Mexico advances its first domestically built satellite in collaboration with academic institutions.
Asia-Pacific delivers the highest regional CAGR as India liberalizes commercial launches and China executes the world's busiest manifest. Japan's H3 rocket returns to flight with UAE and domestic contracts, South Korea's Nuri program builds sovereign lift capacity, and Southeast Asian nations fund pad facilities and ground segments. Middle Eastern governments, led by the UAE and Saudi Arabia, inject multi-billion-dollar budgets to diversify economies and cultivate indigenous satellite manufacturing.
Europe's Ariane 6 restores autonomous heavy-lift capacity, and the forthcoming IRIS2 constellation underscores the continent's push for strategic independence. United Kingdom certification of SaxaVord Spaceport opens polar-orbit opportunities, while ESA's zero-debris initiatives influence design rules across member states. Africa and South America remain smaller but invest in ground infrastructure and rideshare missions to support agriculture and forestry monitoring.
- Airbus SE
- Ball Corporation
- Boeing Defense, Space and Security
- China Aerospace Science and Technology Corp. (CASC)
- Lockheed Martin Corp.
- Northrop Grumman Corp.
- Space Exploration Technologies Corp. (SpaceX)
- Thales Group
- Viasat, Inc.
- Intelsat SA
- Safran SA
- Honeywell International Inc.
- SES S.A.
- L3Harris Technologies, Inc.
- Rocket Lab USA, Inc.
- Blue Origin, LLC
- Mitsubishi Heavy Industries, Ltd.
- Maxar Technologies Inc.
- Sierra Space Corp.
- Relativity Space, Inc.
- Astroscale Holdings Inc.
- Planet Labs PBC
- OneWeb Ltd.
Additional Benefits:
- The market estimate (ME) sheet in Excel format
- 3 months of analyst support
TABLE OF CONTENTS
1 INTRODUCTION
- 1.1 Study Assumptions and Market Definition
- 1.2 Scope of the Study
2 RESEARCH METHODOLOGY
3 EXECUTIVE SUMMARY
4 MARKET LANDSCAPE
- 4.1 Market Overview
- 4.2 Market Drivers
- 4.2.1 Rising Government Investments in Space Programs
- 4.2.2 Miniaturization Enabling Affordable Satellite Constellations
- 4.2.3 Growing Demand for High-Throughput Satellite Broadband
- 4.2.4 Commercialization of Space Tourism and In-Orbit Services
- 4.2.5 National-Security Focus on Resilient Space Architectures
- 4.2.6 Rapidly Falling Launch Costs via Reusable Vehicles
- 4.3 Market Restraints
- 4.3.1 High Up-Front CAPEX and R&D Expenditure
- 4.3.2 Orbital Debris, Congestion, and Space-Traffic Management Gaps
- 4.3.3 Regulatory Bottlenecks and ITAR Export Controls
- 4.3.4 Limited Launch Window and Pad Capacity
- 4.4 Industry Value-Chain Analysis
- 4.5 Regulatory Landscape
- 4.6 Technological Outlook
- 4.7 Porter's Five Forces Analysis
- 4.7.1 Bargaining Power of Suppliers
- 4.7.2 Bargaining Power of Buyers
- 4.7.3 Threat of New Entrants
- 4.7.4 Threat of Substitutes
- 4.7.5 Competitive Rivalry
- 4.8 Impact of Macroeconomic Factors on the Market
- 4.9 Investment Analysis
- 4.10 Key Use Cases and Case Studies
5 MARKET SIZE AND GROWTH FORECASTS (VALUE)
- 5.1 By Subsystem
- 5.1.1 Orbit Segment
- 5.1.2 Launch Platform
- 5.1.3 Launch Vehicle
- 5.1.4 Payload
- 5.2 By End-Use
- 5.2.1 Civil (Government Space Agencies)
- 5.2.2 Commercial
- 5.2.3 Military and Intelligence
- 5.3 By Application
- 5.3.1 Communication
- 5.3.2 Earth Observation
- 5.3.3 Navigation and Positioning
- 5.3.4 Space Exploration / Science Missions
- 5.3.5 Space Tourism and In-Orbit Services
- 5.4 By Orbit Type
- 5.4.1 Low Earth Orbit (LEO)
- 5.4.2 Medium Earth Orbit (MEO)
- 5.4.3 Geostationary Orbit (GEO)
- 5.4.4 Highly Elliptical and Beyond GEO
- 5.5 By Geography
- 5.5.1 North America
- 5.5.1.1 United States
- 5.5.1.2 Canada
- 5.5.1.3 Mexico
- 5.5.2 South America
- 5.5.2.1 Brazil
- 5.5.2.2 Argentina
- 5.5.2.3 Rest of South America
- 5.5.3 Europe
- 5.5.3.1 United Kingdom
- 5.5.3.2 Germany
- 5.5.3.3 France
- 5.5.3.4 Italy
- 5.5.3.5 Spain
- 5.5.3.6 Nordics
- 5.5.3.7 Rest of Europe
- 5.5.4 Middle East
- 5.5.4.1 Saudi Arabia
- 5.5.4.2 United Arab Emirates
- 5.5.4.3 Turkey
- 5.5.4.4 Rest of Middle East
- 5.5.5 Africa
- 5.5.5.1 South Africa
- 5.5.5.2 Egypt
- 5.5.5.3 Nigeria
- 5.5.5.4 Rest of Africa
- 5.5.6 Asia-Pacific
- 5.5.6.1 China
- 5.5.6.2 India
- 5.5.6.3 Japan
- 5.5.6.4 South Korea
- 5.5.6.5 ASEAN
- 5.5.6.6 Australia
- 5.5.6.7 New Zealand
- 5.5.6.8 Rest of Asia-Pacific
- 5.5.1 North America
6 COMPETITIVE LANDSCAPE
- 6.1 Market Concentration
- 6.2 Strategic Moves
- 6.3 Market Share Analysis
- 6.4 Company Profiles (includes Global Level Overview, Market Level Overview, Core Segments, Financials as available, Strategic Information, Market Rank/Share, Products and Services, Recent Developments)
- 6.4.1 Airbus SE
- 6.4.2 Ball Corporation
- 6.4.3 Boeing Defense, Space and Security
- 6.4.4 China Aerospace Science and Technology Corp. (CASC)
- 6.4.5 Lockheed Martin Corp.
- 6.4.6 Northrop Grumman Corp.
- 6.4.7 Space Exploration Technologies Corp. (SpaceX)
- 6.4.8 Thales Group
- 6.4.9 Viasat, Inc.
- 6.4.10 Intelsat SA
- 6.4.11 Safran SA
- 6.4.12 Honeywell International Inc.
- 6.4.13 SES S.A.
- 6.4.14 L3Harris Technologies, Inc.
- 6.4.15 Rocket Lab USA, Inc.
- 6.4.16 Blue Origin, LLC
- 6.4.17 Mitsubishi Heavy Industries, Ltd.
- 6.4.18 Maxar Technologies Inc.
- 6.4.19 Sierra Space Corp.
- 6.4.20 Relativity Space, Inc.
- 6.4.21 Astroscale Holdings Inc.
- 6.4.22 Planet Labs PBC
- 6.4.23 OneWeb Ltd.
7 MARKET OPPORTUNITIES AND FUTURE OUTLOOK
- 7.1 White-Space and Unmet-Need Assessment
