
|
시장보고서
상품코드
2044145
빌딩 자동화 시스템 시장 : 점유율 분석, 산업 동향 및 통계, 성장 예측(2026-2031년)Building Automation System - Market Share Analysis, Industry Trends & Statistics, Growth Forecasts (2026 - 2031) |
||||||
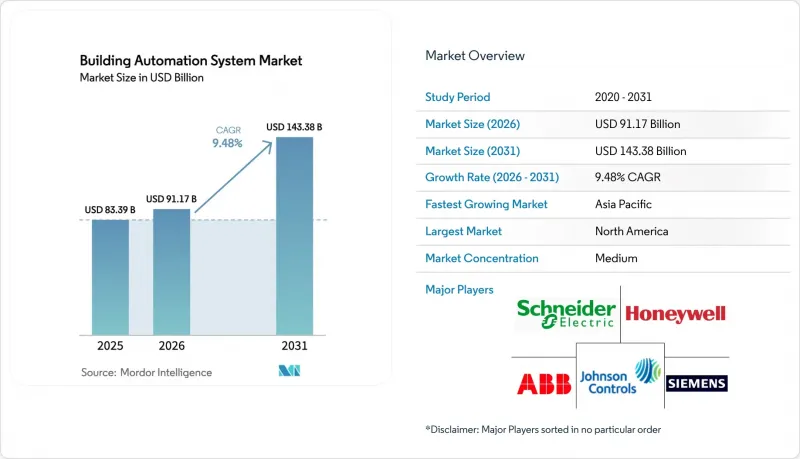
빌딩 자동화 시스템 시장 규모는 2025년 833억 9,000만 달러, 2026년 911억 7,000만 달러에서 2031년까지 1,433억 8,000만 달러로 확대될 것으로 예측되고 있으며 2026-2031년까지 CAGR 9.48%를 기록할 전망입니다.
규제 압력 증가, 센서 가격의 하락, 클라우드 분석 기술의 성숙으로 빌딩 제어 시스템은 단순한 독립형 공조(HVAC) 타이머에서 기업 전체를 아우르는 데이터가 풍부한 플랫폼으로 변모하고 있습니다. 시설 소유주들은 더 엄격한 에너지 규제를 준수하기 위해 리노베이션을 가속화하고 있으며, 구독형 소프트웨어 모델은 소규모 시설 포트폴리오의 도입 장벽을 낮추고 있습니다. 각 벤더들은 서비스 콜을 줄이고 운영 데이터로 수익을 창출하는 예측 분석 기능을 패키징하고 있으며, 전력회사들은 더 높은 리베이트를 제공함으로써 수요반응 프로그램의 매력을 높이고 있습니다. 독점적인 하드웨어에서 개방적이고 안전한 프로토콜로의 전환은 상업시설, 공공시설, 심지어 단독 주택에 이르기까지 더 광범위한 도입에 사용되는 토대를 마련하고 있습니다.
세계 빌딩 자동화 시스템 시장 동향 및 인사이트
엄격한 에너지 효율 규제와 그린 빌딩 기준
새로운 건축 기준에 따라 에너지 절약은 '선택'에서 '의무'로 바뀌고 있습니다. 2024년판 국제에너지절약기준(IECC)에서는 공조(HVAC) 셋백 및 환기 관련 규정이 강화되고, 독일의 2024년 건축에너지법(Gebaudeenergiegesetz)에서는 1,000평방미터 이상의 비주거용 건축물에 대한 자동화 도입이 의무화되었습니다. 의무화되어 있습니다. 오스트리아의 초기 시범사업에서 스마트 준비도 지표(SRI)가 70점 이상인 건물은 4-7%의 임대료 프리미엄을 받고 있습니다. 캘리포니아주 'Title 24' 개정에 따라 데이터센터와 소매점은 전력계통으로부터 신호를 받은 후 10분 이내에 피크 부하의 15%를 감축해야 합니다. ISO 52120과 같은 인증이 확산됨에 따라 보험사 및 금융기관은 자동화 도입 정도를 그린 파이낸스 가격 책정에 반영하고 있으며, 컴플라이언스에 실질적인 금전적 가치를 부여하고 있습니다.
IoT와 스마트 커넥티드 디바이스 보급 확대
저가의 반도체와 개방형 API로 인해 과거 고도의 제어 시스템에 수반되던 프리미엄이 사라지고 있습니다. 'Matter 1.4'는 800개 이상의 인증된 장치 간 상호운용성을 구현하여 관리자는 미들웨어를 통하지 않고도 여러 브랜드의 온도조절기, 조명, 액세스 배지를 조합하여 사용할 수 있게 되었습니다. Thread의 메시 네트워크는 밀집된 타워 내에서도 무선 범위를 100m까지 확장하여, 싱가포르의 파일럿 사업에서 배관 공사의 노동력을 40% 절감했습니다. 허니웰의 Azure 기반 Forge 플랫폼은 최대 2주까지 장애를 예측할 수 있어 예기치 못한 다운타임을 25%까지 줄일 수 있습니다. BACnet 게이트웨이가 내장된 통합 Wi-Fi 6E 액세스 포인트는 배선을 간소화하고 실시간 점유 맵을 기업의 IT 대시보드에 통합할 수 있습니다.
높은 초기 투자금액과 긴 회수기간
종합적인 개보수 공사는 평방피트당 8-15달러, 10만 평방피트 규모의 사무실의 경우 100만 달러의 비용이 들기 때문에 많은 건물주들이 자금 조달에 어려움을 겪고 있습니다. 유럽의 조사에 따르면, 폴란드 등 전력 보조금 대상 지역에서는 1평방미터당 10유로의 비용이 들며, 회수기간은 4년입니다. 소규모 소유자는 그린론을 이용할 수 없고, 요금체계와 날씨의 변화로 인해 ROI 계산이 불안정합니다. 성과보수형 계약은 설비투자를 벤더 측으로 이전하는 반면, 법적 복잡성을 증가시키기 때문에 신중한 경영진은 이를 기피하고 있습니다.
부문 분석
소프트웨어 시장은 2031년까지 연평균 복합 성장률(CAGR) 10.07%를 나타낼 것으로 예측되며, 벤더들은 단일 사용권에서 고장 감지 및 에너지 벤치마킹을 통해 수익을 창출하는 정기적인 구독 모델로 전환하고 있습니다. 현재 모니터링 제품군에는 강화 학습 모듈이 내장되어 있어 쾌적성에 대한 불만이 발생하기 전에 냉각기 스테이징을 최적화하고 밸브의 드리프트를 감지합니다. 48만 곳에서 운영 중인 슈나이더일렉트릭의 '에코스트럭처'는 평방피트당월0.05-0.15달러를 부과하고 있어, 이미 도입된 설비를 안정적 수익원으로 전환하고 있습니다. 2025년에도 센서와 컨트롤러가 여전히 필수적이기 때문에 하드웨어는 빌딩 자동화 시스템 시장 점유율의 48.43%를 차지하지만, 상품화로 인해 수익률은 감소하고 있습니다. 원격 진단으로 현장 출장 대응의 필요성이 감소함에 따라 서비스 부문은 안정적인 한 자릿수 중반의 성장세를 유지하고 있습니다.
클라우드 호스팅을 통해 서버 조달 비용을 절감할 수 있기 때문에 소프트웨어 관련 빌딩 자동화 시스템 시장 규모는 급성장할 것으로 예측됩니다. 각 벤더들은 새로운 컨트롤러를 판매할 때마다 다년 계약의 분석 서비스를 번들로 제공하고 있으며, 시설의 유틸리티 비용 절감에 사용한 인센티브를 일치시키고 있습니다. IT와 OT 부문에 모두 정통한 독립적인 통합업체들이 기술 격차를 메우고 있으며, 타사 센서를 벤더의 대시보드에 통합하기 위해 고액의 일당을 청구하고 있습니다. 예측 기간 동안 소프트웨어의 높은 매출 총이익률은 기업 가치를 높이고, AI 스타트업의 보완적 인수를 더욱 촉진할 것으로 보입니다.
HVAC 제어는 2025년 매출 점유율 38.51%를 차지해 빌딩 자동화 시스템 시장의 근간이 되며, 에너지 관리 모듈은 CAGR 10.17%로 빠르게 성장하고 있습니다. 현재 미국 18개 주의 전력회사는 5분마다 가격 신호를 발송하고 있으며, 자동 응답을 통해 시설의 광열비를 15-25% 절감할 수 있습니다. 조명 제어는 특히 유리로 둘러싸인 고층 건물에서 달력에 의한 조광에서 센서에 의한 자연광 이용으로 전환되고 있습니다. 보안, 출입통제, 생명안전 플랫폼이 통합되고 있으며, NFPA 72에 규정된 바와 같이 화재경보기가 작동하면 HVAC에 의한 배연과 출구의 잠금 해제가 동시에 실행되도록 되어 있습니다.
경계가 모호해지는 가운데, 통합 대시보드를 통해 시설 관리자는 열부하, 전력 소비량, 입주자 수를 한 눈에 파악할 수 있게 되었습니다. 이러한 융합을 통해 빌딩 제어는 'HVAC의 부가 기능'이라는 개념에서 종합적인 운영 기술 스택으로 재정의되고 있습니다. CFO가 배출량 공개와 임원 보수를 연동하여 분석 데이터를 기계실에서 임원실로 가져가면서 에너지 관리 툴을 대상으로 한 빌딩 자동화 시스템 시장 규모는 계속 확대될 것으로 보입니다. 전면적인 시스템 업데이트가 아닌 모듈형 애드온을 제공하는 벤더들이 리노베이션 프로젝트를 수주하고 있으며, SaaS 가격 책정을 통해 고객은 전력 계측부터 시작해서 나중에 조명이나 보안 기능을 추가할 수 있도록 하고 있습니다.
지역별 분석
북미는 2025년 매출의 34.33%를 차지했습니다. 이는 2024년판 IECC와 곧 시행될 Title 24의 개정으로 인해 자동화가 컴플라이언스 체크리스트에 포함될 것으로 예상되기 때문입니다. ASHRAE 90.1-2022는 2019년 기준치 대비 8.9%의 에너지 절감을 약속하고 있으며, 이에 따라 기업 캠퍼스에서는 냉수 플랜트 현대화가 진행되고 있습니다. 캐나다의 국가 에너지 법규는 3,000평방미터 이상의 건물에 제어 시스템 설치를 의무화하고 있으며, 토론토의 지자체 인센티브는 프로젝트 비용의 최대 25%를 보조하고 있습니다. 멕시코는 낮은 관세로 인해 뒤쳐져 있지만, 모회사의 ESG 감사를 충족시키기 위해 근해의 신설 공장에 자동화를 도입하고 있습니다. 시운전 업무의 인력 부족은 여전히 병목 현상으로 공사 기간을 연장하고 서비스 요금의 상승을 초래하고 있습니다.
아시아태평양은 CAGR 9.86%로 가장 빠르게 성장하는 지역입니다. 중국의 제1차 3차 5개년 계획에서 스마트시티 기반 구축에 690억 달러를 투자하고, 그 중 약 12%를 베이징, 상하이, 심천의 빌딩 제어 시스템에 투자하고 있습니다. 인도의 '스마트시티 미션'에서는 1만 평방미터 이상의 정부 및 상업시설에 자동화 도입을 의무화하고 있으며, 일본에서는 재실 상황에 따른 공조 제어(HVAC)를 통해 20%의 에너지 절감을 목표로 하는 파일럿 사업에 자금을 지원하고 있습니다. 호주의 '2025 국가 건축 기준'은 2,000평방미터 이상의 상업용 건물에 자동화 도입을 의무화하고 있으며, 싱가포르의 '그린마크' 제도는 인증된 부동산의 재판매 가치를 높여줍니다. 그러나 분절된 공급망과 지역별 기준 차이로 인해 시장 진입이 복잡해지고 있습니다.
유럽에서는 강력한 정책적 지원이 이루어지고 있습니다. '에너지 성능에 관한 건축물 지침(EPBD)' 개정으로 2024년까지 290kW를 초과하는 비주거시설에 건물 자동화 및 제어 시스템 도입이 의무화되며, 2029년까지 70kW로 하향 조정됩니다. 프랑스에서는 2025년 1월까지 도입이 의무화되어 있으며, 독일에서는 도입이 늦어지는 부동산에 대해 1건당 5만 유로(58,145.62달러)의 벌금이 부과될 수 있습니다. '호라이즌 유럽'의 보조금으로 스페인, 폴란드, 그리스에서 실증 실험이 가속화되고 있으며, '스마트 준비도 지표'는 자동화의 깊이와 부동산 평가액을 연결하고 있습니다. 동유럽은 보조금 전력 공급과 녹색 금융의 제한된 상황으로 인해 뒤쳐져 있지만, 2027년까지 100억 유로(116억 3,000만 달러)의 결속 기금이 에너지 개조에 투입될 예정입니다.
중동에서는 다른 지역을 능가하는 기세를 보이고 있습니다. 두바이의 70억 디르함(19억 1,000만 달러) 규모의 스마트그리드 계획은 1만 평방미터 이상의 건물에 대해 건물 단위의 대응을 의무화하고 있으며, 이를 통해 수요를 확실히 창출하고 있습니다. 지멘스가 아랍에미리트에서 60개 건물을 개조한 결과, 27%의 에너지 절감과 4년 이내에 투자 회수율을 달성하여 주변 국가들의 성공사례가 되고 있습니다. 사우디의 '딜리야 게이트' 계획은 BACnet Secure Connect 도입에 미화 632억 달러를 투자하여 2025년까지 전력망 자동화율 40%를 목표로 하고 있습니다. 남미와 아프리카는 여전히 개발 단계에 있습니다. 브라질의 'PROCEL Edifica'와 남아공의 세제 혜택이 주요 도시 지역 수요를 뒷받침하고 있지만, 전국적인 추진력은 부족합니다.
기타 혜택
- 엑셀 형태 시장 예측(ME) 시트
- 3개월간 애널리스트 지원
자주 묻는 질문
목차
제1장 서론
제2장 조사 방법
제3장 주요 요약
제4장 시장 구도
제5장 시장 규모와 성장 예측
제6장 경쟁 구도
제7장 시장 기회와 향후 전망
JHS 26.06.02The Building automation system market size is projected to expand from USD 83.39 billion in 2025 and USD 91.17 billion in 2026 to USD 143.38 billion by 2031, registering a 9.48% CAGR between 2026 and 2031.

Rising regulatory pressure, falling sensor prices, and maturing cloud analytics are turning building controls from isolated HVAC timers into enterprise-wide, data-rich platforms. Facility owners are accelerating retrofits to comply with tighter energy codes, while subscription software models lower the entry barrier for small portfolios. Vendors are bundling predictive analytics that cut service calls and monetize operational data, and utilities are sweetening demand-response programs with higher rebates. The shift from proprietary hardware toward open, secure protocols is setting the stage for broader adoption across commercial, institutional, and even single-family housing stock.
Global Building Automation System Market Trends and Insights
Stringent Energy Efficiency Regulations And Green Building Codes
Fresh codes are turning energy reduction from a choice into a mandate. The 2024 International Energy Conservation Code tightened HVAC setback and ventilation rules, while Germany's 2024 Gebaudeenergiegesetz requires automation in non-residential buildings above 1,000 m2. Buildings that exceed a 70-point Smart Readiness Indicator in early Austrian pilots enjoy 4-7% rental premiums. California's Title 24 update obliges data centers and retailers to drop 15% of peak load within ten minutes of a grid signal. As certifications such as ISO 52120 gain momentum, insurers and lenders are using automation depth to price green finance, effectively putting a hard dollar value on compliance.
Growing Adoption of IoT And Smart Connected Devices
Low-cost silicon and open APIs are dissolving the premium once attached to sophisticated controls. Matter 1.4 enabled interoperability across 800-plus certified devices, letting managers mix thermostats, lighting, and access badges from multiple brands without middleware. Thread's mesh network stretches wireless range to 100 m in dense towers, shaving conduit labor by 40% in Singapore pilots. Honeywell's Azure-enabled Forge platform now predicts failures up to two weeks ahead, cutting unplanned downtime by 25%. Converged Wi-Fi 6E access points with embedded BACnet gateways simplify wiring and make real-time occupancy maps part of corporate IT dashboards.
High Upfront Capital Expenditure And Long Payback Periods
Comprehensive retrofits can cost USD 8-15 per ft2, pushing a 100,000-ft2 office into a USD 1 million outlay that many landlords struggle to finance. European studies show EUR 10 per m2 spend with four-year paybacks in subsidized-electricity zones such as Poland. Smaller owners lack access to green loans, and ROI calculations wobble with changing tariffs and weather. Pay-for-performance contracts shift capex to vendors but add legal complexity that cautious managers resist.
Other drivers and restraints analyzed in the detailed report include:
- Demand for Energy Cost Savings And Sustainability Targets
- Proliferation of Smart City Initiatives And Government Incentives
- Lack Of Interoperable Standards Across Legacy Systems
For complete list of drivers and restraints, kindly check the Table Of Contents.
Segment Analysis
Software is recording a 10.07% CAGR through 2031 as vendors transition from one-time licenses to recurring subscriptions that monetize fault detection and energy benchmarking. Supervisory suites now embed reinforcement-learning modules that optimize chiller staging and flag valve drift before comfort complaints arise. Schneider Electric's EcoStruxure, active in 480,000 sites, charges at USD 0.05-0.15 per ft2 monthly, turning the installed base into an annuity. Hardware still dominates the Building automation system market share at 48.43% in 2025 because sensors and controllers remain mandatory, yet commoditization is eroding margins. Services are steady mid-single-digit growers as remote diagnostics lessen the need for on-site truck rolls.
The Building automation system market size attached to software is projected to grow sharply because cloud hosting sidesteps server procurement costs. Vendors bundle multiyear analytics contracts with every new controller, aligning incentives to cut a facility's utility bills. Independent integrators that master both IT and OT domains are filling skill gaps, charging premium day rates to stitch third-party sensors into vendor dashboards. Over the forecast horizon, software's higher gross margin will nudge corporate valuations, spurring more tuck-in acquisitions of AI startups.
HVAC controls, at 38.51% revenue share in 2025, remain the backbone of the Building automation system market, but energy management modules are racing ahead at a 10.17% CAGR. Utilities in 18 U.S. states now dispatch five-minute price signals, and automated response can shave 15-25% of a site's bill. Lighting controls are shifting from calendar-based dimming to sensor-driven daylight harvesting, especially in glass-heavy towers. Security, access, and life-safety platforms are converging, enabling a fire alarm to cue HVAC smoke purge and unlock exits simultaneously, as stipulated by NFPA 72.
As boundaries blur, integrated dashboards give facility managers a single view of thermal loads, kWh spend, and occupant counts. That convergence is redefining building controls from "HVAC plus extras" into holistic operational technology stacks. The Building automation system market size for energy management tools will keep expanding as CFOs link emissions disclosures to executive compensation, pushing analytics from plant rooms into the boardroom. Vendors offering modular add-ons rather than forklift upgrades are winning retrofits, and SaaS pricing lets customers start with power metering and layer on lighting or security later.
The Building Automation System Market Report is Segmented by Component (Hardware, Software, and Services), System Type (HVAC Control, Lighting Control, and More), Communication Technology (Wired, and Wireless), Installation Type (New-Build, and Retrofit), End User (Residential, Commercial, Industrial, and Institutional), and Geography (North America, Europe, and More). The Market Forecasts are Provided in Terms of Value (USD).
Geography Analysis
North America captured 34.33% of 2025 revenue, buoyed by the 2024 IECC and upcoming Title 24 updates that hard-wire automation into compliance checklists. ASHRAE 90.1-2022 promises 8.9% energy savings over the 2019 baseline, pushing corporate campuses to modernize chilled-water plants. Canada's National Energy Code mandates controls for buildings above 3,000 m2, and municipal incentives in Toronto cover up to 25% of project costs. Mexico lags due to lower tariffs but is seeing automation embedded in new near-shore factories to satisfy parent-company ESG audits. Labor shortages in commissioning trades remain a bottleneck, stretching timelines and propping up service rates.
Asia Pacific is the fastest-growing territory at a 9.86% CAGR. China's five-year plan steers USD 69 billion toward smart-city layers, reserving roughly 12% for building controls in Beijing, Shanghai, and Shenzhen. India's Smart Cities Mission mandates automation for government and commercial properties over 10,000 m2, while Japan funds pilots that target 20% savings through occupancy-based HVAC. Australia's 2025 National Construction Code embeds automation in commercial buildings above 2,000 m2, and Singapore's Green Mark raises resale values for rated properties. Fragmented supply chains and divergent local standards, however, create go-to-market complexity.
Europe enjoys strong policy tailwinds. The EPBD recast forces Building Automation and Control Systems in non-residential sites over 290 kW by 2024, dropping to 70 kW by 2029. France requires installation by January 2025, and Germany can fine laggards EUR 50,000 (USD 58,145.62) per property. Horizon Europe subsidies accelerate demos in Spain, Poland, and Greece, while the Smart Readiness Indicator links automation depth to property valuation. Eastern Europe trails due to subsidy electricity and limited green financing, yet cohesion funds of EUR 10 billion (USD 11.63 billion) through 2027 are earmarked for energy retrofits.
The Middle East shows outsized momentum. Dubai's AED 7 billion (USD 1.91 billion) smart-grid blueprint mandates building-level response for structures above 10,000 m2, baking demand into the pipeline. Siemens' retrofit of 60 UAE buildings confirmed a 27% energy cut and sub-four-year payback, setting proof points for neighbors. Saudi Arabia's Diriyah Gate channels USD 63.2 billion into BACnet Secure Connect deployments, aiming for 40% grid automation by 2025. South America and Africa remain nascent; Brazil's PROCEL Edifica and South Africa's tax incentives pick up the slack in major metros but lack nationwide impetus.
- Honeywell International Inc.
- Siemens AG
- Johnson Controls International plc
- Schneider Electric SE
- ABB Ltd
- Robert Bosch GmbH
- Mitsubishi Electric Corporation
- Carrier Global Corporation
- Trane Technologies plc
- Legrand SA
- Cisco Systems Inc.
- Hubbell Incorporated
- Delta Controls Inc.
- Lutron Electronics Co., Inc.
- Crestron Electronics, Inc.
- Distech Controls Inc.
- Leviton Manufacturing Co., Inc.
- Belimo Holding AG
- Automated Logic Corporation (Carrier)
Additional Benefits:
- The market estimate (ME) sheet in Excel format
- 3 months of analyst support
TABLE OF CONTENTS
1 INTRODUCTION
- 1.1 Study Assumptions and Market Definition
- 1.2 Scope of the Study
2 RESEARCH METHODOLOGY
3 EXECUTIVE SUMMARY
4 MARKET LANDSCAPE
- 4.1 Market Overview
- 4.2 Market Drivers
- 4.2.1 Stringent Energy Efficiency Regulations and Green Building Codes
- 4.2.2 Growing Adoption of IoT and Smart Connected Devices
- 4.2.3 Demand for Energy Cost Savings and Sustainability Targets
- 4.2.4 Proliferation of Smart City Initiatives and Government Incentives
- 4.2.5 Integration of Digital Twin Technology for Predictive Building Operations
- 4.2.6 Hybrid Work Models Driving Occupancy-Based Space Optimization
- 4.3 Market Restraints
- 4.3.1 High Upfront Capital Expenditure and Long Payback Periods
- 4.3.2 Lack of Interoperable Standards Across Legacy Systems
- 4.3.3 Escalating Cybersecurity and Data Privacy Concerns Delaying Projects
- 4.3.4 Shortage of Skilled BAS Commissioning Professionals
- 4.4 Impact of Macroeconomic Factors
- 4.5 Industry Value Chain Analysis
- 4.6 Regulatory Landscape
- 4.7 Technology Analysis
- 4.8 Porter's Five Forces Analysis
- 4.8.1 Bargaining Power of Suppliers
- 4.8.2 Bargaining Power of Buyers
- 4.8.3 Threat of New Entrants
- 4.8.4 Threat of Substitutes
- 4.8.5 Intensity of Competitive Rivalry
5 MARKET SIZE AND GROWTH FORECASTS (VALUE)
- 5.1 By Component
- 5.1.1 Hardware
- 5.1.1.1 Controllers
- 5.1.1.2 Sensors and Field Devices
- 5.1.1.3 Actuators
- 5.1.1.4 Other Hardware Components
- 5.1.2 Software
- 5.1.2.1 Supervisory / Management Software
- 5.1.2.2 Analytics / Energy Management Software
- 5.1.3 Services
- 5.1.3.1 Installation
- 5.1.3.2 Maintenance and Support
- 5.1.1 Hardware
- 5.2 By System Type
- 5.2.1 HVAC Control Systems
- 5.2.2 Lighting Control Systems
- 5.2.3 Security and Access Control Systems
- 5.2.3.1 Video Surveillance System
- 5.2.3.2 Access Control Systems
- 5.2.3.2.1 Card / RFID Access
- 5.2.3.2.2 Biometric Access
- 5.2.4 Energy Management Systems
- 5.2.5 Fire and Life-Safety Systems
- 5.3 By Communication Technology
- 5.3.1 Wired
- 5.3.2 Wireless
- 5.4 By Installation Type
- 5.4.1 New-Build
- 5.4.2 Retrofit
- 5.5 By End User
- 5.5.1 Residential
- 5.5.2 Commercial
- 5.5.3 Industrial
- 5.5.4 Institutional / Government
- 5.6 By Geography
- 5.6.1 North America
- 5.6.1.1 United States
- 5.6.1.2 Canada
- 5.6.1.3 Mexico
- 5.6.2 South America
- 5.6.2.1 Brazil
- 5.6.2.2 Argentina
- 5.6.3 Europe
- 5.6.3.1 Germany
- 5.6.3.2 United Kingdom
- 5.6.3.3 France
- 5.6.3.4 Rest of Europe
- 5.6.4 Asia Pacific
- 5.6.4.1 China
- 5.6.4.2 Japan
- 5.6.4.3 India
- 5.6.4.4 Rest of Asia Pacific
- 5.6.5 Middle East
- 5.6.5.1 United Arab Emirates
- 5.6.5.2 Saudi Arabia
- 5.6.5.3 Rest of Middle East
- 5.6.6 Africa
- 5.6.6.1 South Africa
- 5.6.6.2 Rest of Africa
- 5.6.1 North America
6 COMPETITIVE LANDSCAPE
- 6.1 Market Concentration
- 6.2 Strategic Moves
- 6.3 Market Share Analysis
- 6.4 Company Profiles (includes Global Level Overview, Market Level Overview, Core Segments, Financials as available, Strategic Information, Market Rank/Share, Products and Services, Recent Developments)
- 6.4.1 Honeywell International Inc.
- 6.4.2 Siemens AG
- 6.4.3 Johnson Controls International plc
- 6.4.4 Schneider Electric SE
- 6.4.5 ABB Ltd
- 6.4.6 Robert Bosch GmbH
- 6.4.7 Mitsubishi Electric Corporation
- 6.4.8 Carrier Global Corporation
- 6.4.9 Trane Technologies plc
- 6.4.10 Legrand SA
- 6.4.11 Cisco Systems Inc.
- 6.4.12 Hubbell Incorporated
- 6.4.13 Delta Controls Inc.
- 6.4.14 Lutron Electronics Co., Inc.
- 6.4.15 Crestron Electronics, Inc.
- 6.4.16 Distech Controls Inc.
- 6.4.17 Leviton Manufacturing Co., Inc.
- 6.4.18 Belimo Holding AG
- 6.4.19 Automated Logic Corporation (Carrier)
7 MARKET OPPORTUNITIES AND FUTURE OUTLOOK
- 7.1 White-Space and Unmet-Need Assessment

