
|
시장보고서
상품코드
2044227
IoT 디바이스 시장 : 점유율 분석, 업계 동향과 통계, 성장 예측(2026-2031년)IoT Devices - Market Share Analysis, Industry Trends & Statistics, Growth Forecasts (2026 - 2031) |
||||||
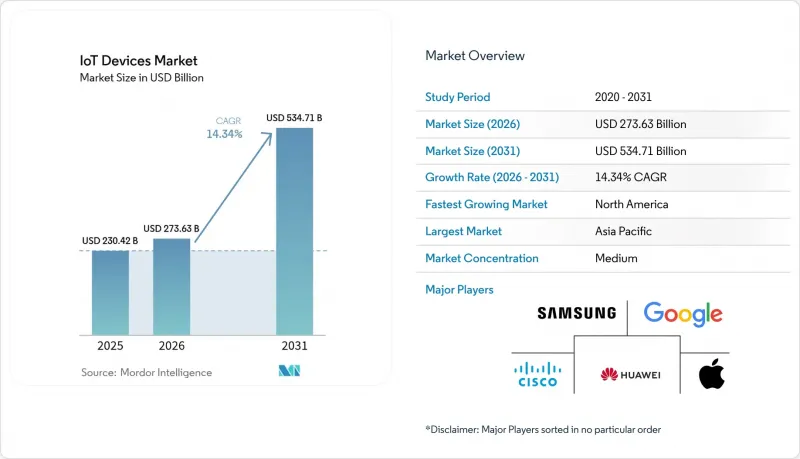
IoT 디바이스 시장 규모는 2025년 2,304억 2,000만 달러에서 2026년에는 2,736억 3,000만 달러로 확대되어 2031년까지 5,347억 1,000만 달러에 이를 것으로 예상되고 있어 2026년부터 2031년까지 CAGR 14.34%로 성장할 전망입니다.
엣지 인텔리전스, 저전력 광역 통신, 클라우드 오케스트레이션이 결합된 상호 운용 가능한 장치군을 기업들이 도입하기 시작하면서 채택이 증가하고 있습니다. 미국 연방정부와 유럽의 원격 환자 모니터링에 대한 상환제도 개혁으로 의료용 하드웨어 주문이 증가하고 있으며, 북미, 유럽연합(EU), 중국의 V2X(Vehicle-to-Everything) 규제로 인해 신차에 커넥티비티를 탑재하는 것이 대규모로 진행되고 있습니다. 또한, 데이터 거주지에 대한 주권적 규제로 인해 머신러닝 추론이 디바이스의 실리콘에서 실행되고 있으며, 뉴럴 엔진이 탑재된 마이크로컨트롤러에 대한 수요가 증가하고 있습니다. 동시에 아시아 지역 LPWAN 주파수 대역의 통합으로 로밍 요금이 절감되어 물류 기업이 국경을 넘어 자산을 추적할 수 있게 되었습니다. 이러한 변화로 인해 민생, 산업, 인프라 각 분야에서 출하량이 두 자릿수 성장을 기록하고 있습니다.
세계 IoT 디바이스 시장 동향 및 인사이트
5G 및 LPWAN 배포로 대규모 IoT 배송 가속화
2025년에는 27개국에서 RedCap 5G 네트워크가 출시되어 Enhanced Mobile Broadband와 같은 높은 전력 소비 없이 카메라, 웨어러블, 산업용 센서에 적합한 중간 수준의 대역폭을 제공했습니다. 통신사들은 기기당 연간 2달러 미만의 데이터 요금제를 설정하여 전국적인 보급을 경제적으로 가능하게 했습니다. 특히 인도와 브라질에서 유틸리티 사업자가 기존 계량기를 교체하면서 LoRaWAN과 NB-IoT가 병행 성장하여 2025년 출하량이 1억 8,000만 대를 돌파할 것으로 예측됩니다. 아세안 지역의 900MHz 대역 주파수 대역이 통일됨에 따라 물류 사업자들은 하나의 하드웨어 설계를 여러 국가에서 사용할 수 있게 되었습니다. 이러한 발전은 연결 비용을 낮추고, 로밍 장벽을 제거하며, 수십억 개의 저처리량 연결을 필요로 하는 롱테일 이용 사례를 실현할 수 있게 해줍니다.
엣지 AI용 실리콘의 비용 절감으로 비전 기능을 갖춘 산업용 IoT 확대
2025년에는 온보드 뉴럴 엔진이 탑재된 마이크로컨트롤러가 100만대 규모로 3달러 이하로 떨어질 것입니다. 이를 통해 제조업체는 이미지를 클라우드로 전송하지 않고도 카메라에 실시간 결함 감지 기능을 추가할 수 있게 되었습니다. 자동차 부품 공급업체는 이 시스템을 도장 라인에 도입하여 독일과 일본 공장에서 불량률을 최대 18%까지 줄였습니다. 로컬 추론은 유럽의 데이터 주권 규제를 준수하며, 안전에 중요한 작업에 필요한 임계값인 10밀리초 미만의 지연 시간을 유지합니다. 현재 각 업체들은 하드웨어 암호화 기능을 신경 엔진에 통합하여 공장이 IEC 62443의 사이버 보안 표준을 충족하도록 돕고 있습니다. 반도체 가격 하락, 규제 압력, 보안 기능 등으로 인해 공장 현장에서 비전 지원 센서가 빠르게 확산되고 있습니다.
파편화된 펌웨어 업데이트 생태계가 사이버 리스크를 낳고 있습니다.
이미 설치된 IoT 컨트롤러의 약 40%는 신뢰할 수 있는 무선 업데이트 경로가 부족하여 알려진 취약점이 수개월 동안 수정되지 않은 채로 방치되고 있습니다. 2025년, CISA는 산업 장비를 대상으로 한 18건의 자문을 발표했는데, 해당 장비의 소유자는 수정 프로그램을 설치하기 위해 고가의 현지 방문을 해야만 했습니다. 기업들은 독자적인 부트 로더와 경쟁적인 업데이트 프로토콜로 인해 단일 패치 적용 워크플로우를 도입할 수 없습니다. 이에 대해 사이버 보험사들은 분기별 갱신을 증명하지 않으면 보험료를 15-25% 인상하는 조치를 취했습니다. 자동차 분야의 UNECE WP.29와 같은 보편적인 표준이 없기 때문에 기업들은 기술 부채를 축적하고, 결국 고가의 개조 및 조기 장치 교체를 강요당하고 있습니다.
부문 분석
스마트 농업은 캘리포니아 센트럴 밸리, 인도 펀자브 등 물 부족 지역의 정밀 관개 및 가축 건강 모니터링을 배경으로 2026년부터 2031년까지 연평균 복합 성장률(CAGR) 14.39%로 확대될 것으로 예측됩니다. 스마트홈용 IoT 기기 시장 규모는 2025년 30.82%의 점유율을 기록할 것으로 예상되지만, 북미와 서유럽의 가정 보급률이 이미 1/3을 넘어섰기 때문에 성장이 둔화될 것으로 보입니다.
의료용 IoT는 미국 내 보험 상환 제도 개혁을 계기로 가속화되어 2025년 전체 용도의 18%를 차지할 것으로 예측됩니다. FDA 승인 건수는 전년 대비 40% 증가했고, 제품 출시 주기가 단축되면서 커넥티드 헬스 기기가 수익원으로 부상하고 있습니다. 커넥티드카 도입은 V2X 기한에 맞추어 진행되고 있지만, 여전히 긴 형식승인 주기에 직면해 있어 수익 계상이 미뤄지고 있습니다. 산업용 IoT는 여전히 기업에게 가장 큰 기회이며, 파일럿 플랜트에서는 진동 센서와 온도 센서를 도입하여 다운타임을 최대 30%까지 줄였습니다.
스마트 스피커 및 디스플레이는 2025년 IoT 기기 시장 점유율의 26.61%를 차지했지만, 교체 주기가 4년으로 늘어남에 따라 성장세가 둔화되고 있습니다. 커넥티드 가전은 유럽과 캘리포니아 주 규제에 따라 냉장고와 온도조절기의 실시간 전력 사용량 보고가 의무화됨에 따라 2031년까지 연평균 14.43% 성장할 것으로 예측됩니다.
웨어러블 기기는 맥박 산소 측정 및 심방세동 감지 기능이 FDA 승인을 받아 건강 저축 계좌(HSA)를 통한 환급을 받을 수 있게 되면서 두 자릿수 성장을 유지하고 있습니다. 산업용 센서는 견고한 하우징과 방폭 인증을 반영하여 가장 높은 평균 판매 가격을 기록하고 있습니다. 스쿠터와 전기자전거용 GPS 트래커는 런던과 파리가 주차 규칙을 철저하게 준수하기 위해 실시간 위치 정보 전달을 의무화하면서 보급이 확산되고 있습니다.
지역별 분석
북미는 2026년부터 2031년까지 14.62% 성장할 것으로 예상되며, 다른 지역보다 높은 성장률을 보일 것으로 예측됩니다. 미국 농업법안에 의해 8억 달러의 보조금이 센서 기반 관개에 투입되고, V2X 의무화로 인해 자동차 제조업체들은 2027년까지 커넥티비티 기능을 탑재해야 합니다. 텍사스주와 온타리오주 전력회사는 시간대별 요금제에 대응하기 위해 2025년까지 1,200만 대의 스마트미터를 설치했습니다. 멕시코 공장에서는 수출 품질 기준을 충족하기 위해 예지보전용 센서를 도입하여 견고한 산업용 모듈에 대한 현지 수요를 견인하고 있습니다.
아시아태평양은 2025년 41.72%의 점유율을 차지해, 중국의 스마트시티 조달, 인도의 계측기기 도입 의무화, 아세안 국가들의 공장 자동화가 이를 견인할 것으로 예측됩니다. 지역 내 공급업체들은 4억 5,000만 개의 모듈을 출하하여 이 지역에 견고한 지역 생태계를 구축했습니다. 일본과 한국은 각각 50개 이상의 기업용 5G 네트워크를 구축하여 1밀리초 미만의 지연을 필요로 하는 반도체 및 자동차 공장에 서비스를 제공합니다.
유럽에서는 그린딜(Green Deal)에 따라 커넥티드 온도조절기, 재실 센서, 스마트 충전기 도입이 의무화되면서 IoT의 확대가 지속되고 있습니다. 독일, 프랑스, 이탈리아에서는 다운타임을 줄이기 위해 중공업 분야에 예지보전 장치를 도입하고 있습니다. 중동에서는 NEOM과 같은 메가 프로젝트에서 IoT가 활용되고 있으며, 자율주행차나 드론 물류가 초기부터 접목되고 있습니다. 아프리카는 아직 초기 단계에 있으며, 남아공과 나이지리아에서는 스마트 미터와 농업 관련 시범 프로그램이 진행되고 있습니다. 남미에서는 원격지 농지의 가축과 곡물 사일로를 모니터링하기 위해 위성 IoT 도입을 확대되고 있습니다.
기타 특전:
- 엑셀 형식 시장 예측(ME) 시트
- 3개월간 애널리스트 지원
자주 묻는 질문
목차
제1장 서론
제2장 조사 방법
제3장 주요 요약
제4장 시장 구도
제5장 시장 규모와 성장 예측
제6장 경쟁 구도
제7장 시장 기회와 향후 전망
JHSThe IoT devices market size is expected to increase from USD 230.42 billion in 2025 to USD 273.63 billion in 2026 and reach USD 534.71 billion by 2031, growing at a CAGR of 14.34% over 2026-2031. Adoption is rising because enterprises now deploy interoperable device fleets that combine edge intelligence, low-power wide-area connectivity, and cloud orchestration. Federal and European reimbursement reforms for remote patient monitoring are stimulating medical hardware orders, while vehicle-to-everything regulations in North America, the European Union, and China are embedding connectivity into new vehicles at scale. Sovereign data-residency rules are also pushing machine-learning inference onto device silicon, lifting demand for microcontrollers that include neural engines. At the same time, spectrum alignment for LPWAN in Asia is cutting roaming fees and enabling logistics firms to track assets across borders. These shifts are translating into double-digit shipment growth across consumer, industrial, and infrastructure verticals.

Global IoT Devices Market Trends and Insights
5G and LPWAN Roll-Outs Accelerating Massive-IoT Shipments
RedCap 5G networks launched in 27 countries during 2025, offering mid-tier bandwidth that fits cameras, wearables, and industrial sensors without the high energy draw of enhanced mobile broadband. Operators priced annual data plans below USD 2 per device, making nationwide deployments economical. Parallel growth in LoRaWAN and NB-IoT, especially in India and Brazil where utilities replaced legacy meters, boosted unit volumes past 180 million in 2025. Harmonized 900 MHz spectrum in ASEAN now lets logistics providers use one hardware design across multiple countries. These developments lower connectivity costs, remove roaming barriers, and unlock long-tail use cases that require billions of low-throughput links.
Edge-AI Silicon Cost Decline Expanding Vision-Enabled Industrial IoT
Microcontrollers with on-board neural engines fell below USD 3 at million-unit scale in 2025, allowing manufacturers to add real-time defect detection to cameras without sending images to the cloud. Automotive suppliers deployed these systems on paint lines and reduced scrap rates by up to 18% in German and Japanese plants. Local inference also satisfies European data-sovereignty rules and keeps latency under 10 milliseconds, a threshold required for safety-critical tasks. Vendors now bundle hardware encryption with neural engines, helping factories meet IEC 62443 cybersecurity benchmarks. Lower silicon prices, regulatory pressure, and security features are driving rapid penetration of vision-enabled sensors on the factory floor.
Fragmented Firmware-Update Ecosystems Creating Cyber-Risk
Around 40% of installed IoT controllers lack reliable over-the-air update paths, keeping known vulnerabilities unpatched for months. In 2025 CISA published 18 advisories targeting industrial gear whose owners faced expensive on-site visits to install fixes. Proprietary bootloaders and competing update protocols block enterprises from adopting a single patch workflow. Cyber-insurance providers reacted by raising premiums 15-25% unless quarterly updates are proven. Without a universal standard akin to automotive UNECE WP.29, firms accrue technical debt that eventually forces costly retrofits or early device replacement.
Other drivers and restraints analyzed in the detailed report include:
- Reimbursement Policies Boosting Remote-Patient Monitoring Devices
- V2X Regulations Catalyzing Connected-Car Hardware Installations
- Semiconductor Supply Volatility for Ultra-Low-Power MCUs
For complete list of drivers and restraints, kindly check the Table Of Contents.
Segment Analysis
Smart Agriculture is set to rise at a 14.39% CAGR during 2026-2031 on the back of precision irrigation and livestock-health monitors in water-stressed zones such as California's Central Valley and India's Punjab. The IoT devices market size for smart-home applications climbed to 30.82% share in 2025, but growth is slowing because household penetration now exceeds one-third in North America and Western Europe.
Medical IoT accelerated after U.S. reimbursement reforms, taking 18% of the application pie in 2025. FDA approvals rose 40% year over year, shortening product launch cycles and making connected health gear a rising revenue source. Connected-car deployments track V2X deadlines yet still face long homologation cycles that defer revenue recognition. Industrial IoT remains the largest enterprise opportunity, as vibration and thermal sensors cut downtime by up to 30% in pilot plants.
Smart Speakers and Displays delivered 26.61% of IoT devices market share in 2025, but replacement windows have extended to four years, slowing further gains. Connected Consumer Appliances are forecast to grow at 14.43% through 2031 because European and Californian rules now oblige refrigerators and thermostats to report real-time power use.
Wearables sustain double-digit expansion as pulse-oximetry and atrial-fibrillation detection receive FDA clearance, positioning devices for health savings account reimbursement. Industrial sensors post the highest average selling price, reflecting ruggedized enclosures and explosion-proof certifications. GPS trackers for scooters and e-bikes are scaling after London and Paris mandated live-location feeds to enforce parking rules.
The IoT Devices Market Report is Segmented by Application Type (Connected and Smart Home, Medical IoT, Connected Car, Smart Cities, Industrial IoT, and More), Device Category (Smart Speakers and Displays, Wearables, Connected Consumer Appliances, and More), Connectivity Technology (WPAN, WLAN, and More), Power Source (Battery-Powered and More) and Geography. The Market Forecasts are Provided in Terms of Value (USD).
Geography Analysis
North America is projected to grow at 14.62% between 2026 and 2031, outpacing other regions. U.S. Farm Bill grants worth USD 800 million fund sensor-driven irrigation, and V2X mandates compel automakers to add connectivity by 2027. Utilities in Texas and Ontario installed 12 million smart meters in 2025 to support time-of-use tariffs. Mexico's factories are adding predictive-maintenance sensors to meet export quality standards, driving local demand for rugged industrial modules.
Asia-Pacific held 41.72% share in 2025, fueled by China's smart-city procurements, India's metering mandates, and factory automation in ASEAN. Domestic suppliers shipped 450 million modules, giving the region strong local ecosystems. Japan and South Korea rolled out more than 50 enterprise 5G networks each to service semiconductor and automotive plants that need sub-millisecond latency.
Europe continues to scale IoT under the Green Deal, mandating connected thermostats, occupancy sensors, and smart chargers. Germany, France, and Italy are adding predictive-maintenance devices in heavy industries to curb downtime. The Middle East is using IoT in megaprojects such as NEOM, where autonomous vehicles and drone logistics are embedded from day one. Africa remains early stage, with pilot smart-meter and agriculture programs in South Africa and Nigeria. South America is expanding satellite IoT to monitor cattle and grain silos across remote farmland.
List of Companies Covered in this Report:
- Apple Inc.
- Samsung Electronics Co. Ltd.
- Amazon.com Inc.
- Alphabet Inc. (Google)
- Xiaomi Corp.
- Cisco Systems Inc.
- Huawei Technologies Co. Ltd.
- Microsoft Corp.
- Intel Corp.
- Honeywell International Inc.
- Siemens AG
- LG Electronics Inc.
- Sony Group Corp.
- Robert Bosch GmbH
- Schneider Electric SE
- Signify N.V. (Philips)
- Arm Ltd.
- Qualcomm Inc.
- NXP Semiconductors N.V.
- Dell Technologies Inc.
- Ericsson AB
- Quectel Wireless Solutions Co. Ltd.
- Telit Cinterion
- Particle Industries Inc.
Additional Benefits:
- The market estimate (ME) sheet in Excel format
- 3 months of analyst support
TABLE OF CONTENTS
1 INTRODUCTION
- 1.1 Study Assumptions and Market Definition
- 1.2 Scope of the Study
2 RESEARCH METHODOLOGY
3 EXECUTIVE SUMMARY
4 MARKET LANDSCAPE
- 4.1 Market Overview
- 4.2 Market Drivers
- 4.2.1 5G and LPWAN Roll-Outs Accelerating Massive-IoT Shipments
- 4.2.2 Edge-AI Silicon Cost Decline Expanding Vision-Enabled Industrial IoT
- 4.2.3 Reimbursement Policies Boosting Remote-Patient Monitoring Devices
- 4.2.4 V2X Regulations Catalyzing Connected-Car Hardware Installations
- 4.2.5 Ai-Native Chiplets Enabling Sub-UDS1 Secure Micro-Controllers
- 4.2.6 Smart-Meter Mandates Driving Connected-Energy Devices
- 4.3 Market Restraints
- 4.3.1 Fragmented Firmware-Update Ecosystems Creating Cyber-Risk
- 4.3.2 Semiconductor Supply Volatility For Ultra-Low-Power MCUs
- 4.3.3 Absence Of Energy-Harvesting Standards Hindering Battery-Less Sensors
- 4.3.4 Grey-Market LPWAN Modules Undermining Type-Approval Compliance
- 4.4 Value Chain Analysis
- 4.5 Regulatory Outlook
- 4.6 Technological Outlook
- 4.7 Porter's Five Forces
- 4.7.1 Bargaining Power of Suppliers
- 4.7.2 Bargaining Power of Buyers
- 4.7.3 Threat of New Entrants
- 4.7.4 Threat of Substitutes
- 4.7.5 Intensity of Competitive Rivalry
- 4.8 Technology Snapshot
- 4.8.1 Evolution of IoT
- 4.8.2 Disruptive Technologies Enabling Adoption
- 4.8.3 Major IoT Device Components
- 4.9 Investment Analysis
5 MARKET SIZE AND GROWTH FORECASTS (VALUE)
- 5.1 By Application
- 5.1.1 Connected and Smart Home
- 5.1.2 Medical IoT
- 5.1.3 Connected Car
- 5.1.4 Smart Cities
- 5.1.5 Industrial IoT
- 5.1.6 Personal IoT
- 5.1.7 Smart Agriculture
- 5.1.8 Other Applications
- 5.2 By Device Category
- 5.2.1 Smart Speakers and Displays
- 5.2.2 Wearables (Watches, Bands, Hearables)
- 5.2.3 Connected Consumer Appliances
- 5.2.4 Smart Energy and Utility Devices (Meters, Thermostats)
- 5.2.5 Industrial Sensors and Actuators
- 5.2.6 Connected Cameras and Security Devices
- 5.2.7 Micro-mobility Trackers
- 5.2.8 Self-powered Environmental Sensors
- 5.3 By Connectivity Technology
- 5.3.1 WPAN (Bluetooth, Zigbee, Z-Wave)
- 5.3.2 WLAN (Wi-Fi 4/5/6/6E/7)
- 5.3.3 LPWAN (NB-IoT, LTE-M, LoRa, Sigfox)
- 5.3.4 Cellular (4G, 5G, C-V2X)
- 5.3.5 Satellite IoT
- 5.3.6 Hybrid Multi-band Modules
- 5.4 By Power Source
- 5.4.1 Battery-powered
- 5.4.2 Energy-harvested
- 5.4.3 Mains-powered
- 5.5 By Geography
- 5.5.1 North America
- 5.5.1.1 United States
- 5.5.1.2 Canada
- 5.5.1.3 Mexico
- 5.5.2 South America
- 5.5.2.1 Brazil
- 5.5.2.2 Argentina
- 5.5.2.3 Rest of South America
- 5.5.3 Europe
- 5.5.3.1 Germany
- 5.5.3.2 United Kingdom
- 5.5.3.3 France
- 5.5.3.4 Italy
- 5.5.3.5 Rest of Europe
- 5.5.4 Asia Pacific
- 5.5.4.1 China
- 5.5.4.2 Japan
- 5.5.4.3 India
- 5.5.4.4 South Korea
- 5.5.4.5 Rest of Asia Pacific
- 5.5.5 Middle East
- 5.5.5.1 Saudi Arabia
- 5.5.5.2 United Arab Emirates
- 5.5.5.3 Rest of Middle East
- 5.5.6 Africa
- 5.5.6.1 South Africa
- 5.5.6.2 Nigeria
- 5.5.6.3 Rest of Africa
- 5.5.1 North America
6 COMPETITIVE LANDSCAPE
- 6.1 Market Concentration
- 6.2 Strategic Moves
- 6.3 Market Share Analysis
- 6.4 Company Profiles (includes Global level Overview, Market level overview, Core Segments, Financials as available, Strategic Information, Market Rank/Share for key companies, Products and Services, and Recent Developments)
- 6.4.1 Apple Inc.
- 6.4.2 Samsung Electronics Co. Ltd.
- 6.4.3 Amazon.com Inc.
- 6.4.4 Alphabet Inc. (Google)
- 6.4.5 Xiaomi Corp.
- 6.4.6 Cisco Systems Inc.
- 6.4.7 Huawei Technologies Co. Ltd.
- 6.4.8 Microsoft Corp.
- 6.4.9 Intel Corp.
- 6.4.10 Honeywell International Inc.
- 6.4.11 Siemens AG
- 6.4.12 LG Electronics Inc.
- 6.4.13 Sony Group Corp.
- 6.4.14 Robert Bosch GmbH
- 6.4.15 Schneider Electric SE
- 6.4.16 Signify N.V. (Philips)
- 6.4.17 Arm Ltd.
- 6.4.18 Qualcomm Inc.
- 6.4.19 NXP Semiconductors N.V.
- 6.4.20 Dell Technologies Inc.
- 6.4.21 Ericsson AB
- 6.4.22 Quectel Wireless Solutions Co. Ltd.
- 6.4.23 Telit Cinterion
- 6.4.24 Particle Industries Inc.
7 MARKET OPPORTUNITIES AND FUTURE OUTLOOK
- 7.1 White-space and Unmet-Need Assessment
