
|
시장보고서
상품코드
2061632
해상 풍력발전 : 시장 점유율 분석, 업계 동향 및 통계, 성장 예측(2026-2031년)Offshore Wind Energy - Market Share Analysis, Industry Trends & Statistics, Growth Forecasts (2026 - 2031) |
||||||
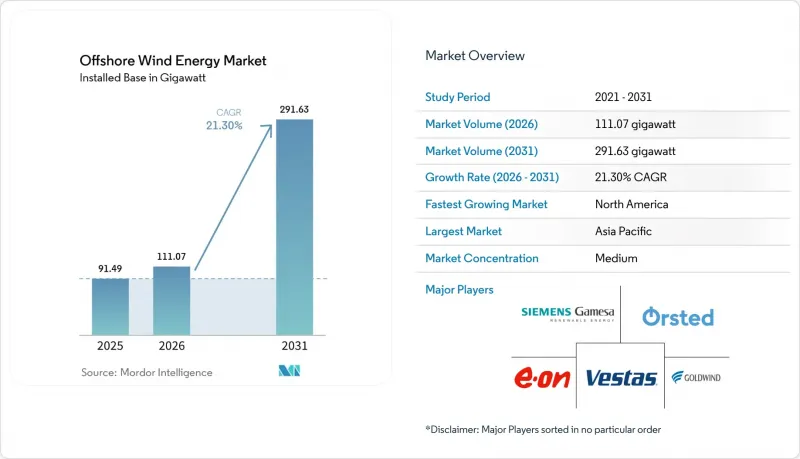
Mordor Intelligence에 의하면, 해상 풍력발전 시장 규모는 2025년에 91.49기가와트로 평가되었습니다. 2026년 111.07기가와트에서 2031년까지 291.63기가와트에 이를 것으로 예상되며, 예측 기간(2026-2031년) CAGR은 21.30%를 나타낼 전망입니다.
본 보고서는 기초 유형(고정식 및 부유식), 터빈 출력(3MW 이하, 3-6MW, 6MW 초과), 용도(유틸리티 규모, 상업 및 산업용, 지역 프로젝트), 지역(북미, 유럽, 아시아태평양, 남미, 중동 및 아프리카)별로 분류되어 있습니다. 시장 규모 및 전망은 설치 용량(GW) 기준으로 제시되어 있습니다.
세계의 해상 풍력발전 시장 동향과 인사이트
LCOE의 급격한 하락이 시장 성장을 주도하고 있습니다.
비용이 중요한 기준치를 초과했습니다. 2024년에는 0.075달러/kWh가 되어, 많은 지역에서 신규 해상 풍력발전소의 가격은 복합 사이클 가스 발전소와 동등하거나 그보다 낮아졌습니다. 고출력 터빈의 양산화와 설치 기간 단축을 통해 프로젝트 전체의 공사 기간이 최대 30% 단축되어, 개발사의 수익성이 크게 향상됩니다. 한때는 수익성이 없습니다고 여겨졌던 부유식 프로젝트도, 학습 곡선에 따른 설비 투자(CAPEX) 감소와 전 세계 보험사들의 심해 지역 위험 인수 확대에 힘입어 손익분기점에 가까워지고 있습니다. 업계의 일반적인 견해에 따르면, 금세기 내에 0.060달러/kWh 미만의 가격 책정이 현실적일 것으로 보이며, 해상 풍력발전 시장은 주전원에 필적하는 재생에너지 옵션으로서의 입지를 확고히 하고 있습니다.
정부의 입찰 제도 도입이 가속화되고 있습니다.
경쟁 입찰을 통해 2024년 한 해 동안만 유럽 전역에서 23.2GW가 낙찰되었습니다. 이는 전년 대비 40% 급증한 수치로, 20년 이상 지속될 수 있는 예측 가능한 현금 흐름 체계를 확립했습니다. 덴마크의 사상 최저 청산 가격은 공급망의 성숙도에 대한 신뢰를 보여주는 반면, 일본의 최신 1.8GW 규모 프로젝트는 아시아 지역의 턴키 솔루션에 대한 수요가 높음을 보여줍니다. 독일은 송전망 정비 의무와 낙찰 발표를 연계함으로써 이 모델을 강화하고, 출력 억제 위험을 줄이는 동시에 자금 조달 가능성을 높이고 있습니다.
설치 선박 부족이 성장을 저해하고 있습니다.
세계적으로 15MW급 터빈을 설치할 수 있는 잭업선 및 중량물 운반선은 50척 미만이며, 일당 비용이 50만-70만 달러로 치솟고, 건설 성수기에는 12-24개월의 지연이 발생할 위험이 있습니다. 존스법은 미국 수역 내 외국 선박의 작업을 제한함으로써 공급 부족을 더욱 심화시키고 있으며, 개발사들은 일정을 맞추기 위해 피더 바지선 개념이나 모듈식 조립 방식을 시도하고 있습니다.
부문별 분석
2025년에는 고정식 플랫폼이 설치 건수의 99.62%를 차지했습니다. 이는 확립된 제조업체 네트워크와 수심 60m에 적합한 설치 속도를 반영한 것입니다. 이러한 구조는 해상 풍력발전 시장 전체의 주요 프로젝트를 뒷받침하고 있지만, 터빈 출력이 15MW를 초과하면 모노파일의 직경은 실용적인 한계에 다다르고 있습니다. 암초 해저에서는 여전히 재킷이 필수적이며, 반면 중력식 및 흡입식 솔루션은 특수한 지질 환경에 대응하고 있습니다.
부유식(반잠수식, 스파 부이, 텐션 레그) 플랫폼 시장은 연평균 성장률(CAGR) 42.1%로 성장하고 있으며, 바람이 더 안정적으로 불고 인허가 요건이 완화된 수심 100미터 이상의 해역을 개척하고 있습니다. 하이윈드 스코틀랜드의 65%에 달하는 설비 가동률은 심해 발전의 경제성을 입증하고 있습니다. 현재 캘리포니아, 한국, 그리고 일본에서는 부유식 풍력발전만을 대상으로 한 임대 입찰이 진행되고 있으며, 이러한 호재에 힘입어 2020년대 말까지 해상 풍력발전 시장에서 부유식 풍력발전의 점유율이 두 자릿수에 달할 가능성이 있습니다.
지역별 분석
2025년, 아시아태평양은 해상 풍력발전 시장에서 54.35%의 점유율을 차지하며 1위를 차지했습니다. 이는 중국의 35GW 설비 용량과, 자동화가 점점 더 진전되고 있는 생산 라인에서 출하되는 20MW급 국산 터빈에 힘입은 결과입니다. 일본의 제3차 입찰(1.8GW)은 유럽 및 미국의 개발업체들에게 심해 지역 진출의 길을 열어주었으며, 대만의 제3단계 고정가격임베디드제도는 송전망 지연에도 불구하고 견조한 모습을 보이고 있습니다. 베트남, 인도, 호주는 2030년대 초까지 대규모 프로젝트 파이프라인을 창출할 가능성이 있는 해저 임대 체계를 마련하고 있습니다.
북미는 연평균 성장률(CAGR) 103.6%라는 가장 급격한 성장세를 보이고 있습니다. 미국의 연방 목표인 30GW는 해양에너지청(BOEM)의 효율화된 일정, 총 17GW에 달하는 각 주의 공모, 그리고 통화 충격으로부터 공급망을 보호하기 위한 국내 선박 건조에 의해 뒷받침되고 있습니다. 캐나다는 4,000GW가 넘는 기술적 잠재력을 파악한 후, 대서양 및 태평양에서의 임대권 확보를 목표로 하고 있는 반면, 멕시코와 브라질은 향후 입찰에 앞서 풍황 평가를 진행하고 있습니다.
유럽은 시장 점유율이 하락하고 있음에도 불구하고 기술적 리더십을 유지하고 있습니다. 영국의 12GW에 달하는 조달 사업, 독일의 혁신 입찰, 그리고 덴마크의 사상 최저 가격 등은 해당 지역의 잠재력을 입증하고 있습니다. 개발업체들은 현재 더 높은 출력을 낼 수 있는 부지를 개척하고 수출 지향적인 공급 허브를 유지하기 위해 켈트해, 노르웨이의 우치라 노르드, 스페인의 카나리아 제도에 위치한 부유식 풍력발전 단지에 주목하고 있습니다.
기타 혜택 :
- 엑셀 형식 시장 예측(ME) 시트
- 3개월간의 애널리스트 지원
자주 묻는 질문
목차
제1장 서론
제2장 조사 방법
제3장 주요 요약
제4장 시장 구도
제5장 시장 규모 및 성장 예측
제6장 경쟁 구도
제7장 시장 기회 및 향후 전망
KTHAccording to Mordor Intelligence, the offshore wind energy market size was valued at 91.49 gigawatt in 2025 and estimated to grow from 111.07 gigawatt in 2026 to reach 291.63 gigawatt by 2031, at a CAGR of 21.30% during the forecast period (2026-2031).

This report is Segmented by Foundation Type (Fixed and Floating), Turbine Capacity (Up To 3 MW, 3 To 6 MW, and Above 6 MW), Application (Utility-Scale, Commercial and Industrial, and Community Projects), and Geography (North America, Europe, Asia-Pacific, South America, and Middle East and Africa). The Market Sizes and Forecasts are Provided in Terms of Installed Capacity (GW).
Global Offshore Wind Energy Market Trends and Insights
Rapid decline in LCOE drives market acceleration
Costs have crossed a critical threshold: at USD 0.075/kWh in 2024, new arrays equal or beat combined-cycle gas plants on price in multiple regions. Higher-rated turbines, serial fabrication, and shorter installation windows cut overall project timelines by up to 30% and materially improve developer returns. Floating projects once deemed uneconomic are approaching breakeven as learning curves trim capex and as global insurers underwrite deeper-water risks. Consensus among equipment vendors places sub-USD 0.060/kWh pricing within reach this decade, solidifying the offshore wind energy market as a go-to baseload-like renewable option.
Government auction mechanisms accelerate deployment
Competitive tenders awarded 23.2 GW across Europe in 2024 alone, a 40% year-on-year leap that extended predictable cash-flow regimes for twenty years or more. Denmark's record-low clearing price signaled confidence in supply-chain maturity, while Japan's latest 1.8 GW tranche showcased Asia's appetite for turnkey solutions. Germany strengthens the model by synchronizing grid build-out obligations with award announcements, reducing curtailment risk and lifting bankability.
Shortage of installation vessels constrains growth
Fewer than fifty jack-up and heavy-lift ships can erect 15 MW turbines worldwide, pushing day-rates to USD 500,000-700,000 and risking 12- to 24-month delays in crowded construction seasons. The Jones Act tightens supply further by capping foreign-flag work inside U.S. waters, so developers are experimenting with feeder-barge concepts and modular assembly to stay on schedule.
Other drivers and restraints analyzed in the detailed report include:
- Turbine upsizing transforms project economics
- Corporate PPAs reshape demand dynamics
- Grid connection infrastructure lags development
For complete list of drivers and restraints, kindly check the Table Of Contents.
Segment Analysis
Fixed platforms secured 99.62% of installations in 2025, reflecting proven fabricator networks and installation speeds suited to 60-m depths. This configuration underpins core projects across the offshore wind energy market, but monopile diameter is approaching practical limits as turbines surpass 15 MW. Jackets remain essential in rocky seabeds, while gravity and suction solutions service niche geological settings.
Floating (semi-submersibles, spar-buoys, and tension-leg) platforms are scaling at a 42.1% CAGR, opening 100-m-plus depths where winds blow steadier and permitting hurdles to ease. Hywind Scotland's 65% capacity factor validates the economics of deep-water generation. California, South Korea, and Japan now run floating-only lease rounds, creating tailwinds that could lift the floating slice of the offshore wind energy market to double digits by decade-end.
Geography Analysis
Asia-Pacific sat atop the offshore wind energy market with 54.35% share in 2025, propelled by China's 35 GW fleet and 20 MW domestic turbines that roll off increasingly automated lines. Japan's 1.8 GW Round 3 opened deep waters to European and U.S. developers, and Taiwan's Phase 3 feed-in model shows resilience despite grid delays. Vietnam, India, and Australia are crafting seabed-leasing frameworks that could unlock substantial pipelines by the early 2030s.
North America posts the fastest growth curve at 103.6% CAGR. The 30 GW U.S. federal goal is backed by streamlined Bureau of Ocean Energy Management (BOEM) timelines, state solicitations totaling 17 GW, and domestic vessel construction that shields the supply chain from currency shocks. Canada eyes Atlantic and Pacific leases after mapping more than 4,000 GW of technical potential, while Mexico and Brazil assess wind regimes ahead of potential auctions.
Europe retains technological leadership even as its market share dips. A 12 GW UK procurement queue, Germany's innovation auctions, and Denmark's record-low prices underscore the region's depth. Developers now look to floating turbines in the Celtic Sea, Norway's Utsira Nord, and Spain's Canary Islands to tap higher-yield sites and sustain export-oriented supply hubs.
- Siemens Gamesa Renewable Energy SA
- Vestas Wind Systems AS
- GE Vernova (GE Renewable Energy)
- Xinjiang Goldwind Science & Technology Co Ltd
- Ming Yang Smart Energy Group Ltd.
- Shanghai Electric Wind Power
- Nordex SE
- China Three Gorges Corp.
- State Power Investment Corp. (SPIC)
- Envision Energy Ltd.
- Orsted AS
- Equinor ASA
- Northland Power Inc.
- EDF SA
- E.ON SE
- RWE AG
- Iberdrola SA
- Copenhagen Infrastructure Partners
- BP plc
- TotalEnergies SE
- Shell plc
- Dominion Energy
- Ocean Winds (EDP & Engie JV)
Additional Benefits:
- The market estimate (ME) sheet in Excel format
- 3 months of analyst support
TABLE OF CONTENTS
1 Introduction
- 1.1 Study Assumptions & Market Definition
- 1.2 Scope of the Report
2 Research Methodology
3 Executive Summary
4 Market Landscape
- 4.1 Market Overview
- 4.2 Market Drivers
- 4.2.1 Rapid decline in LCOE
- 4.2.2 Government auction schemes & FITs
- 4.2.3 Turbine upsizing to 15 MW+
- 4.2.4 Corporate PPAs for renewables
- 4.2.5 Repowering of first-wave farms post-2030
- 4.2.6 Offshore-to-hydrogen hybrid projects
- 4.3 Market Restraints
- 4.3.1 Shortage of installation vessels
- 4.3.2 Grid-connection bottlenecks
- 4.3.3 Seabed-mineral rights conflicts
- 4.3.4 Limited O&M workforce pool
- 4.4 Supply-Chain Analysis
- 4.5 Regulatory Landscape
- 4.6 Technological Outlook
- 4.7 Porters Five Forces
- 4.7.1 Bargaining Power of Suppliers
- 4.7.2 Bargaining Power of Buyers
- 4.7.3 Threat of New Entrants
- 4.7.4 Threat of Substitutes
- 4.7.5 Intensity of Competitive Rivalry
5 Market Size & Growth Forecasts
- 5.1 By Foundation Type
- 5.1.1 Fixed
- 5.1.1.1 Monopile
- 5.1.1.2 Jacket
- 5.1.1.3 Gravity-Based
- 5.1.1.4 Tripod/Tripile
- 5.1.1.5 Suction Bucket
- 5.1.2 Floating
- 5.1.2.1 Semi-submersible
- 5.1.2.2 Spar-Buoy
- 5.1.2.3 Tension-Leg Platform (TLP)
- 5.1.2.4 Barge
- 5.1.1 Fixed
- 5.2 By Turbine Capacity
- 5.2.1 Up to 3 MW
- 5.2.2 3 to 6 MW
- 5.2.3 Above 6 MW
- 5.3 By Application
- 5.3.1 Utility-scale
- 5.3.2 Commercial and Industrial
- 5.3.3 Community Projects
- 5.4 By Component (Qualitative Analysis)
- 5.4.1 Nacelle/Turbine
- 5.4.2 Blade
- 5.4.3 Tower
- 5.4.4 Generator and Gearbox
- 5.4.5 Foundations
- 5.4.6 Balance-of-System
- 5.4.7 Others (Installation, Vessels, O&M)
- 5.5 By Geography
- 5.5.1 North America
- 5.5.1.1 United States
- 5.5.1.2 Rest of North America
- 5.5.2 Europe
- 5.5.2.1 Germany
- 5.5.2.2 France
- 5.5.2.3 United Kingdom
- 5.5.2.4 Spain
- 5.5.2.5 NORDIC Countries
- 5.5.2.6 Italy
- 5.5.2.7 Netherlands
- 5.5.2.8 Belgium
- 5.5.2.9 Rest of Europe
- 5.5.3 Asia-Pacific
- 5.5.3.1 China
- 5.5.3.2 India
- 5.5.3.3 Japan
- 5.5.3.4 South Korea
- 5.5.3.5 Vietnam
- 5.5.3.6 Rest of Asia-Pacific
- 5.5.4 South America
- 5.5.4.1 Brazil
- 5.5.4.2 Argentina
- 5.5.4.3 Rest of South America
- 5.5.5 Middle East and Africa
- 5.5.5.1 Saudi Arabia
- 5.5.5.2 United Arab Emirates
- 5.5.5.3 South Africa
- 5.5.5.4 Rest of Middle East and Africa
- 5.5.1 North America
6 Competitive Landscape
- 6.1 Market Concentration
- 6.2 Strategic Moves (M&A, Partnerships, PPAs)
- 6.3 Market Share Analysis (Market Rank/Share for key companies)
- 6.4 Company Profiles (includes Global level Overview, Market level overview, Core Segments, Financials as available, Strategic Information, Products & Services, and Recent Developments)
- 6.4.1 Siemens Gamesa Renewable Energy SA
- 6.4.2 Vestas Wind Systems AS
- 6.4.3 GE Vernova (GE Renewable Energy)
- 6.4.4 Xinjiang Goldwind Science & Technology Co Ltd
- 6.4.5 Ming Yang Smart Energy Group Ltd.
- 6.4.6 Shanghai Electric Wind Power
- 6.4.7 Nordex SE
- 6.4.8 China Three Gorges Corp.
- 6.4.9 State Power Investment Corp. (SPIC)
- 6.4.10 Envision Energy Ltd.
- 6.4.11 Orsted AS
- 6.4.12 Equinor ASA
- 6.4.13 Northland Power Inc.
- 6.4.14 EDF SA
- 6.4.15 E.ON SE
- 6.4.16 RWE AG
- 6.4.17 Iberdrola SA
- 6.4.18 Copenhagen Infrastructure Partners
- 6.4.19 BP plc
- 6.4.20 TotalEnergies SE
- 6.4.21 Shell plc
- 6.4.22 Dominion Energy
- 6.4.23 Ocean Winds (EDP & Engie JV)
7 Market Opportunities & Future Outlook
- 7.1 White-space & Unmet-need Assessment
