
|
시장보고서
상품코드
2061703
세포 및 유전자 치료 제조 서비스 시장 : 시장 점유율 분석, 업계 동향 및 통계, 성장 예측(2026-2031년)Cell And Gene Therapy Manufacturing Services - Market Share Analysis, Industry Trends & Statistics, Growth Forecasts (2026 - 2031) |
||||||
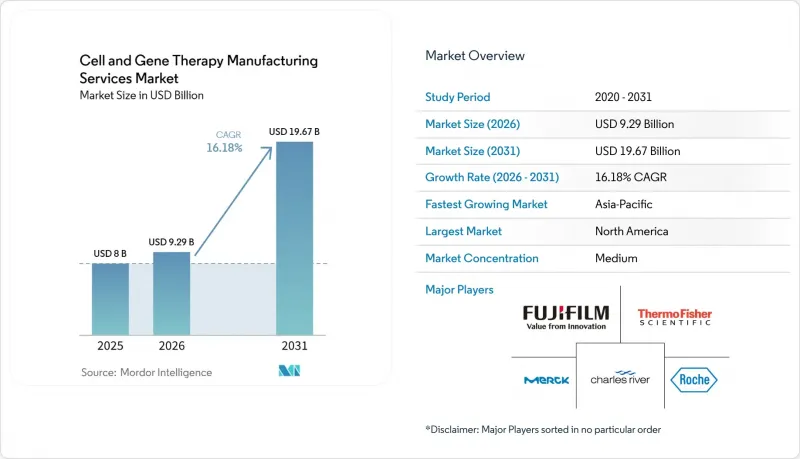
Mordor Intelligence에 의하면, 세포 및 유전자 치료 제조 서비스 시장 규모는 2025년 80억 달러로 평가되었고, 2026년 92억 9,000만 달러로 추정되고, 2031년까지 196억 7,000만 달러로 확대될 전망이며, 2026-2031년 연평균 복합 성장률(CAGR)은 16.18%를 나타낼 것으로 예측됩니다.

본 보고서는 서비스 유형별(세포 치료, 유전자 치료), 단계별(전임상, 1상, 2상 등), 용도별(임상 제조 및 상업적 제조), 적응증별(종양학 등), 운영 형태별(사내 등), 최종 사용자별(제약 및 바이오기술 기업 등), 지역별(북미 등)로 분류되어 있습니다.
세계의 세포 및 유전자 치료 제조 서비스 시장 동향과 인사이트
암 및 기타 만성 질환의 유병률 급증
암은 여전히 전 세계 사망 원인 중 2위를 차지하고 있으며, 규제 당국은 종양학 분야의 심사 절차를 지속적으로 신속화하고 있습니다. FDA의 종양학 우수 센터(Oncology Center of Excellence)는 희귀암에 대한 심사 절차를 확립하여, 환자 수가 적은 적응증을 상업적으로 타당성이 있는 분야로 전환하고 있습니다. 별로 주목받지 못하는 점 중 하나로, 각 CDMO 기업이 질환군별로 클린룸 시설을 구축하고 있다는 점을 들 수 있습니다. 이를 통해 개발 기업은 향후 수년 치 생산 능력을 미리 확보할 수 있게 되었으며, 이용률이 기존 효율 기준에 미치지 못하는 경우에도 극히 희귀한 암 치료제 공급을 보장할 수 있게 되었습니다.
맞춤형 의료로의 전환
개별 환자에게서 채취한 자가 치료용 시료는 매일 수십 개의 마이크로 배치를 동시에 처리할 수 있는 유연한 시설이 필요합니다. 신원 추적(Chain of Identity)과 관련된 물류 조정은 이제 의약품 자체의 과학적 복잡성에 필적할 정도로 발전했으며, 많은 고위 운영 관리자들은 신규 고객 프로그램 입찰에서 디지털 추적성 플랫폼이 가장 큰 차별화 요소가 되고 있음을 내심 인정하고 있습니다. 여기서 주목해야 할 점은 '데이터 서비스로서의 제조'의 부상입니다. 일부 CDMO는 제조 역량과는 별도로 자체 개발한 샘플 추적 소프트웨어를 통해 수익을 창출함으로써 이중 수익원을 확보하고 있으며, 이로 인해 물리적 입지와 관계없이 고객의 전환 비용을 높이고 있습니다.
동시에, 동종 이식 접근법은 규모의 경제를 약속하는 반면, 면역원성 및 유효성과 관련된 과제에 직면할 수밖에 없으며, 그 결과 후원사가 위험을 분산시키는 양극화된 자본 계획이 나타나고 있습니다. 즉, 소규모 자가 이식용 시설을 위탁 운영하면서, 향후 대규모 동종 이식용 바이오리액터를 위해 인접한 여유 공간을 확보해 두는 방식입니다. 이러한 부동산 차익거래, 즉 본질적으로 '미래의 확장권'에 대해 오늘 비용을 지불하는 방식은 많은 제조업체의 자산 기반을 서서히 부풀리고 있으며, 만약 임상 데이터를 통해 동종 이식 파이프라인의 유효성이 입증되지 않을 경우, 향후 투자자본이익률(ROIC)에 부담을 줄 가능성이 있습니다.
높은 운영 비용
승인된 세포 및 유전자 치료제의 제조 비용은 맞춤형 원료, 광범위한 품질 관리 시험, 그리고 소량 생산으로 인해 치료 1회당 100만 달러를 초과하는 것이 일반적입니다. 주목할 만한 파급 효과로, 상환 협상에서 공장의 수율 데이터가 점점 더 중요하게 여겨지고 있습니다. 지급사는 의약품 낭비를 최소화하기 위해, 로트 불량률이 한 자릿수 범위로 유지되도록 보장할 것을 요구하고 있습니다. 그 결과, 운영 책임자들은 수동 조작 단계를 줄이고 재현성을 높이는 밀폐형 자동 시스템의 실증 실험을 진행하고 있습니다.
흥미롭게도, 주요 CDMO 기업들은 자동화의 투자 대비 효과를 단순한 인건비 절감뿐만 아니라 규제 대응 능력 확대라는 관점에서도 평가하기 시작했습니다. 수작업 개입이 한 번 줄어들 때마다 FDA의 감사 범위가 축소될 가능성이 있어, 한정된 품질 보증 인력을 다른 업무에 투입하여 더 많은 병행 프로그램을 지원할 수 있게 됩니다. 이러한 인식의 전환을 통해 자동화는 단순한 비용 절감 수단에서 수익 확대의 수단으로 그 위상이 높아지고 있습니다.
부문별 분석
세포 치료제 생산은 현재 매출의 약 59.30%를 차지하고 있지만, 바이러스 벡터 공급을 기반으로 하는 유전자 치료 서비스 시장은 2026-2031년 연평균 성장률(CAGR) 23.3%로 확대될 것으로 전망됩니다. 플라스미드부터 충전까지 수직 통합형 제조 역량을 갖춘 CDMO는 기업 간 기술 이전 과정을 생략함으로써 리드 타임을 단축할 수 있으므로, 이러한 기회를 최대한 활용할 수 있는 독보적인 입장에 있습니다. 비바이러스성 전달 기술은 투자자들의 관심을 끌고 있지만, 그 대부분이 여전히 상용화 전 단계에 머물러 있어, 금세기 말까지는 벡터 수요가 공급을 초과할 가능성이 높다고 볼 수 있습니다.
현재 업무량에서 2단계 프로젝트가 가장 큰 비중을 차지하고 있지만, 상업 생산 분야가 가장 빠르게 성장하고 있으며, 연평균 성장률(CAGR)은 27.6%로 추정됩니다. 후기 단계의 후원 기업들은 단일클론 항체를 위해 설계된 검증 프로토콜이 생물학적 제제에는 그대로 적용될 수 없습니다는 사실을 깨닫기 시작하고 있습니다. 그 결과, 프로세스 분석 기술에 조기에 투자해 온 CDMO가 계약을 따내고 있습니다. 실시간 모니터링을 통해 환자별 맞춤형 배치라 하더라도 일관된 제품 품질을 확보할 수 있으며, 규제 당국의 기대에 부응할 수 있기 때문입니다.
지역별 분석
북미의 44.30%라는 점유율은 2025년 시점의 활발한 벤처 시장, 성숙한 규제 체계, 그리고 전문 CDMO의 긴밀한 네트워크를 반영하고 있습니다. 루이빌, 멤피스, 신시내티와 같은 항공 허브 인근에 시설을 전략적으로 배치함으로써, 자체 공급망 내의 '정맥에서 정맥으로'의 순환 주기가 단축되었으며, 이러한 운영상의 이점은 현재 지불 기관과의 보상 협상에서도 고려되고 있습니다.
아시아태평양의 연평균 성장률(CAGR) 20.80%는 정부의 인센티브, 인재에 대한 투자, 그리고 환자들 사이에서 빠르게 확산되는 채택에 힘입어 견인되고 있습니다. 한국 등 일부 국가에서는 재생의학 치료에 대한 신속 승인 절차가 도입되어 있으며, 개발자들이 현지에서 생산 능력을 구축하도록 장려하고 있습니다. 그러나 이 지역에서는 비용 경쟁력을 저해할 우려가 있는 인력 부족을 방지하기 위해 전문적인 연수 프로그램을 더욱 확대해야 합니다.
유럽에서는 엄격하면서도 투명성이 높은 규제와 견고한 학술 네트워크가 조화를 이루고 있습니다. 이 지역의 제조업체들은 배치 출시까지의 기간 단축과 높은 인건비 부담을 상쇄하기 위해, 실시간 출시 테스트 시범 프로젝트를 선도적으로 실시했습니다. 또한, EU의 지속가능성 지침에 따라 시설들은 더욱 환경 친화적인 일회용 시스템으로의 전환을 요구받고 있으며, 이는 기업의 사회적 책임(CSR)을 중시하는 후원사들에게 차별화 요소가 되고 있습니다.
기타 혜택 :
- 엑셀 형식 시장 예측(ME) 시트
- 3개월간의 애널리스트 지원
자주 묻는 질문
목차
제1장 서론
제2장 조사 방법
제3장 주요 요약
제4장 시장 구도
제5장 시장 규모 및 성장 예측
제6장 경쟁 구도
제7장 시장 기회 및 향후 전망
AJY 26.06.22According to Mordor Intelligence, the cell and gene therapy manufacturing services market size is projected to expand from USD 8 billion in 2025 and USD 9.29 billion in 2026 to USD 19.67 billion by 2031, registering a CAGR of 16.18% between 2026 to 2031.
This report is Segmented Into by Service Type (Cell Therapy, Gene Therapy), Phase (Pre-Clinical, Phase I, Phase II, and More), Application (Clinical Manufacturing and Commercial Manufacturing), Indication (Oncology, and More), Mode of Operation (In-House, and More), End User (Pharmaceutical and Biotechnology Companies, and More), and Geography (North America, and More).
Global Cell And Gene Therapy Manufacturing Services Market Trends and Insights
Surge in Prevalence of Cancer and Other Chronic Diseases
Cancer remains the second leading global cause of death, and regulators continue to expedite oncology submissions. The FDA's Oncology Center of Excellence has created rare-tumor review pathways that transform small-population indications into commercially viable segments . A less obvious implication is that CDMOs are launching disease-clustered cleanroom suites so developers can pre-book capacity years in advance, preserving supply for ultra-orphan oncology products even when utilisation hovers below traditional efficiency benchmarks.
Shift Towards Personalized Medicine
Autologous therapies, sourced from each individual patient, require agile facilities capable of running dozens of parallel micro-batches daily. The logistical orchestration around chain-of-identity tracking now rivals the scientific complexity of the drug itself, and many senior operations managers privately concede that digital traceability platforms are becoming the single biggest differentiator when bidding for new client programs. A notable inference here is the emergence of "manufacturing as a data service"; some CDMOs are monetising their proprietary software for sample tracking separately from their capacity, creating a dual-revenue stream and increasing client switching costs irrespective of physical location.
Simultaneously, allogeneic approaches promise scale economies but must confront immunogenicity and efficacy questions, resulting in a bifurcated capital plan where sponsors hedge their bets: they commission small-footprint autologous suites while reserving adjacent shell space for eventual large-scale allogeneic bioreactors. This real-estate arbitrage, essentially paying today for the right to expand tomorrow, is quietly inflating the asset base of many manufacturers and could pressure future return on invested capital if clinical data fail to validate allogeneic pipelines.
High Operational Costs
Manufacturing costs for approved cell and gene therapies routinely exceed USD 1 million per treatment, driven by customised raw materials, extensive quality control testing and low batch volumes. A notable ripple effect is that reimbursement negotiations increasingly reference factory yield data; payers seek assurances that lot failure rates stay within single-digit thresholds to mitigate drug waste. Consequently, operations leaders are piloting closed, automated systems that reduce human manipulation points, thereby improving reproducibility.
Interestingly, large CDMOs are beginning to quantify automation return on investment not merely in direct labour savings but in expanded regulatory capacity; every reduction in manual interventions potentially reduces FDA inspection scope, freeing finite quality-assurance headcount to support more concurrent programs. This reframing elevates automation from a cost-containment initiative to a revenue-expandability lever.
Other drivers and restraints analyzed in the detailed report include:
- Growing Approvals and Robust Clinical Pipelines
- Increasing Investment and Funding
- Scarcity of Skilled Cell-Processing Workforce
For complete list of drivers and restraints, kindly check the Table Of Contents.
Segment Analysis
Cell therapy manufacturing controls approximately 59.30 % of current revenue, yet gene therapy services-anchored on viral vector supply-are expanding at a projected 23.3 % CAGR from 2026 to 2031. CDMOs with vertically integrated plasmid-to-fill capabilities are uniquely positioned to capitalise, as they can compress lead times by eliminating inter-company tech-transfer steps. While non-viral delivery technologies attract investor interest, they remain largely pre-commercial, so vector demand will likely outstrip supply through the end of the decade.
Phase II projects constitute the largest slice of today's workload, but commercial manufacturing is growing fastest, at an estimated 27.6 % CAGR. Late-stage sponsors are discovering that validation protocols designed for monoclonal antibodies do not automatically translate to living therapies. CDMOs that invested early in process analytical technologies are therefore winning contracts, as real-time monitoring meets regulators' expectations for consistent product quality even in patient-specific batches.
Geography Analysis
North America's 44.30% share reflects deep venture markets in 2025, mature regulatory frameworks, and a dense network of specialist CDMOs. The strategic placement of facilities near integrator air hubs in Louisville, Memphis, and Cincinnati shortens autologous vein-to-vein cycles, an operational advantage that now factors into payer reimbursement discussions.
Asia-Pacific's projected 20.80% CAGR is driven by government incentives, workforce investments, and rapid patient adoption. Countries such as South Korea have enacted accelerated approval routes for regenerative treatments, spurring developers to build local capacity. Yet the region must still scale specialized training programs to avoid labor shortages that could erode its cost advantage.
Europe combines stringent but transparent regulation with robust academic networks. Manufacturers here are pioneering real-time release testing pilots, aiming to reduce batch-release timelines and offset higher wage costs. In addition, EU sustainability directives are nudging facilities toward greener single-use systems, a differentiator for sponsors with corporate-social-responsibility mandates.
- Lonza Group
- Catalent
- Thermo Fisher Scientific
- Fujifilm Diosynth Biotechnologies (FUJIFILM Holdings)
- WuXi Advanced Therapies (WuXi AppTec)
- Charles River
- Samsung Biologics (Cell & Gene)
- Merck KGaA (MilliporeSigma)
- Minaris Regenerative Medicine
- Roche
- Oxford Biomedica plc
- National Resilience Inc.
- Andelyn Biosciences
- Nikon CeLL Innovation Co. Ltd.
- Takara Bio
- Genezen
- PlasmidFactory GmbH
- Vivebiotech
- ABL Inc.
Additional Benefits:
- The market estimate (ME) sheet in Excel format
- 3 months of analyst support
TABLE OF CONTENTS
1 Introduction
- 1.1 Study Assumptions & Market Definition
- 1.2 Scope of the Study
2 Research Methodology
3 Executive Summary
4 Market Landscape
- 4.1 Market Overview
- 4.2 Market Drivers
- 4.2.1 Surge in Prevalene of Cancer and Other Chronic Diseases
- 4.2.2 Sift Towards Personalized Medicine
- 4.2.3 Surge in Rare-Disease Designations Driving CGT Pipeline
- 4.2.4 Shift Toward Allogeneic "Off-the-Shelf" Platforms Requiring Large-Scale Bioreactors
- 4.2.5 Growing Approvals and Robust Clinical Pipelines
- 4.2.6 Increasing Investment and Funding
- 4.3 Market Restraints
- 4.3.1 High operational Costs
- 4.3.2 High Autologous CAR-T Batch-Failure Rates (≈15 %) Eroding CDMO Margins
- 4.3.3 Scarcity of Skilled Cell-Processing Workforce
- 4.3.4 Regulatory Harmonization Gaps
- 4.4 Value Chain Analysis
- 4.5 Regulatory & Technological Outlook
- 4.6 Porter's Five Forces Analysis
- 4.6.1 Bargaining Power of Suppliers
- 4.6.2 Bargaining Power of Buyers
- 4.6.3 Threat of New Entrants
- 4.6.4 Threat of Substitutes
- 4.6.5 Intensity of Rivalry
5 Market Size & Growth Forecasts (Value, USD)
- 5.1 By Service Type
- 5.1.1 Cell Therapy Manufacturing Services
- 5.1.1.1 Allogeneic
- 5.1.1.2 Autologous
- 5.1.2 Gene Therapy Manufacturing Services
- 5.1.2.1 Viral Vector
- 5.1.2.1.1 Adeno-Associated Virus (AAV)
- 5.1.2.1.2 Lentivirus
- 5.1.2.1.3 Retrovirus
- 5.1.2.2 Non-Viral Vector
- 5.1.2.2.1 Plasmid DNA
- 5.1.2.2.2 Lipid Nanoparticles (LNP)
- 5.1.2.1 Viral Vector
- 5.1.1 Cell Therapy Manufacturing Services
- 5.2 By Phase
- 5.2.1 Pre-clinical
- 5.2.2 Phase I
- 5.2.3 Phase II
- 5.2.4 Phase III
- 5.2.5 Commercial
- 5.3 By Application
- 5.3.1 Clinical Manufacturing
- 5.3.2 Commercial Manufacturing
- 5.4 By Indication
- 5.4.1 Oncology
- 5.4.2 Rare Diseases
- 5.4.3 Cardiovascular Diseases
- 5.4.4 Orthopedic Diseases
- 5.4.5 Infectious Diseases
- 5.4.6 Other Indications
- 5.5 By Mode of Operation
- 5.5.1 In-house
- 5.5.2 Contract / Outsourced
- 5.6 By End User
- 5.6.1 Pharmaceutical & Biotechnology Companies
- 5.6.2 Academic & Research Institutes
- 5.6.3 Hospital-Based GMP Units
- 5.6.4 Other End Users
- 5.7 By Geography
- 5.7.1 North America
- 5.7.1.1 United States
- 5.7.1.2 Canada
- 5.7.1.3 Mexico
- 5.7.2 Europe
- 5.7.2.1 Germany
- 5.7.2.2 United Kingdom
- 5.7.2.3 France
- 5.7.2.4 Italy
- 5.7.2.5 Spain
- 5.7.2.6 Rest of Europe
- 5.7.3 Asia-Pacific
- 5.7.3.1 China
- 5.7.3.2 Japan
- 5.7.3.3 India
- 5.7.3.4 South Korea
- 5.7.3.5 Australia
- 5.7.3.6 Rest of Asia-Pacific
- 5.7.4 Middle East
- 5.7.4.1 GCC
- 5.7.4.2 South Africa
- 5.7.4.3 Rest of Middle East
- 5.7.5 South America
- 5.7.5.1 Brazil
- 5.7.5.2 Argentina
- 5.7.5.3 Rest of South America
- 5.7.1 North America
6 Competitive Landscape
- 6.1 Market Concentration
- 6.2 Strategic Moves
- 6.3 Market Share Analysis
- 6.4 Company profiles (includes Global level Overview, Market level overview, Core Business Segments, Financials, Headcount, Key Information, Market Rank, Market Share, Products and Services, and analysis of Recent Developments)
- 6.4.1 Lonza Group AG
- 6.4.2 Catalent Inc.
- 6.4.3 Thermo Fisher Scientific Inc.
- 6.4.4 Fujifilm Diosynth Biotechnologies (FUJIFILM Holdings)
- 6.4.5 WuXi Advanced Therapies (WuXi AppTec)
- 6.4.6 Charles River Laboratories
- 6.4.7 Samsung Biologics (Cell & Gene)
- 6.4.8 Merck KGaA (MilliporeSigma)
- 6.4.9 Minaris Regenerative Medicine
- 6.4.10 F. Hoffmann-La Roche Ltd
- 6.4.11 Oxford Biomedica plc
- 6.4.12 National Resilience Inc.
- 6.4.13 Andelyn Biosciences
- 6.4.14 Nikon CeLL Innovation Co. Ltd.
- 6.4.15 Takara Bio Inc.
- 6.4.16 Genezen
- 6.4.17 PlasmidFactory GmbH
- 6.4.18 Vivebiotech
- 6.4.19 ABL Inc.
7 Market Opportunities & Future Outlook
- 7.1 White-space & Unmet-need Assessment
