
|
시장보고서
상품코드
2061988
농업용 착색제 시장 : 시장 점유율 분석, 업계 동향 및 통계, 성장 예측(2026-2031년)Agricultural Colorants - Market Share Analysis, Industry Trends & Statistics, Growth Forecasts (2026 - 2031) |
||||||
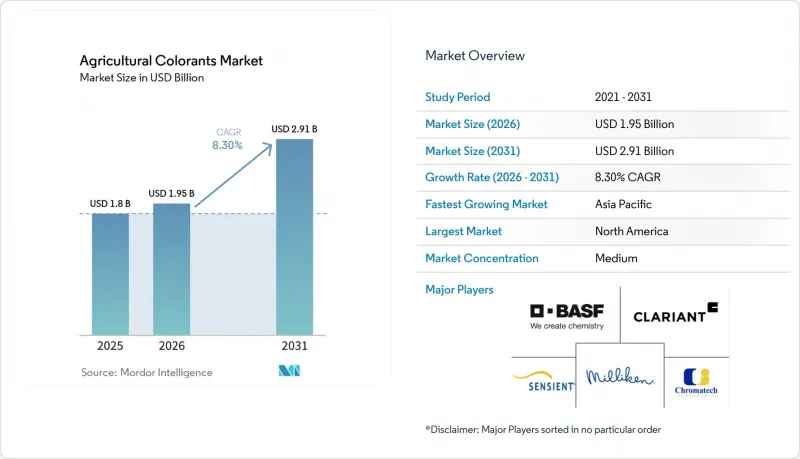
Mordor Intelligence에 의하면, 농업용 착색제 시장 규모는 2025년 18억 달러로 평가되었고, 2026년에는 19억 5,000만 달러로 추정되고, 게다가 2031년까지 29억 1,000만 달러에 이를 것으로 예측되며, 2026-2031년 CAGR 8.3%를 나타낼 전망입니다.
본 보고서는 제품 유형별(염료 및 안료), 용도별(종자 처리용 착색제 등), 형태별(액체, 분말 등), 작물 유형별(곡물, 지방종자, 콩류 등) 및 지역별(북미, 유럽, 아시아태평양, 남미, 아프리카, 중동)로 분류되어 있습니다. 본 보고서에서는 시장 규모 및 전망을 금액(달러) 기준으로 제시하고 있습니다.
세계의 농업용 착색제 시장 동향 및 분석
농약 규제에 따른 종자 색상 구분 의무화
농약 규제국에 따르면, 규제 당국은 종자 공급망에 색상 구분 요건을 도입하고 있습니다. 미국에서는 연방 규정에 따라 처리된 종자를 구분하도록 의무화하고 있으며, 캘리포니아주는 2025년에 네오니코티노이드계 농약에 대한 이러한 기준을 더욱 강화하고, 꽃가루 매개 생물의 노출을 최소화하기 위해 명확한 색상을 지정했습니다. 마찬가지로, 인도의 2026년 종자법에서는 300만 루피(3만 6,000달러)의 벌금이 도입되었으며, QR 코드를 통한 추적이 가능한 포장이 의무화되었고, 시장 진입을 위해서는 가시성이 있는 착색제의 사용이 사실상 의무화되어 있습니다. 성숙한 지역에서는 보급률이 상승하고 있지만, 동남아시아와 아프리카 일부 지역에서는 여전히 낮은 수준이며, 규정 준수 요건에 힘입어 새로운 기회가 창출되고 있습니다.
정밀 농업 분야의 가시 마커 수요
컴퓨터 비전 기능을 탑재한 살포기는 살포 패턴을 확인하기 위해 대비 염료를 사용하고 있습니다. 2023년에 북미의 대부분의 기종에 도입된 John Deere의 ‘See and Spray Ultimate’는 어두운 색의 토양에서 피복률을 확인하기 위해 지시약 염료를 사용하고 있습니다. 2024년 Ecorobotix에 따르면, 스위스에서 자사의 ARA 정밀 살포기를 사용한 시험 결과, 화학 약품 사용량이 95% 감소한 것으로 입증되었습니다. 시장에서는 양극화가 진행되고 있으며, 대규모 밭농사 농가들은 경제적인 청색 염료를 선호하는 반면, 특산 작물 생산자들은 드론을 이용한 살포 범위 매핑이 가능한 UV 가시화 혼합물을 선택하고 있습니다.
석유화학 염료 원료 가격의 변동
미국 에너지정보청(EIA)에 따르면, 석유화학 파생 제품과 밀접한 관련이 있는 원유 가격은 업스트림 에너지 시장의 급격한 변동을 반영하여 2023년에 약 10% 하락했습니다. 이러한 변동은 염료 중간체의 원가에 직접적인 영향을 미치며, 농업용 착색제 제조업체에게는 가격 불안정을, 농약 제조업체에게는 배합 원가 상승을 초래하고 있습니다. 또한, 석유화학 유래 원료에 대한 의존은 지정학적 긴장, 정유시설 가동 중단, 규제상의 문제와 같은 위험에 공급망을 노출시켜 비용의 불확실성을 가중시키고 있습니다. 업계에서는 의존도를 낮추기 위해 바이오 유래 대체재를 점차 모색하고 있지만, 높은 생산 비용과 확장성의 한계로 인해 여전히 광범위한 도입이 저해되고 있습니다.
부문별 분석
2025년 기준으로, 염료는 농업용 착색제 시장에서 가장 큰 점유율을 차지하여 시장의 46%를 차지했습니다. 이러한 장점은 용해성에 기인하며, 고속 수성 종자 코팅 공정에 적합하기 때문에 효율적이고 균일한 도포가 가능합니다. 안료 시장 규모는 가장 높은 성장률을 보일 것으로 예상되며, 2026-2031년 연평균 성장률(CAGR) 11.2%로 성장할 전망입니다. 이 안료는 내구성과 성능이 매우 중요한 고온의 열대 지역에 보관되는 폴리머 코팅 비료 등, 자외선 안정성이나 내열성이 요구되는 용도에서 선호되고 있습니다.
2차 조사에 따르면, 기존 기업들은 생분해성 분산제를 활용함으로써 시장의 지속성을 유지하고 있습니다. BASF SE가 2025년에 도입한 ‘Sokalan CP 301’은 폴리카프로락톤 바인더 내에서 안료의 현탁을 돕고, 미세 플라스틱 사용을 줄이는 데 기여합니다. 안료 제조업체들은 중금속계 적색·황색 안료를, 내퇴색성 기준을 충족하는 산화철이나 첨단 유기 안료로 대체해야 합니다. Clariant AG의 ‘Agrocer’ 시리즈는 유기계 적색 안료가 곡물에서도 동등한 성능을 발휘할 수 있음을 입증하고 있습니다. 그러나 크롬산염계 안료에 비해 비용이 높기 때문에 비료에의 적용은 여전히 제한적입니다.
2025년에는 농업용 착색제 시장에서 종자 처리가 41%로 가장 큰 시장 점유율을 차지할 것으로 예측됩니다. 미국 농무부(USDA) 보고서에 따르면, 이러한 우위는 주요 산지에서 옥수수 및 대두 작물이 거의 전면적으로 보급된 데 기인합니다. 한편, 작물 보호용 화학 착색제 부문은 2026-2030년 연평균 성장률(CAGR) 12.7%라는 가장 높은 성장률을 기록하며 확대될 것으로 전망됩니다. Precision Planting에 따르면, 2024년에 실시된 포장 시험에서 SymphonyVision 기술이 살포 중복을 최소화하고 실시간 노즐 제어를 가능하게 함으로써 제초제 낭비를 줄여, 그 결과 줄 재배 시스템에서의 살포 효율을 향상시킨다는 사실이 입증되었습니다.
용도의 세분화는 기기의 발전과 밀접한 관련이 있습니다. 종자 처리 용도에서는 폴리머 코팅과 효과적으로 결합되는 액체 염료가 사용되는 반면, 비료 혼합 업체에서는 공기 중의 미립자를 최소화하기 위해 분진이 발생하지 않는 과립을 선호합니다. 살포 작업자는 신선 농산물에 잔류물이 남는 것을 방지하기 위해, 신속하게 색이 바래는 액체 마커가 필요합니다. Chromatech는 이러한 다양한 수요에 부응하기 위해, 규정을 준수하는 여러 재고 관리 단위(SKU)를 제공합니다. 시장 동향은 드론 사용이 확대됨에 따라 정밀 기기의 도입이 진행되고 있음을 반영하고 있습니다. 지표용 염료는 기존에 주류를 이루던 종자 처리 용도와 판매량 격차를 좁힐 가능성이 있습니다.
지역별 분석
북미는 2025년에 32%를 차지했으며, 농업용 착색제 시장에서 가장 큰 점유율을 유지할 것으로 전망됩니다. 이러한 우위는 옥수수에서 널리 행해지는 종자 처리 관행과 시각적 구별을 의무화하는 규제 요건에 의해 뒷받침되고 있습니다. 캘리포니아주에서는 자외선을 활용한 규정 준수 감사에 대한 시범 사업이 진행되고 있으며, 이는 추적 가능한 안료에 대한 수요를 촉진할 가능성이 있습니다. 캐나다에서는 캐나다 보건부의 미세 플라스틱 관련 지침에 따라 생분해성 코팅의 사용이 권장되고 있습니다. 반면, 멕시코에서는 소규모 농가가 주를 이루기 때문에 종자 착색 기술의 보급은 제한적입니다. 그러나 시날로아 주의 채소 수출업체들은 점적 관개 시스템에서 제초제 낭비를 최소화하기 위해 살포 표시기를 도입하고 있습니다.
아시아태평양은 2026-2031년 연평균 성장률(CAGR) 10.8%를 기록하며 가장 높은 성장률을 보일 것으로 전망됩니다. 중국에서는 대규모 농업용 드론 군의 운용에 따라 저점도 지표 염료가 필요로 하고 있습니다. 한편, 베트남과 태국에서는 기계식 모내기 기계에 대한 정부의 보조금 덕분에, 현재 아직 보급률이 낮은 컬러 코딩의 도입이 촉진되고 있습니다. 또한 호주에서는 비용 상승이라는 과제가 있는 반면, 바이오 안료로의 전환이 진행되고 있습니다. 일본의 온실 재배 업계에서는 공급망의 진위 여부를 확인하기 위해 보이지 않는 태그의 사용을 검토하고 있습니다. 그러나 보다 광범위한 도입을 위해서는 비용 절감이 필수적입니다.
유럽 시장은 REACH 규제로 인한 안료 시장 철수 영향으로, 산화철 및 유기 안료를 우선시하는 신속한 배합 변경이 진행되고 있습니다. 서유럽에서는 종자 처리제 도입이 포화 상태를 넘어섰기 때문에 곡물 재배의 기계화가 진행됨에 따라 폴란드와 루마니아 등 동유럽 국가들로 성장세가 이동하고 있습니다. 남미에서는 대두나 사탕수수 등의 작물에 색상을 구분하는 방식이 도입된 것을 배경으로, 브라질이 농업용 착색제 시장을 독점하고 있습니다. 한편, 아르헨티나에서는 2025년까지 비료 수입이 17.5% 증가할 것으로 예상되며, 이는 입상 안료 수요를 끌어올릴 것으로 전망됩니다. 중동 및 아프리카 시장은 여전히 세분화되어 있으며, 남아프리카의 와인용 포도 재배 농가들은 인근 유기농 농장으로의 비산량을 최소화하기 위해 살포 지표에 대한 시험을 진행하고 있습니다.
기타 혜택 :
- 엑셀 형식 시장 예측(ME) 시트
- 3개월간의 애널리스트 지원
자주 묻는 질문
목차
제1장 서론
제2장 조사 방법
제3장 주요 요약
제4장 시장 구도
제5장 시장 규모 및 성장 예측
제6장 경쟁 구도
제7장 시장 기회 및 향후 전망
AJY 26.06.26According to Mordor Intelligence, the agricultural colorants market size is projected to grow from USD 1.80 billion in 2025 to USD 1.95 billion in 2026 and is further projected to reach USD 2.91 billion by 2031, registering a CAGR of 8.3% during 2026-2031.

This report is Segmented by Product Type (Dyes and Pigments), by Application (Seed Treatment Colorants, and More), by Form (Liquid, Powder, and More), by Crop Type (Cereals and Grains, Oilseeds, Pulses, and More) and by Geography (North America, Europe, Asia-Pacific, South America, Africa, and Middle East). The Report Offers the Market Size and Forecasts in Terms of Value (USD).
Global Agricultural Colorants Market Trends and Insights
Mandatory Seed-Color Coding Under Pesticide Regulations
According to the Department of Pesticide Regulation, regulators are incorporating color-coding requirements into seed supply chains. In the United States, federal regulations mandate the differentiation of treated seeds, and California further strengthened these standards in 2025 for neonicotinoids, specifying distinct colors to minimize pollinator exposure. Similarly, India's Seed Act of 2026 introduces monetary penalties of INR 3 million (USD 36,000) and requires QR-traceable packaging, effectively mandating the use of visible colorants for market entry. Penetration rates have increased in mature regions but remain lower in Southeast Asia and parts of Africa, providing opportunities driven by compliance requirements.
Demand for Visible Markers in Precision Agriculture
Computer-vision sprayers utilize contrast dyes to verify application patterns. John Deere's See and Spray Ultimate, deployed on most units across North America in 2023, uses indicator dyes to confirm coverage on dark soils. According to Ecorobotix in 2024, Swiss trials with the company's ARA precision sprayer demonstrated a 95% reduction in chemical usage. The market is experiencing divergence, with large row-crop growers favoring economical blue dyes, while specialty-crop producers are opting for UV-traceable blends that enable drone-based coverage mapping.
Petrochemical Dye Feedstock Price Volatility
According to the United States Energy Information Administration, crude oil prices, which are closely tied to petrochemical derivatives, decreased by approximately 10% in 2023, reflecting notable fluctuations in upstream energy markets. These variations directly influence the cost of dye intermediates, resulting in inconsistent pricing for agricultural colorant manufacturers and higher formulation costs for agrochemical companies. Furthermore, reliance on petrochemical-based inputs exposes the supply chain to risks such as geopolitical tensions, refinery disruptions, and regulatory challenges, exacerbating cost uncertainties. Although the industry is gradually exploring bio-based alternatives to reduce dependency, higher production costs and limited scalability continue to hinder their broader adoption.
Other drivers and restraints analyzed in the detailed report include:
- Adoption of Spray Indicator Dyes for Drones and Autonomous Sprayers
- Regulatory Push for Low-Dust, High-Load Seed Coatings
- Heavy-Metal and Volatile Organic Compound (VOC) Limits in Agrochemical Formulations
For complete list of drivers and restraints, kindly check the Table Of Contents.
Segment Analysis
Dyes accounted for the largest agricultural colorants market share in 2025, representing 46% of the market. This dominance is attributed to their solubility, which is well-suited for high-speed aqueous seed-coating processes, enabling efficient and uniform application. The pigments market size is projected to grow at the fastest rate, with a CAGR of 11.2% from 2026 to 2031. Pigments are preferred in applications requiring ultraviolet stability and heat resistance, such as polymer-coated fertilizers stored in elevated tropical temperatures, where durability and performance are critical.
Second-tier analysis highlights that incumbents are maintaining market continuity through the use of biodegradable dispersants. BASF SE's Sokalan CP 301, introduced in 2025, supports pigment suspension within polycaprolactone binders, facilitating the shift away from microplastics. Pigment manufacturers are required to replace heavy-metal reds and yellows with iron oxides or advanced organic pigments that meet fade-resistance standards. Clariant AG's Agrocer line demonstrates that organic reds can achieve comparable performance on cereals. However, the adoption of fertilisers remains limited due to higher costs compared to chromate pigments.
Seed treatment is projected to account for the largest market share of 41% for the agricultural colorants market in 2025. This dominance is attributed to near-universal coverage of corn and soybean crops in established regions, as reported by the United States Department of Agriculture (USDA). Meanwhile, the crop protection chemical colorants segment is projected to grow at the fastest CAGR of 12.7% from 2026 to 2030. According to Precision Planting, field trials conducted in 2024 showed that SymphonyVision technology reduces herbicide waste by minimizing spray overlap and enabling real-time nozzle control, thereby improving application efficiency in row crop systems.
Application fragmentation corresponds with advancements in equipment. Seed treatment applications utilize liquid dyes that integrate effectively into polymer coatings, while fertilizer blenders prefer dust-free granules to minimize airborne particulates. Spray operators require rapidly fading liquid markers to prevent residue on fresh produce. Chromatech offers multiple compliance-cleared stock-keeping units to cater to these varied demands. Market share dynamics reflect the adoption of precision equipment as drone usage increases. Indicator dyes may reduce the volume gap with traditionally dominant seed treatment applications.
Geography Analysis
North America is projected to hold the largest share of the agricultural colorants market, accounting for 32% in 2025. This dominance is driven by widespread seed treatment practices in corn and regulatory requirements mandating visible distinctions. California is conducting pilot ultraviolet compliance audits, potentially driving demand for traceable pigments. In Canada, biodegradable coatings are being encouraged under Health Canada's microplastic guidelines. In contrast, Mexico has limited seed-coloration coverage, primarily due to the dominance of smallholder farms. However, vegetable exporters in Sinaloa are implementing spray indicators to minimize herbicide waste in drip irrigation systems.
The Asia-Pacific region is projected to register the fastest CAGR of 10.8% from 2026 to 2031. China's large agricultural drone fleet necessitates low-viscosity indicator dyes. whereas government subsidies for mechanized rice planters in Vietnam and Thailand are facilitating the adoption of color-coding, which currently remains low. Meanwhile, Australia is shifting toward bio-based pigments, despite the challenges associated with higher costs. Japan's greenhouse sector is investigating the use of invisible taggants for supply chain authentication. However, broader implementation is contingent on achieving cost reductions.
The European market is influenced by REACH-driven pigment withdrawals, prompting swift reformulations favoring iron oxides and organic pigments. In Western Europe, seed-treatment adoption exceeds saturation, with incremental growth shifting eastward to countries like Poland and Romania as cereal mechanization advances. In South America, Brazil dominates the agricultural colorants market, driven by the adoption of color-coding for crops such as soy and sugarcane. Meanwhile, Argentina's projected 17.5% increase in fertilizer imports by 2025 is projected to boost demand for granular pigments. The Middle East and Africa markets remain fragmented, with South African wine-grape growers testing spray indicators to minimize drift onto neighboring organic farms.
- BASF SE
- Clariant AG
- Sensient Technologies Corporation
- Milliken & Company
- Chromatech, Inc.
- Huntsman International LLC (Venator Materials PLC)
- Organic Dyes and Pigments, LLC
- LANXESS AG
- RPM International Inc. (DayGlo Color Corp.)
- Sudarshan Chemical Industries Limited
- SP Colour & Chemicals
- Kuraray Co., Ltd.
- DIC Corporation
- Sun Chemical Corporation
- Heubach GmbH
Additional Benefits:
- The market estimate (ME) sheet in Excel format
- 3 months of analyst support
TABLE OF CONTENTS
1 Introduction
- 1.1 Study Assumptions and Market Definition
- 1.2 Scope of the Study
2 Research Methodology
3 Executive Summary
4 Market Landscape
- 4.1 Market Overview
- 4.2 Market Drivers
- 4.2.1 Mandatory seed-color coding under pesticide regulations
- 4.2.2 Demand for visible markers in precision agriculture
- 4.2.3 Adoption of spray indicator dyes for drones and autonomous sprayers
- 4.2.4 Regulatory push for low-dust, high-load seed coatings
- 4.2.5 UV-traceable colorants for pesticide coverage audit
- 4.2.6 Invisible taggants for AI-based supply chain authentication
- 4.3 Market Restraints
- 4.3.1 Petrochemical dye feedstock price volatility
- 4.3.2 Heavy-metal and volatile organic compound (VOC) limits in agrochemical formulations
- 4.3.3 Dye-active-ingredient interaction risks
- 4.3.4 Seed trait ID technologies reducing color-coding needs
- 4.4 Regulatory Landscape
- 4.5 Technological Outlook
- 4.6 Porter's Five Forces Analysis
- 4.6.1 Threat of New Entrants
- 4.6.2 Bargaining Power of Suppliers
- 4.6.3 Bargaining Power of Buyers
- 4.6.4 Threat of Substitutes
- 4.6.5 Intensity of Competitive Rivalry
5 Market Size and Growth Forecasts (Value)
- 5.1 By Product Type
- 5.1.1 Dyes
- 5.1.2 Pigments
- 5.2 By Application
- 5.2.1 Seed Treatment Colorants
- 5.2.2 Fertilizer and Soil Amendment Colorants
- 5.2.3 Crop Protection Chemical Colorants
- 5.2.4 Irrigation and Foam Marker Colorants
- 5.3 By Form
- 5.3.1 Liquid
- 5.3.2 Powder
- 5.3.3 Granules
- 5.4 By Crop Type
- 5.4.1 Cereals and Grains
- 5.4.2 Oilseeds
- 5.4.3 Pulses
- 5.4.4 Fruits and Vegetables
- 5.4.5 Other Crops
- 5.5 By Geography
- 5.5.1 North America
- 5.5.1.1 United States
- 5.5.1.2 Canada
- 5.5.1.3 Mexico
- 5.5.1.4 Rest of North America
- 5.5.2 South America
- 5.5.2.1 Brazil
- 5.5.2.2 Argentina
- 5.5.2.3 Rest of South America
- 5.5.3 Europe
- 5.5.3.1 Germany
- 5.5.3.2 France
- 5.5.3.3 United Kingdom
- 5.5.3.4 Italy
- 5.5.3.5 Spain
- 5.5.3.6 Russia
- 5.5.3.7 Rest of Europe
- 5.5.4 Asia-Pacific
- 5.5.4.1 China
- 5.5.4.2 India
- 5.5.4.3 Japan
- 5.5.4.4 Australia
- 5.5.4.5 Indonesia
- 5.5.4.6 Vietnam
- 5.5.4.7 Thailand
- 5.5.4.8 Philippines
- 5.5.4.9 Rest of Asia-Pacific
- 5.5.5 Middle East
- 5.5.5.1 Saudi Arabia
- 5.5.5.2 United Arab Emirates
- 5.5.5.3 Rest of Middle East
- 5.5.6 Africa
- 5.5.6.1 South Africa
- 5.5.6.2 Egypt
- 5.5.6.3 Rest of Africa
- 5.5.1 North America
6 Competitive Landscape
- 6.1 Market Concentration
- 6.2 Strategic Moves
- 6.3 Market Share Analysis
- 6.4 Company Profiles (Includes Global level Overview, Market level overview, Core Segments, Financials as available, Strategic Information, Market Rank/Share for key companies, Products and Services, and Recent Developments)
- 6.4.1 BASF SE
- 6.4.2 Clariant AG
- 6.4.3 Sensient Technologies Corporation
- 6.4.4 Milliken & Company
- 6.4.5 Chromatech, Inc.
- 6.4.6 Huntsman International LLC (Venator Materials PLC)
- 6.4.7 Organic Dyes and Pigments, LLC
- 6.4.8 LANXESS AG
- 6.4.9 RPM International Inc. (DayGlo Color Corp.)
- 6.4.10 Sudarshan Chemical Industries Limited
- 6.4.11 SP Colour & Chemicals
- 6.4.12 Kuraray Co., Ltd.
- 6.4.13 DIC Corporation
- 6.4.14 Sun Chemical Corporation
- 6.4.15 Heubach GmbH
